

Abstract
The oxygen atom transfer reactivity of Tp*MoO2(SPh) (1) (where Tp* = hydrotris-(3,5-dimethylpyrazol-1-yl)borate) with trimethyl phosphine (PMe3) has been investigated. The reaction proceed through a diamagnetic phosphoryl intermediate complex, Tp*MoO(SPh)(OPMe3) (2), which has been isolated and characterized by IR, NMR, UV-visible spectroscopy, and mass spectrometry. The molecular structure of 2 has been determined by X-ray crystallography. The complex crystallizes in monoclinic (P21/n) space group, a = 19.81 (1) Å, b = 11.1 (4) Å, c = 18.416 (5) Å, β= 121.2 (3)°, V = 3463.8(25) Å3 with Z = 4. In acetonitrile, complex 2 exchanges its phosphoryl ligand with a solvent molecule resulting in Tp*MoO(SPh)(MeCN) (3), which has been isolated and also characterized spectroscopically and by X-ray crystallography. Compound 3 crystallizes in triclinic (P-1) space group, a = 10.159 (6) Å, b = 18.563 (5) Å, c = 7.986 (3) Å, α = 96.22(3)°, β = 121.2 (3)°, γ = 84.64(3)°, V = 1452.4(11) Å3 with Z = 2. The electronic structures of the complexes have been investigated by density functional theory and the redox chemistry has been investigated by cyclic and differential pulse voltammetry. In acetonitrile, complex 2 spontaneously transforms to complex, 3 at a rate of 5.6 × 10⁻⁴ s−1.
Introduction
The functional unit of sulfite oxidase (SO) and eukaryotic nitrate reductase (Euk-NR) has a cysteinato sulfur coordinated to a dioxo-molybdenum center [1,2,3,4]. It is generally accepted that these two enzymes catalyze the substrate redox via oxygen atom transfer (OAT) reactions, whereby the molybdenum center shuttles between a [MoVIO2]2+ and a [MoIVO]2+ core. The crystal structure of chicken liver SO has demonstrated that the equatorial oxo-group is placed at the bottom of a channel that is approachable by the substrate. Three other equatorial positions are occupied by a cysteinato sulfur and ene-dithiolato sulfur donors. The proposed catalytic cycle for the oxidation of sulfite involves the binding of the substrate to the oxidized-Mo(VI) site, transfer of a terminal oxo-group to the substrate with concomitant reduction of the metal center, and release of the product from the reduced Mo(IV)-center [5]. The vacant coordination site at the metal center is then occupied by a solvent (i.e., water) molecule.
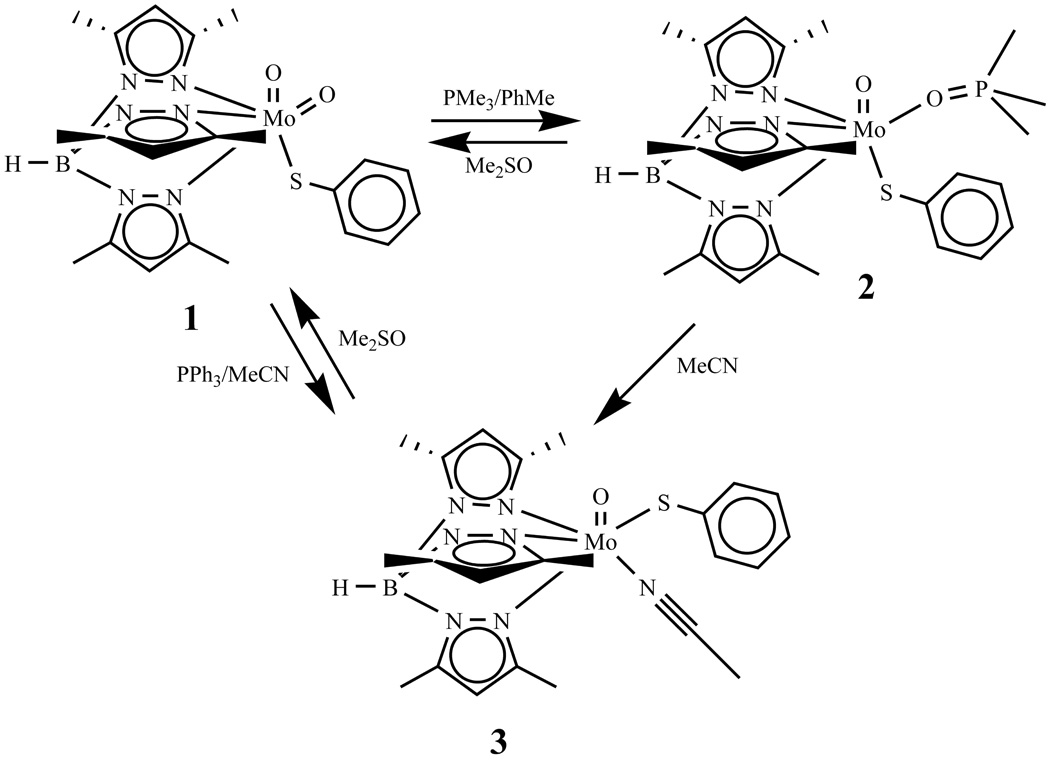
Studies from several laboratories have demonstrated that a variety of discrete oxo-molybdenum(VI) complexes can carry out the atom transfer chemistry when reacted with oxygen atom abstractors producing oxidized species such as tertiary phosphines oxides, sulfoxides, N-oxides, tertiary arsine-oxide, or sulfate [6,7,8,9,10,11,12,13,14,15,16,17]. Using tertiary phosphines (PR3), we have demonstrated that OAT reactions from [MoVIO2]2+ cores proceed in steps involving the formation of a phosphoryl coordinated Mo(IV) center which losses the phosphoryl ligand, and the vacant site is occupied by a solvent molecule [18,19,20,21]. However, the properties of the individual components i.e., the parent dioxo-Mo(VI) complex, the monooxo-Mo(IV) phosphoryl-intermediate complex or the monooxo-Mo(IV) solvent coordinated in a single molecular system have not been fully understood. Herein we describe structural, spectroscopic, and electrochemical properties of a dioxo-Mo(VI), Tp*MoVIO2(SPh) (1) [22], and monooxo-Mo(IV) complexes, Tp*MoIVO(SPh)(OPMe3) (2), and Tp*MoIVO(SPh)(MeCN) (3), respectively (where Tp* = hydrotris(3,5-dimethylpyrazol-1-yl)borate). The latter two complexes are the intermediate and the product of OAT reaction of 1 with trimethyl phosphine, respectively (Scheme 1), which provides an opportunity of direct comparison of the spectroscopic and structural parameters in the same molecular system. We also report the redox properties of 2 and 3 and the rate of conversion of 2 to 3, which follows a first order process in acetonitrile.
scheme.
Experimental Section
All syntheses were conducted using standard Schlenk techniques under dry Ar-atmosphere or inside an inert atmosphere (dry) box under N2 atmosphere. Solvents were purchased from commercial sources such as the Aldrich Chemical Co and the Acros Chemical Co and purified as follows: toluene and hexane from Na-benzophenone; acetonitrile (MeCN) over P2O5. Compound 1 was synthesized using the published procedure [23]. Reactions and workups of compounds 2 and 3 were carried out inside the dry box.
Synthesis of Tp*MoO(SPh)(OPMe3) [2]
To a solution of Tp*MoO2(SPh) (100 mg, 0.19 mmol) in toluene (15 mL), PMe3 (78 µL 0.76 mmol) was added and the reaction mixture was stirred for 45 min. Partial evaporation of the solvent (to 5 mL) followed by addition of hexane (~ 50 mL) yielded a green precipitate, which was filtered, washed with hexane several times, and dried under nitrogen to yield the target compound as a light green powder (75 mg, 65%). 1H NMR (500 MHz, acetonitrile-d3, s, 1.92 ppm, 3H, Me; d, 1.97 ppm, 9H, J = 13.2Hz, OPMe3; s, 2.35 ppm, 3H, Me; s, 2.42 ppm, 3H, Me; s, 2.54 ppm, 3H, Me; s, 2.58 ppm, 3H, Me; s, 2.64 ppm, 3H, Me; s, 5.67, 5.78, 5.96 ppm, 1H, pyrazole CH; d, 6.59 ppm, 2H, J = 8 Hz, arom. CH; t, 6.73 ppm, 2H, J = 7 Hz, arom. CH; t, 6.79 ppm, 1H, J = 7 Hz, arom. CH. 31P NMR (121.5 MHz, benzene-d6): 62.88. IR (KBr-pellet): 945 cm−1(νMo=O), 1120 cm−1 (νO=PMe3), 2526 cm−1 (νB-H). Positive mode electrospray ionization mass spectrum, ESI+MS in CH3CN: m/z: 611.3, [M]+, 560.4 [M-OPMe3+CH3CN]+; [M]+ (M=C24H36N6O2SPMoB, 612.1).
Synthesis of Tp*MoO(SPh)(MeCN) (3) [24]
To the solution of Tp*MoO2(SPh) (100 mg, 0.19 mmol) in MeCN (15 mL), a solution of PPh3 (200 mg, 0.76 mmol) in MeCN (5 mL) was added and the mixture was stirred for 1h. Solvent was partially evaporated (to nearly 2 mL) and small amount of toluene (1 mL) was added to it. The mixture was layered with excess hexane (nearly 25 mL) and kept inside a refrigerator for 2h. A cyan colored precipitate formed, which was filtered, washed with hexane several times, and dried under nitrogen to yield 50% (55 mg) a cyan powder which was the target compound. 1H NMR (500 MHz, acetonitrile-d3, s 2.25 ppm, 3H, CH3; s, 2.29 ppm, 3H, CH3; s, 2.44 ppm, 3H, CH3; s, 2.56 ppm, 3H, CH3; s, 2.58 ppm, 3H, CH3CN; s, 2.65 ppm, 6H, 2CH3); s, 5.64 ppm, 1H, pyrazole CH; s, 6.03 ppm, 1H, pyrazole CH; s, 6.12 ppm, 1H, pyrazole CH; t, 7.06 ppm, 1H, J = 7 Hz, arom. CH; t, 7.20 ppm, 2H, J = 7 Hz, arom. CH; d, 7.40 ppm, 2H, J = 7 Hz, arom. CH. IR (KBr-pellet): 944 cm−1(νMo=O); 2262 cm−1(νC=N), 2547 cm−1(νB-H). Positive mode electrospray ionization mass spectrum, ESI+MS in CH3CN: m/z: 560.4 [M+H]+ (M=C23H30N7OSMoB, 559.6). While we were preparing this manuscript, synthesis of this compound was reported. See ref [25]
Physical Measurements
NMR spectra were recorded in deuterated solvents obtained from Cambridge Isotope laboratories in sealed ampoules and passed through an alumina column prior to use. Infrared spectra were recorded on a Perkin-Elmer FT-IR 1760X spectrometer in KBr pellets. Low resolution electrospray ionization mass spectra (ESIMS) were collected on a Micromass ZMD mass spectrometer using both negative and positive ionization modes. Acetonitrile solutions of the samples were injected via a syringe pump with a flow rate of 0.1 – 0.2 mL/min. Electronic spectra of complexes were recorded in Cary 3 or Cary 14 spectrophotometers. Cyclic voltammograms (CVs) of complexes were recorded in a Bioanalytical systems (BAS) model CV-50W using a standard three electrode system consisting of Pt-disk working and reference electrodes and a Pt-wire auxiliary electrode. Measurements were performed under nitrogen atmosphere in dry degassed MeCN using 0.1M Bu4NClO4 of supporting electrolyte. The potentials were internally calibrated with, and presented with respect to the Fc+/Fc couple. Electrochemical measurements of compound 2 were completed in less then two min (during this time conversion of 2 to 3 is ~7%), where the first scan (rate: 100 mV/s) was recorded in less then 30s (~1% conversion to 3) after the dissolution of the complex in MeCN.
X-ray Crystallography
X-ray quality single crystals were selected under the microscope, coated with the epoxy resin, and mounted on glass fibers. X-ray intensities were measured on a Rigaku AFC7R four-circle diffractometer using graphite-monochromatized Mo Kα radiation (λ = 0.71069Å) at room temperature using the ω–2θ scan technique. The cut off limit of the reflection was I>3σ(I). Three standard reflections were measured every 150 reflections; a linear correction factor was applied. The structures of complexes were initially solved by Patterson method using TeXsan crystallographic software package of Molecular Structure Corporation [26] then they were refined using Crystals for Windows package [27]. A benzene molecule was found in the crystal lattice of compound 2, which was modeled using the following parameters: distance (C-C) = 1.39 (±0.02) and bond angle (∠C-C-C) = 120.00 (±0.02). Selected crystal data for 2 and 3 are presented in Table 1.
Table 1.
Crystallographic Data
| 2 | 3 | |
|---|---|---|
| Formula | C24H36B1Mo1N6O2P1S1 | C25H33N8O1S1B1Mo1 |
| Fw | 688.49 | 600.41 |
| Crystal system | Monoclinic | Triclinic |
| Space group | P21/n | P-1 |
| a, Å | 19.81(1) | 10.159 (6) |
| b, Å | 11.1 (4) | 18.563 (5) |
| c, Å | 18.416 (5) | 7.986 (3) |
| α, deg | 96.22 (3) | |
| β, deg | 121.2 (3) | 103.44 (4) |
| γ, deg | 84.64 (3) | |
| V, Å3 | 3463.8 (25) | 1452.4 (11) |
| Z | 4 | 2 |
| ρcalcd (g cm−1) | 1.32 | 1.373 |
| Data colleted | 7944 | 6679 |
| R(F2) | 0.076 | 0.1024 |
| wR(F2) | 0.099 | 0.2338 |
Computational Methods
All calculations were carried out using Gaussian 03W software package [28]. For the electronic structure calculations, the starting geometries were obtained from X-ray crystal structures and used as obtained. Becke’s three-parameter hybrid exchange functional [29] and Lee-Yang-Parr non-local correlation functional [30] (B3P86) was used with DGDZVP basis set for molybdenum, 6-311G(d) basis set [31] for the atoms involved in the first coordination sphere, and 6-31G(d) basis set applied for all other atoms. The percentages of atomic orbital contributions to their respective molecular orbitals were calculated by using the VMOdes program [32].
Results and Discussion
Synthesis and Spectroscopy
An incomplete OAT reaction between compound 1 and trimethyl phosphine (PMe3) in toluene has been used to synthesize phosphine oxide coordinated complex, 2 (Scheme 1). Upon addition of PMe3, the brown colored solution of 1, changes to dark green from which 2 has been isolated in a good yield. In contrary, 3 has been isolated in moderate yields from 1 by reacting it with PPh3 in MeCN. Compound 3 (Scheme 1) can also be synthesized by dissolving 2 in MeCN, which changes green color of 2 into cyan. In methyl sulfoxide, 2 and 3 react to generate parent dioxo-compound, 1.
Solution 1H NMR spectra of 1 exhibit four singlet resonances due to the six methyl groups indicating a local Cs symmetry. In 2 and 3 these methyl protons appear as six separate resonances indicating lowering in symmetry to C1 (Figure S1, supporting information) [21,33]. The NMR spectrum of 1. Three C-H (methine) protons of the pyrazole rings also appear as three distinct single peaks in 2 and 3. Compared to 2, the aromatic protons in 3 exhibit a shift towards the higher fields, albeit the magnitude of the shift is smaller, suggesting stronger electron withdrawing effect of MeCN ligand. In addition, a characteristic sharp doublet at δ=1.97 ppm (J = 13 Hz), due to the coordinated OPMe3, has been observed in 2 at a higher frequency than that observed for free OPMe3 (δ = 1.41 ppm). Room temperature 1H NMR spectrum of 3, exhibits a resonance at δ =2.55 ppm due to the methyl protons of the coordinated MeCN ligand, which disappears with time as it exchanges with the bulk solvent molecules. This methyl resonance and the methyl resonances from the pyrazole ring exhibit a temperature dependent chemical shift and line widths (Figure 1). At a low temperature, the methyl resonances move towards the lower fields. The methyl resonance from the coordinated MeCN (peak e, ~2.50 ppm at 235 K) appears as a broad peak and sharpens at a higher temperature (at 302 K, 2.58 ppm). Similarly protons of the thiophenol group and the methyl resonances (Figure 1, peaks a and f) from the pyrazole ring appear as broad peaks at lower temperatures, which sharpen with increasing the temperature. In addition, the methine-proton of pyrazole at 6.13 ppm at 235 K show a temperature dependent broadening. Such temperature dependent changes suggest a chemical exchange, which we propose is due to the exchange of the coordinated MeCN ligand with bulk solvent. Interestingly, this exchange also influences pyrazole and thiophenol proton resonances, although they move in the opposite direction to that of the methyl groups. No such temperature dependent movements of the methyl or methyne resonances have been observed for compound 2. The 31P NMR spectrum of 2 in benzene-d6 shows a peak for coordinated OPMe3 at 62.0 ppm, which is deshielded by ~26 ppm relative to the free OPMe3 (36.2 ppm).
Figure 1.
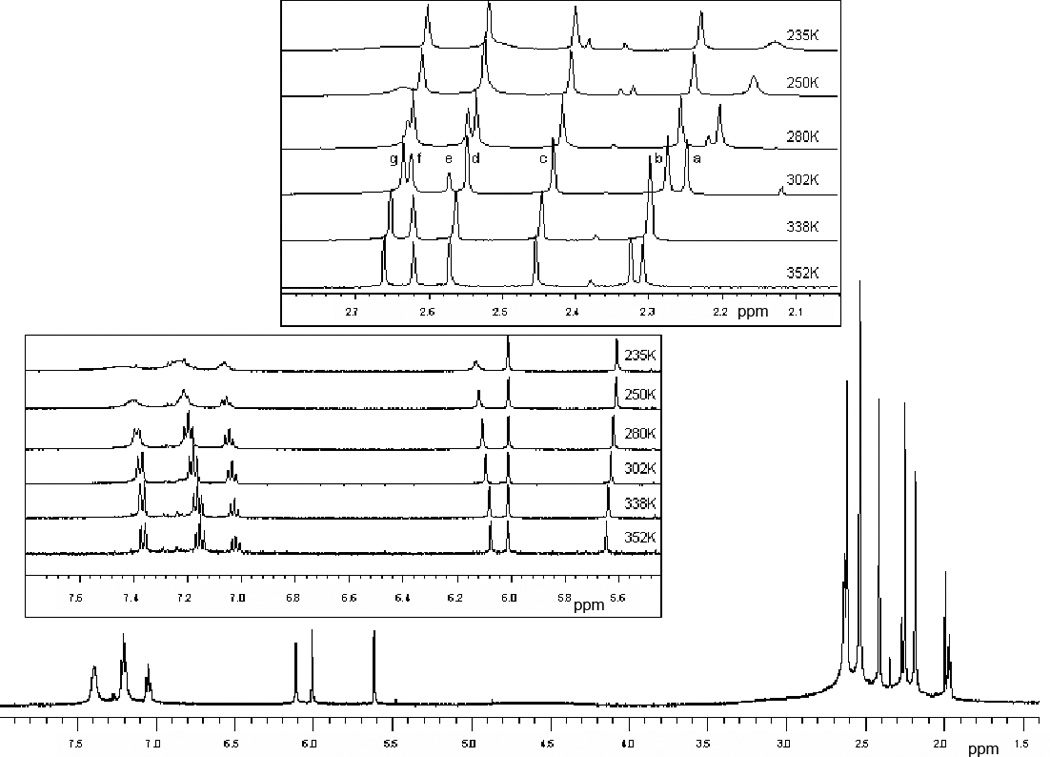
Variable temperature 1H NMR spectra of 3 in acetonitrile-d3. Note than signals at ~2.4 ppm due to small impurity are also temperature dependent
Infrared spectrum of 1 exhibits characteristic cis-dioxo vibrations (900 and 930 cm−1) that changes to a sharp vibration at ~ 945 cm−1 due to a terminal Mo=O unit in 2, similar to other phosphoryl complexes [19,21,33]. Interestingly, the position of this band in 3 does not change when the OPMe3 is replaced with MeCN. The ν(B-H) vibration from the scorpionate ligand has been observed at ca. 2526 cm−1 in 1 and 2, however, it is shifted ~20 cm−1 higher in energy in 3 (2547 cm−1). In addition, a sharp ν(O=P) stretch for coordinated OPMe3 has been observed in 2 at 1120 cm−1, which is slightly higher than that observed for Tp*MoOCl(OPR3) complexes [21].
The UV-visible spectra of 2 and 3 have been recorded in freshly prepared solutions in MeCN at 285 K (Figure 2, Table 2). The electronic spectra of the three compounds are distinctly different. For example, 1 has a shoulder ~500 nm (ε ~ 750 M−1 cm−1), and a band at 367 nm (ε ~ 3800 M−1 cm−1), the former is likely to be a S→ Mo charge transfer transition. In 2, two major bands can be observed, one at 411 nm (ε ~ 720 M−1 cm−1) and another one at 760 nm (ε ~ 160 M−1 cm−1). These features are consistent with other phosphoryl intermediate complexes whose electronic transitions have been discussed previously [21,33]. In 3, there are two low energy transitions at 643 nm and at 762 nm. The ligand field theory suggests that the d-orbitals in oxo-molybdenum complexes are to follow the order dxy<dxz~dyz<dx2-y2<dz2. Accordingly, the lowest energy dxy → dxz transition is lose in energy to the dxy → dyz transition. In 2, these two transitions are sufficiently close in energy such that they are not resolved. In 3, however, the two dπ orbitals (dxz and dyz) are energetically apart resulting in two distinct bands. This description is consistent with the density functional calculation described later. Another interesting point in these molecules, is that the extinction coefficients are larger than the corresponding chloro complexes, Tp*MoO2Cl and Tp*MoOCl(OPMe3) [21], which suggests that the sulfur orbitals contribute to the frontier orbitals significantly and that the contribution from sulfur increases the intensity.
Figure 2.
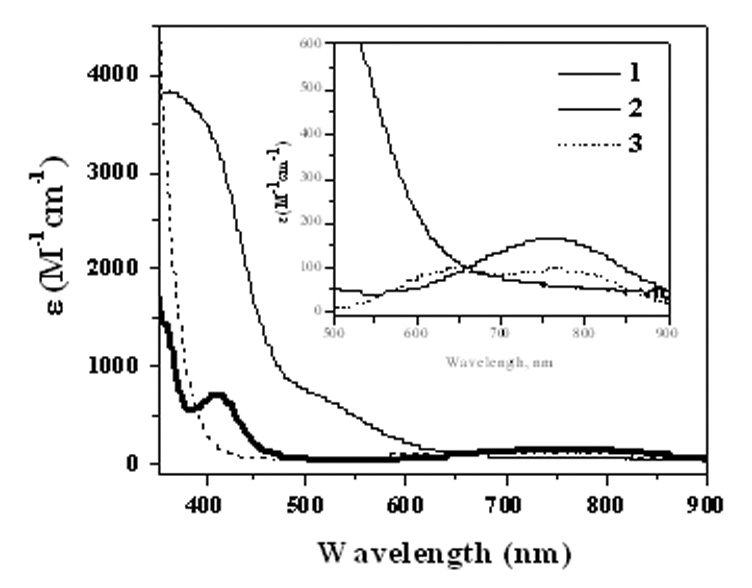
Electronic spectra of 1 (thin line), 2 (bold line), and 3 (dotted line) recorded at 285 K in MeCN.
Table 2.
UV-visible spectral and cyclic voltammetric data in freshly prepared MeCN solutions.
| Complex | UV-visible Spectraa | Electrochemistryb |
|
|---|---|---|---|
| λ, nm (ε, M−1cm−1) | E1/2 (V) | ΔEp (mV) | |
| 2 | 411 (716), 760 (165) | −0.446 | 67 |
| 3 | 375sh (785), 643 (96), 762 (96) | −0.070 | 75 |
Recorded at 285K
Measured at 100 mV s−1 in dry and degassed MeCN at 295 K, the potentials are expressed with respect to Fc+/Fc couple with same scan rate, sh – shoulder.
X-ray Crystallography
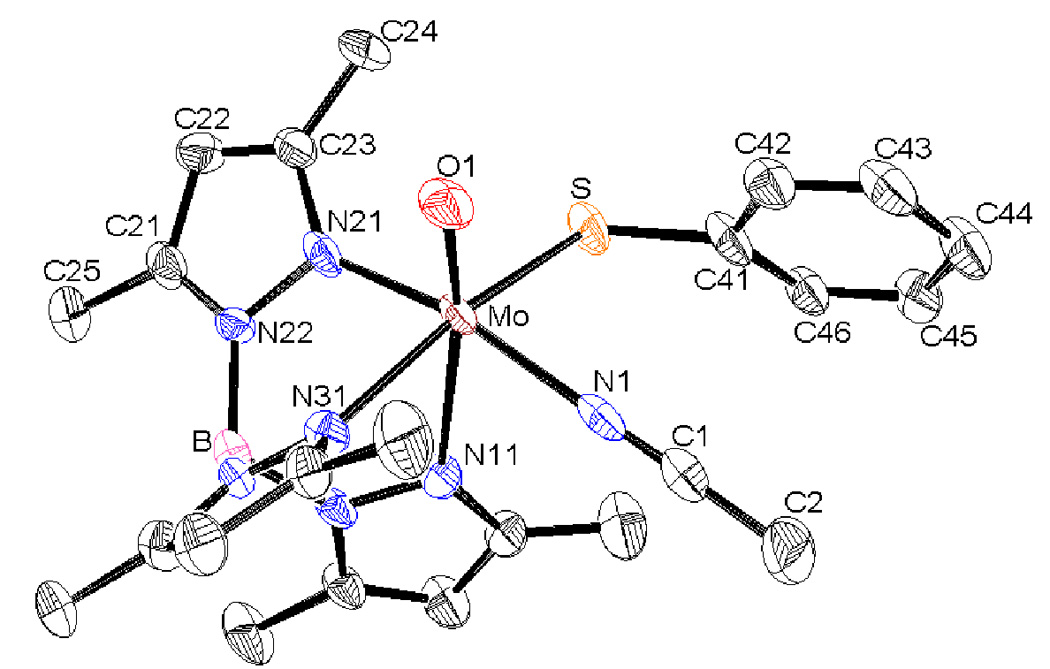
Suitable crystals for single crystal diffractometry have been obtained from benzene/hexane solution of 2 and MeCN/benzene/hexane solution of 3. The crystal structures of 2 and 3 show that ligands are arranged in a distorted-octahedral geometry with a local C1 geometry about the Mo-center (Figure 3 and Figure 4). The tridentate scorpionate ligand occupies a face of the octahedron, and other positions are occupied by terminal oxo group, thiolato sulfur and OPMe3 in 2 and MeCN in 3. Selected metric parameters of 1, 2 and 3 are listed in Table 3. The Mo=O(1) bond is shorter in 2 and 3 as compared to 1. The Mo-O(P) bond length in 2 is indicative of a single bond while the P=O distance of 1.504(6) Å is slightly longer than the P=O bond distance of 1.4763 Å in free OPH3 determined by microwave spectroscopy [34] Also, it is significantly shorter than the O-P single bond found in P4O10 (1.6 Å) [35]. Similar Mo-O(P) distances were observed in other phosphoryl intermediate complexes [21,33]. There is no noticeable change in the Mo-S bond length in 2, although it is slightly longer in 3. The Mo-N(n1) (n = 1–3, pyrazole) distances are in accord with the normal trans influence of the coligands and follow trans effect order oxo > thiolato > OPMe3 ~ MeCN. Bond angles O(P)-Mo-N(n1) (n = 1–3, pyrazole) approached to the ideal octahedral arrangement (~90°) for n = 2 and 3 but for n = 1, the values are still obtuse (by about 10–15°). A shorter O-Mo-O angle in 2 (~99°) compared to 1 indicates a decrease in the π-electron interactions between two oxygen ligands in 2. The O(1)-Mo-S angle is slightly larger in 2 (by ~ 4°), compared to 1, but the O(2)-Mo-S angle is decreased by ~15°. Further, the Mo-S-C bond angle expands from 106° to 118° in going from 1 to 2. Similarly, the O(1)-Mo-S bond angle and O(1)-Mo-S-C(Ph) torsion angle expands indicating substantial structural change due to the introduction of PMe3 molecule. The O1=Mo-N(1) bond angle (99.5°) is similar to the intermediate O=Mo-O(2) bond angle.
Figure 3.
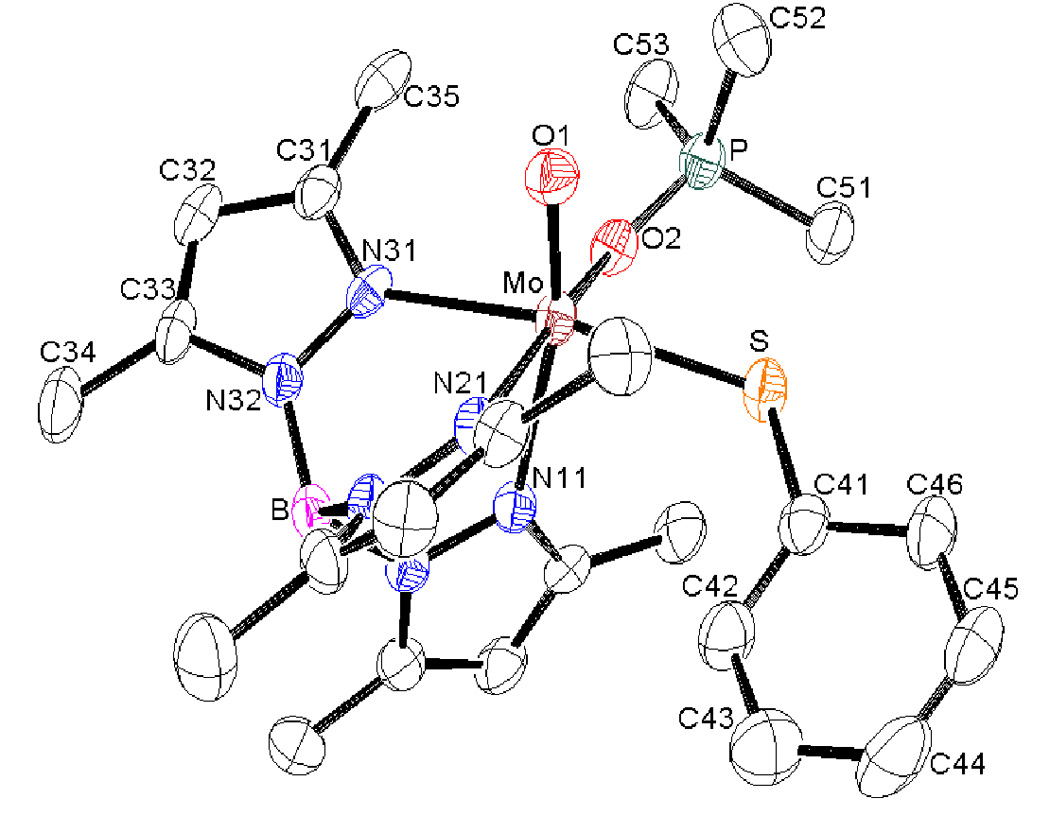
ORTEP diagram of 2 shown at 30% probability level. Hydrogen atoms have been omitted for clarity
Figure 4.
ORTEP diagram of 3 shown at 30% probability level. Hydrogen atoms have been omitted for clarity.
Table 3.
Selected Bond Distances (Å) and Angles (deg)
| distance/angle | 1a | 2 | 3 |
|---|---|---|---|
| Mo-O(1) | 1.702(4) | 1.686(5) | 1.670(10) |
| Mo-O(2) | 1.696 (4) | 2.153(6) | |
| Mo-S | 2.402(2) | 2.404(3) | 2.421(4) |
| P=O(2) | 1.504(6) | ||
| Mo-N(1) | 2.124(18) | ||
| Mo-N(11) | 2.301(4) | 2.367(6) | 2.418(12) |
| Mo-N(21) | 2.302(4) | 2.144(6) | 2.121(15) |
| Mo-N(31) | 2.169(4) | 2.234(7) | 2.201(11) |
| O(1)-Mo-O(2)/N(1) | 102.6(2) | 99.3(2) | 99.5(3) |
| O(1)-Mo-S | 99.4(1) | 103.9(2) | 102.2(4) |
| O(2)-Mo-S | 100.4(1) | 84.0(2) | |
| Mo-S-C(41) | 105.8(2) | 118.4(3) | 110.7(6) |
| Mo-S-C(41)-C(42) | −28.3 | 34.8 | −59.3 |
| O(1)-Mo-S-C(41) | 61.6, −43.2 | 104.6 | 78.3 |
Data taken from reference 22
In the crystal structure of 3, the MeCN ligand coordinates to the metal in a linear fashion. The Mo-N(MeCN) bond length (2.124(18) Å) is longer than the reported Mo=N (~1.715 Å) for Mo-imido complexes [36], and consistent with other reported MeCN coordinated complexes [37]. The C=N (1.15 (3) Å) bond length also agrees with the reported distances [38]. The Mo-N(1)-C(1) bond angle (176.5°) deviates slightly from ideal 180°. Like in 2, the O(1)-Mo-S angle also expands to 102° in 3. Similarly, compared to 1, O(1)-Mo-S and O(1)-Mo-S -C(Ph) angles also increases, however, the magnitude of these changes are smaller than those observed for 2. The orientational change in thiophenolato ligand is described by Mo-S-C(41)-C(42/46) torsion angle, which also shows a large change in 2 and 3 compared to 1. Interestingly, no such structural reorganization has been observed in an analogous system where the thiophenol group is replaced with a phenol [39].
Electrochemistry
The electrochemical properties of 2 and 3 have been investigated by cyclic voltammetry (Figure 5) and differential pulse voltammetry (Figure 6) in MeCN, and results are summarized in Table 2. Both complexes exhibit a reversible, one electron Mo(V/IV) redox couple with the redox potentials (E1/2) at −0.446 V for 2 and −0.07 V for 3, respectively. Compound 2, however, also exhibit a response due to the formation of 3 as shown in Figure 5. The linear dependence of the peak currents (ic and ip) with square root of scan rate (ν1/2) and a reverse-to-forward peak current ratio close to unity indicate a diffusion controlled process. The peak-to-peak separation (ΔEp) values are close to a typical one electron redox process. The reversible nature of the voltammograms indicates that the compounds are electrochemically stable. A higher positive redox potential of 3 compared to 2, making 3 easier to oxidize, is due to the higher π-donating ability of the OPMe3 as opposed to MeCN, which reduces the electron density at the metal center resulting in a higher oxidation potential.
Figure 5.
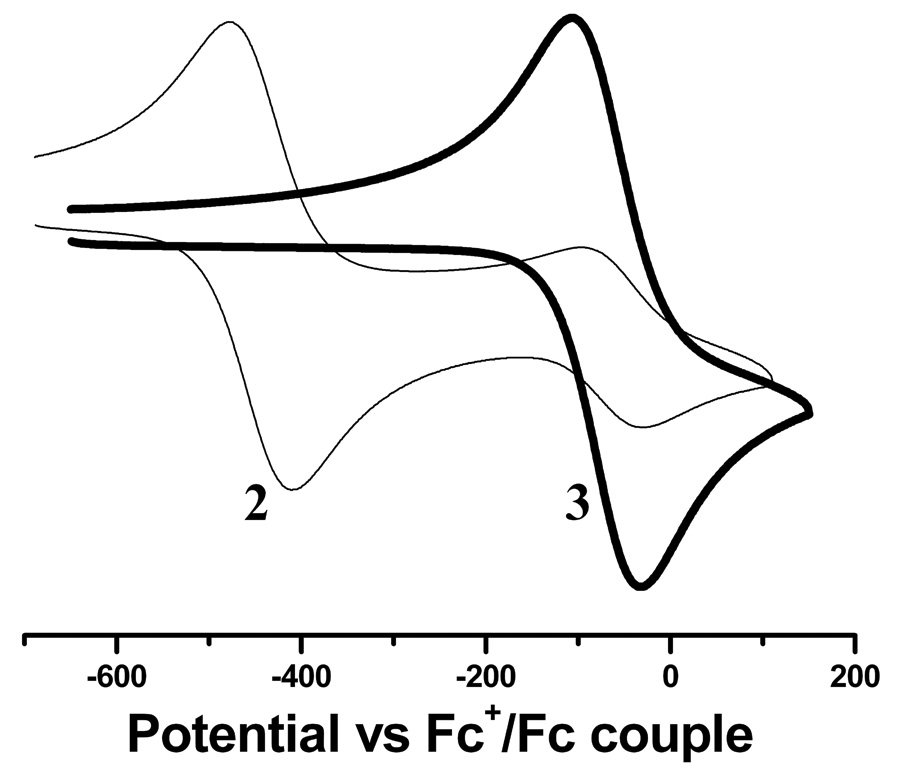
Room temperature cyclic voltammograms of acetonitrile solutions of 2 (thin line) and 3 (bold line). Conditions: reference electrode, Pt-wire, working electrode Pt-disk, auxiliary electrode, Pt-disk) and supporting electrode 0.2 M Bu4NClO4, scan rate 100 mV/s.
Figure 6.
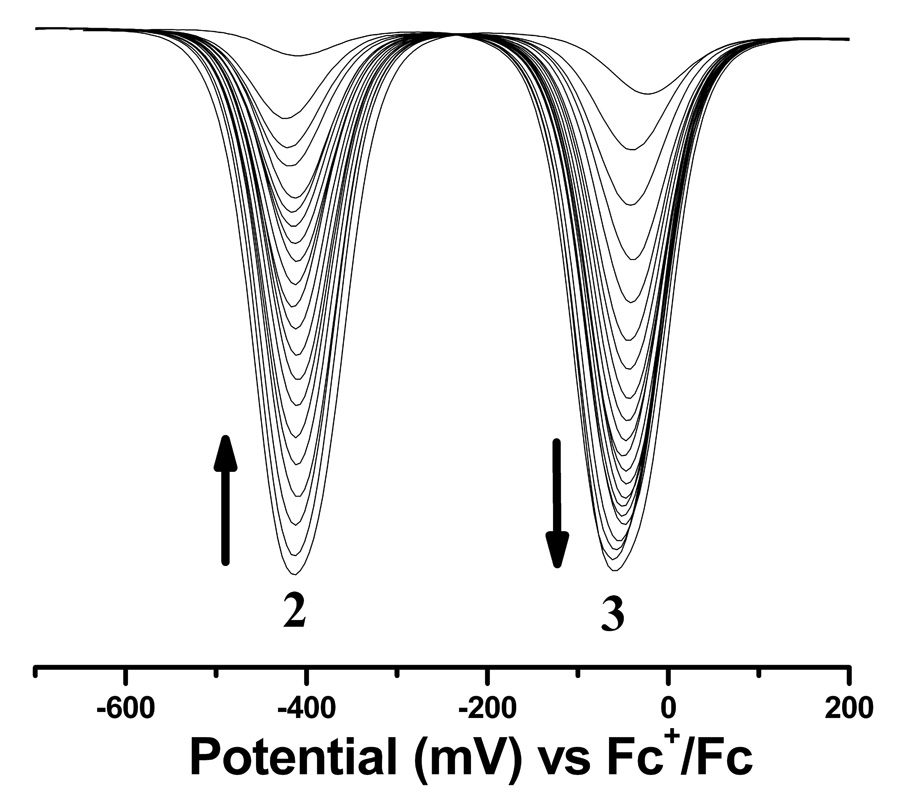
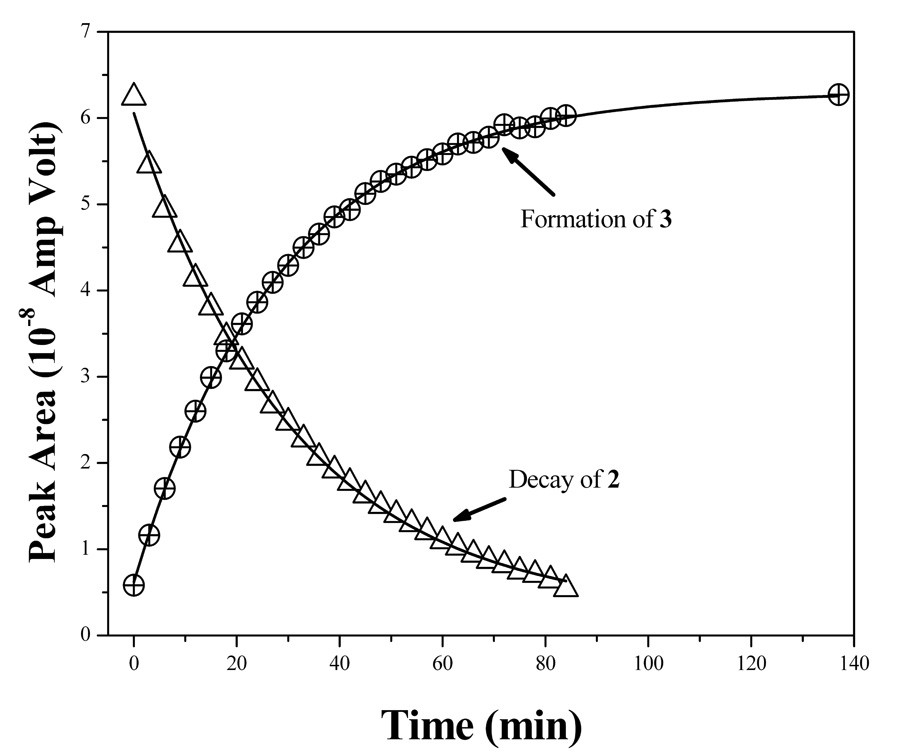
Left panel: Time dependent room temperature differential pulse voltammograms showing the conversion of 2 to 3. Conditions are the same as described in the cyclic voltammetric experiments with scan rate of 25 mV/s. The direction of the arrows indicates the direction of the change as a function of time. Right panel: triangles represent decay of 2 as a function of time and circles represent growth of 3. The solid line represents the exponential fit of the data (R2>99.9%), which results in time constants as ~30.94 (±0.63) min for the decay and ~28.53 (±0.29) min for the growth, respectively.
As mentioned, 2 exhibited a new redox wave due to its spontaneous conversion to 3. This conversion has been probed as a function of time by differential pulse voltammetry as shown in Figure 6. Because the redox peaks of the two compounds are separated by more than 375 mV, the area under the each peak could be integrated to provide quantitative information about the chemical transformation as a function of time. An individual fitting of each DPV response with two Gaussian functions yielded the area underneath individual peaks for 2 and 3 respectively (Figure S2, supporting information). The calculated areas follow, with time, exponential decay for 2 and growth for 3, respectively. Because the concentration of bulk solvent is practically invariable during transformation of 2 to 3, the experimental data have been modeled for first order processes with a single exponential function. This approach resulted in the rate of decay for 2 as 5.4 (±0.11) ×10−4 s−1 and the rate of growth of 3 as 5.8 (±0.06) ×10−4 s−1. These two values are very close indicating the internal consistency of the approach. Thus, electrochemical analysis not only provides a means to understand their redox potency but also the chemical transformation in solution.
Electronic Structure
Electronic structures of 1–3 have been probed using density functional theory, where crystallographically determined geometries were used for computation. The atomic orbital contributions to the selected molecular orbitals are summarized in Table S1 (supporting information). The highest occupied molecular orbital (HOMO) in dioxo-MoVI complex (1) is mainly ligand based in nature (Figure 7) and dominated by the contribution from the thiophenolato ligand. The lowest unoccupied molecular orbital (LUMO) is the redox active orbital (Figure 7) that has a significant contribution from the metal 4d orbitals. The contribution from the O1 and O2 ligands in the metal based LUMO differ by ca. 2–3%, which supports their inequivalence as seen in the crystal structures.
Figure 7.
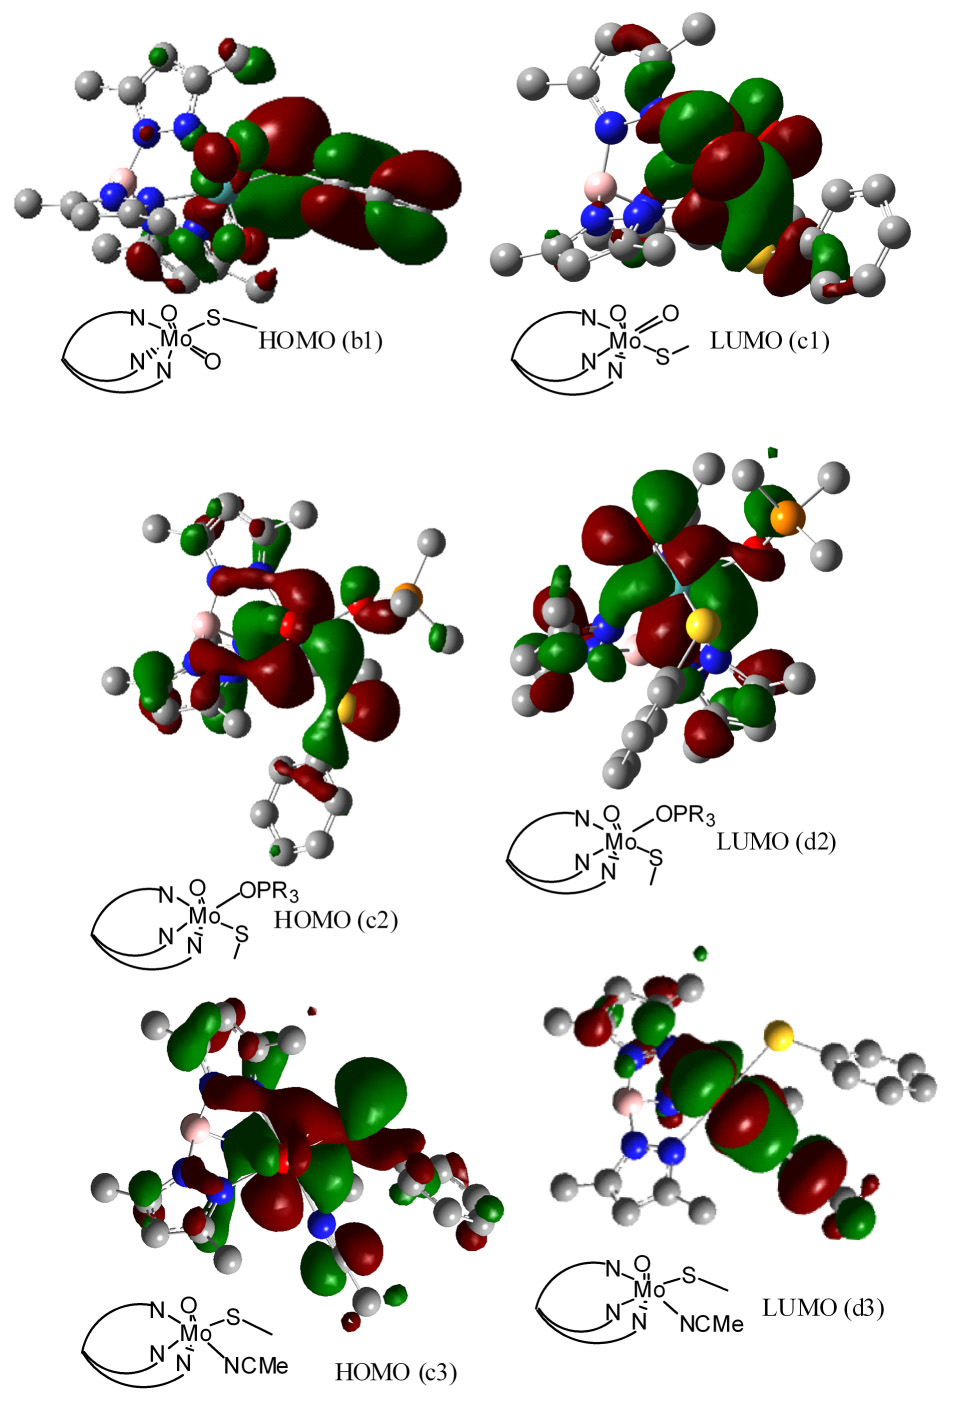
Pictorial representation of the HOMO and LUMO of 1, 2, and 3. Line diagrams schematically represent the orientation of the molecule.
In monooxo-MoIV complexes such as 2 and 3, as expected, the ligand field was dominated by the terminal oxo-ligand, therefore, z-axis is considered along the Mo=O bond. In each case, the HOMO orbital has major contributions from the metal dxy orbital. In 2, total contribution of the thiophenolato ligand to the HOMO is only 8.5%, and is similar to LUMO and LUMO+1 orbitals. However, the thiophenolato ligand contributes significantly, up to 79%, to the HOMO-1 and HOMO-2 orbitals. The calculated energy gap between HOMO (dxy) and LUMO (dxz) orbitals is ~ 3.16 eV and LUMO and LUMO+1 (dyz) is ~ 0.29 eV. Consistent with this description of the energy levels, the low energy band ~760 nm, is attributed to dxy → dxz or dyz transition.
The electronic structure description of 3 is similar to that of the intermediate complex, 2, except a few differences. The energy of HOMO (dxy orbital, Figure 7) is lowered by 0.47 eV than 2. The lower energy of the HOMO makes it easier to oxidize, which is consistent with its redox potential. Similarly, the LUMO is lowered by 0.58 eV, decreasing a HOMO-LUMO gap by about 0.10 eV. Contribution of MeCN ligand to HOMO is similar to that of OPMe3 in 2, however the LUMO has a significantly higher contribution from the MeCN ligand. The LUMO and LUMO+1 oribitals are separated by 0.467 eV, which is much higher than 0.29 eV separation for 2. As a consequence, two distinct bands are observed in the electronic spectrum of 3.
Summary
Reaction of a thiophenol coordinated dioxo-molybdenum(VI) complex with a small tertiary phosphine (PMe3) resulted in formation of a phosphoryl intermediate complex, Tp*MoO(SPh)(OPMe3) (2). In acetonitrile this complex exchanges its phosphoryl ligand with a solvent molecule resulting in Tp*MoO(SPh)(MeCN) (3). Both complexes have been isolated in solid state and their molecular structures have been defined by X-ray crystallography. The later represents a rare example of a solvent coordinated species upon complete oxygen atom transfer reaction. These structures are compared with that of the parent dioxo-molybdenum(VI) complex, Tp*MoO2(SPh) (1). The solid state structures of these molecules revealed distinct geometric reorganizations, however Mo=O vibration does not show any effect in changing the coordination from 2 to 3. In solution, 3, exchanges its coordinated solvent molecule with that of the bulk ones. The effect of this chemical exchange is observable in the NMR resonances of the protons of pyrazole ring, which act as sensitive reporters. The electronic spectra reveals strong low energy metal based transitions in both 2 and 3. The electronic structure calculations show that the small contribution of the thiophenol ligand into HOMO of 2 as well as 3. Both 2 and 3 are redox active, exhibiting well defined Mo(V/IV) redox couples that are 375 mV apart. This separation in the redox potential allowed us to investigate ligand exchange using differential pulse voltammetry. From the voltammetic measurements, the rate of exchange at room temperature was found to be 5.6 (±0.2) × 10−4 s−1. This approach provides a means to investigate atom transfer reactions. The detailed kinetic measurements as a function of substituents on the thiophenol ring will appear in a forthcoming paper.
Supplementary Material
SUPPORTING INFORMATION. Crystallographic data in CIF format, representative 1H NMR spectra, differential pulse voltammograms, and a table containing calculated orbital contribution, and atomic coordinates for calculation as well as the basis sets.
ACKNOWLEDGMENT
The authors are grateful to the National Institutes of Health (GM06155502) for financial support.
Footnotes
Publisher's Disclaimer: This is a PDF file of an unedited manuscript that has been accepted for publication. As a service to our customers we are providing this early version of the manuscript. The manuscript will undergo copyediting, typesetting, and review of the resulting proof before it is published in its final citable form. Please note that during the production process errors may be discovered which could affect the content, and all legal disclaimers that apply to the journal pertain.
References
- 1.Schrader N, Fischer K, Karsten K, Mendel RR, Schwarz G, Kisker C. Structure. 2003;11:1251–1263. doi: 10.1016/j.str.2003.09.001. [DOI] [PubMed] [Google Scholar]
- 2.Stolz JF, Basu P. ChemBioChem. 2002;3:198–206. doi: 10.1002/1439-7633(20020301)3:2/3<198::AID-CBIC198>3.0.CO;2-C. [DOI] [PubMed] [Google Scholar]
- 3.Karakas E, Wilson HL, Graf TN, Xiang S, Jaramillo-Busquets S, Rajagopalan KV, Kisker C. J. Biol. Chem. 2005;280:33506–33515. doi: 10.1074/jbc.M505035200. [DOI] [PubMed] [Google Scholar]
- 4.Fischer K, Barbier GG, Hecht H-J, Mendel RR, Campbell WH, Schwarz G. Plant Cell. 2005;17:1167–1179. doi: 10.1105/tpc.104.029694. [DOI] [PMC free article] [PubMed] [Google Scholar]
- 5.Enemark JH, Astashkin AV, Raitsimring AM. Dalton Trans. 2006:3501–3514. doi: 10.1039/b602919a. [DOI] [PubMed] [Google Scholar]; Burgmayer SJN. Dithiolenes in Biology. In: Stiefel EI, Karlin KD, editors. Dithiolene Chemistry Synthesis, Properties, and Applications. Vol. 52. 2004. pp. 491–537. [Google Scholar]
- 6.Enemark JH, Cooney JJA, Wang J-J, Holm RH. Chem. Rev. 2004;104:1175–1200. doi: 10.1021/cr020609d. [DOI] [PubMed] [Google Scholar]
- 7.Holm RH. Coord. Chem. Rev. 1990;100:183–221. [Google Scholar]
- 8.Pilato RS, Stiefel EI. In: Bioinorganic Catalysis. 2nd ed. Reedijk J, Bouwman E, editors. New York: Marcel Dekker; 1999. pp. 81–152. [Google Scholar]
- 9.McMaster J, Tunney JM, Garner CD. Prog. Inorg. Chem. 2003;52:539–583. [Google Scholar]
- 10.Young CG. In: Biomimetic Oxidations Catalyzed by Transition Metal Complexes. Meunier B, editor. London: Imperial College Press; 2000. pp. 415–459. [Google Scholar]
- 11.Donahue JP, Goldsmith CR, Nadiminti U, Holm RH. J. Am. Chem. Soc. 1998;120:12869–12881. [Google Scholar]; Lorber C, Plutino MR, Elding LI, Nordlander E. J. Chem. Soc., Dalton Trans. 1997:3997–4004. [Google Scholar]; Das SK, Chaudhury PK, Biswas D, Sarkar S. J. Am. Chem. Soc. 1994;116:9061–9070. [Google Scholar]; Wang J-J, Kryatova OP, Rybak-Akimova EV, Holm RH. Inorg. Chem. 2004;43:8092–8101. doi: 10.1021/ic040087f. [DOI] [PubMed] [Google Scholar]; Chaudhury PK, Nagarajan K, Dubey P, Sarkar S. J. Inorg. Biochem. 2004;98:1667–1677. doi: 10.1016/j.jinorgbio.2004.07.002. [DOI] [PubMed] [Google Scholar]
- 12.Jiang J, Holm RH. Inorg. Chem. 2005;44:1068–1072. doi: 10.1021/ic040109y. [DOI] [PubMed] [Google Scholar]
- 13.Heinze K, Fischer A. Eur. J. Inorg. Chem. 2007:1020–1026. [Google Scholar]
- 14.Wallace D, Gibson LT, Reglinski J, Spicer MD. Inorg. Chem. 2007;46:3804–3806. doi: 10.1021/ic700468m. [DOI] [PubMed] [Google Scholar]
- 15.Tran BL, Carrano CJ. Inorg. Chem. 2007;46:5429–5438. doi: 10.1021/ic7005259. [DOI] [PubMed] [Google Scholar]
- 16.Sugimoto H, Tarumizu M, Miyake H, Tsukube H. Eur. J. Inorg. Chem. 2006:4494–4497. [Google Scholar]; Sugimoto H, Tarumizu M, Tanaka K, Miyake H, Tsukube H. Dalton Trans. 2005:3558–3565. doi: 10.1039/b503828f. [DOI] [PubMed] [Google Scholar]
- 17.Ma X, Schulzke C, Schmidt H-G, Noltemeyer M. Dalton Trans. 2007:1773–1780. doi: 10.1039/b617652f. [DOI] [PubMed] [Google Scholar]
- 18.Smith PD, Millar AJ, Young CG, Ghosh A, Basu P. J. Am. Chem. Soc. 2000;122:9298–9299. [Google Scholar]
- 19.Nemykin VN, Laskin J, Basu P. J. Am. Chem. Soc. 2004;126:8604–8605. doi: 10.1021/ja049121f. [DOI] [PubMed] [Google Scholar]
- 20.Nemykin VN, Basu P. Dalton Trans. 2004:1928–1933. doi: 10.1039/b403964e. [DOI] [PubMed] [Google Scholar]
- 21.Nemykin VN, Basu P. Inorg. Chem. 2005;44:7494–7502. doi: 10.1021/ic0508324. [DOI] [PubMed] [Google Scholar]
- 22.Xiao Z, Bruck MA, Doyle C, Enemark JH, Grittini C, Gable RW, Wedd AG, Young CG. Inorg. Chem. 1995;34:5950–5962. doi: 10.1021/ic961983x. [DOI] [PubMed] [Google Scholar]
- 23.Roberts SA, Young CG, Kipke CA, Cleland WE, Jr, Yamanouchi K, Carducci MD, Enemark JH. Inorg. Chem. 1990;29:3650–3656. [Google Scholar]
- 24.Sengar RS. Ph.D. Dissertation. Duquesne University; 2004. [Google Scholar]
- 25.Malarek MS, Evans DJ, Smith PD, Bleeker AR, White JM, Young CG. Inorg Chem. 2006;45:2209–2216. doi: 10.1021/ic0510314. [DOI] [PubMed] [Google Scholar]
- 26.TeXsan 10.3b: Crystal Structure Analysis Package. Molecular Structure Coorporation; 1985 and 1992. [Google Scholar]
- 27.Betteridge PW, Carruthers JR, Cooper RI, Prout K, Watkin DJ. J. Appl. Cryst. 2003;36:1487. [Google Scholar]
- 28.Frisch MJ, Trucks GW, Schlegel HB, Scuseria GE, Robb MA, Cheeseman JR, Montgomery JA, Jr, Vreven T, Kudin KN, Burant JC, Millam JM, Iyengar SS, Tomasi J, Barone V, Mennucci B, Cossi M, Scalmani G, Rega N, Petersson GA, Nakatsuji H, Hada M, Ehara M, Toyota K, Fukuda R, Hasegawa J, Ishida M, Nakajima T, Honda Y, Kitao O, Nakai H, Klene M, Li X, Knox JE, Hratchian HP, Cross JB, Adamo C, Jaramillo J, Gomperts R, Stratmann RE, Yazyev O, Austin AJ, Cammi R, Pomelli C, Ochterski JW, Ayala PY, Morokuma K, Voth GA, Salvador P, Dannenberg JJ, Zakrzewski VG, Dapprich S, Daniels AD, Strain MC, Farkas O, Malick DK, Rabuck AD, Raghavachari K, Foresman JB, Ortiz JV, Cui Q, Baboul AG, Clifford S, Cioslowski J, Stefanov BB, Liu G, Liashenko A, Piskorz P, Komaromi I, Martin RL, Fox DJ, Keith T, Al-Laham MA, Peng CY, Nanayakkara A, Challacombe M, Gill PMW, Johnson B, Chen W, Wong MW, Gonzalez C, Pople JA. Gaussian 03, Revision B.01. Pittsburgh PA: Gaussian, Inc.; 2003. [Google Scholar]
- 29.Becke AD. J. Chem. Phys. 1993;98:5648–5652. [Google Scholar]
- 30.Lee C, Yang W, Parr RG. Phy. Rev. B: Condensed Matter and Materials Phys. 1988;37:785–789. doi: 10.1103/physrevb.37.785. [DOI] [PubMed] [Google Scholar]
- 31.(a) Ditchfield R, Hehre WJ, Pople JA. J. Chem. Phys. 1971;54:724–728. [Google Scholar]; (b) Hehre WJ, Ditchfield R, Pople JA. J. Chem. Phys. 1972;56:2257–2261. [Google Scholar]
- 32.Nemykin VN, Basu P. VMOdes: Virtual Molecular Orbital description program for Gaussian, GAMESS, and HyperChem, Revision B 6.2 [Google Scholar]
- 33.Miller AJ, Doonan CJ, Smith PD, Nemykin VN, Basu P, Young CG. Chem. Eur. J. 2005;11:3255–3267. doi: 10.1002/chem.200401101. [DOI] [PubMed] [Google Scholar]
- 34.Ahmad KI, Ozeki H, Saito S. J. Chem. Phys. 1999;110:912–917. [Google Scholar]
- 35.Greenwood NN, Earnshaw A. Chemistry of the Elements. Pergamon; Oxford: 1984. [Google Scholar]
- 36.Galindo A, Montilla F, Pastor A, Carmona E, Gutierrez-Puebla E, Monge A, Ruiz C. Inorg. Chem. 1997;36:2379–2385. doi: 10.1021/ic961190a. [DOI] [PubMed] [Google Scholar]
- 37.Kühn FE, Herdtweck E, Haider JJ, Herrmann WA, Gonćalves IS, Lopes AD, Romaõ CC. J. Organomet. Chem. 1999;583:3–10. [Google Scholar]; Arzoumanian H, Pierrot M, Ridouane F, Sanchez J. Trans. Met. Chem. 1991;16:422–426. [Google Scholar]
- 38.Cotton FA, Liu CY, Murillo CA. Inorg. Chem. 2004;43:2267–2276. doi: 10.1021/ic035433s. [DOI] [PubMed] [Google Scholar]
- 39.Doonan CJ, Millar AJ, Nielsen DJ, Young CG. Inorg. Chem. 2005;44:4506–4514. doi: 10.1021/ic050052v. [DOI] [PubMed] [Google Scholar]
Associated Data
This section collects any data citations, data availability statements, or supplementary materials included in this article.
Supplementary Materials
SUPPORTING INFORMATION. Crystallographic data in CIF format, representative 1H NMR spectra, differential pulse voltammograms, and a table containing calculated orbital contribution, and atomic coordinates for calculation as well as the basis sets.