

Abstract
In this work, we ask whether the simultaneous movement of agonist and antagonist among surface receptors (i.e. continually associating and dissociating from individual receptors according to specified kinetics) has any unexpected consequences for G-protein activation and receptor desensitization. A Monte Carlo model framework is used to track the diffusion and reaction of individual receptors, allowing the requirement for receptors and G-proteins or receptors and kinases to find each other by diffusion (collision coupling) to be implemented explicitly. We find that at constant agonist occupancy the effect of an antagonist on both G-protein activation and the ratio of G-protein activation to receptor desensitization can be modulated by varying the antagonist dissociation kinetics. The explanation for this effect is that antagonist dissociation kinetics influence the ability of agonists to access particular receptors and thus reach G-proteins and kinases near those receptors. Relevant parameter ranges for observation of these effects are identified. These results are useful for understanding experimental and therapeutic situations when both agonist and antagonist are present, and in addition may offer new insights into insurmountable antagonism.
Keywords: G-protein coupled receptor, desensitization, simulation, model
Introduction
Agonist binding to G-protein coupled receptors (GPCRs) allows receptors to activate G-proteins, initiating a signal transduction cascade and ultimately cellular responses that are important in processes including regulation of heart contractility, pain and the immune response (reviewed in (George et al., 2002)). Agonist-occupied GPCR are also targeted for phosphorylation, a key first step in the desensitization pathway. It is estimated that GPCRs represent 1% of the human genome (Breitwieser, 2004) and that 50% of modern therapeutics act by modulating GPCRs (George et al., 2002). One type of therapeutic is an antagonist, a molecule that binds to the target receptor but does not activate it. The antagonist functions by blocking agonist binding and reducing signaling.
The interaction between receptors and G-proteins has been described by the collision coupling model (Tolkovsky and Levitzki, 1978), reviewed in Lauffenburger and Linderman (1993), which allows for receptors and G-proteins to diffuse in the membrane and interact when they collide. The diffusion of receptors and G-proteins in the membrane is sufficiently slow as to limit the number of G-proteins that can be activated by a single receptor (Mahama and Linderman, 1995). Similarly, the phosphorylation of agonist-bound receptors is believed to first require the diffusion of receptors and membrane-bound kinases (Krupnick and Benovic, 1998).
Agonist or antagonist ligands continually associate and dissociate from individual receptors according to (ligand-specific) kinetics. This allows, even when binding has equilibrated, for the continual movement of ligands among surface receptors. In previous theoretical and experimental studies, when comparing cases of equal occupancy of receptors by agonist, increased movement of agonist (shorter half-life of the receptor-agonist complex) resulted in increased G-protein activation, as receptors newly occupied by agonist have access to G-proteins close by (Mahama and Linderman, 1994; Shea et al., 1997; Stickle and Barber, 1993). Such movement has also been predicted to partially decouple G-protein activation from receptor phosphorylation (Woolf and Linderman, 2003).
In this work, we ask whether antagonist dissociation kinetics can also play a role in modulating G-protein activation and receptor desensitization. In other words, we determine the consequences of the simultaneous movement of agonist and antagonist among surface receptors for G-protein activation and receptor desensitization. A Monte Carlo model framework is used to track the diffusion and reaction of individual receptors, allowing the requirement for receptors and G-proteins or receptors and kinases to find each other by diffusion (collision coupling) to be implemented explicitly. Simulations are used to scan a broad range of conditions and to identify regimes that may be of experimental interest.
Methods
Estimating the role of diffusion
The reactions producing GPCR activation and phosphorylation are shown schematically in Fig. 1. In order to accurately simulate these reactions, we first determine which bimolecular reactions are likely to be diffusion-limited. The reactions we evaluate are ligand binding, G-protein activation, Gβγ recruitment of receptor kinase, receptor phosphorylation, and G-protein recombination. We compare the overall observed reaction rate constant (kf) with the transport rate constant (k+). We estimate k+ in the appropriate dimensionality with equations given in Lauffenburger and Linderman (1993):
| (1) |
| (2) |
| (3) |
where D is the diffusion coefficient, b is half the mean separation distance between reactants, s is the encounter radius, a is the cell radius, SA is the total surface area and [G] is the average G-protein concentration. This estimation assumes that the reactants are evenly distributed on the surface. If the reactants are locally enriched or depleted in one area the actual value of k+ could vary by as much as 10-fold and can be more accurately determined by our simulations (Shea and Linderman, 1998).
Figure 1. Six reactions in G-protein activation and receptor phosphorylation.
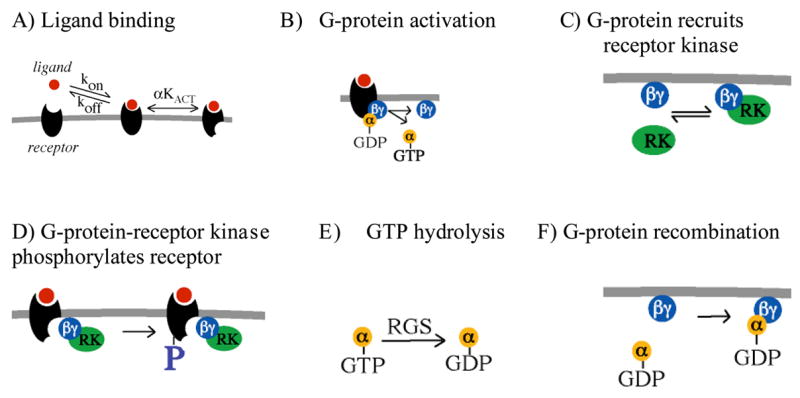
A) Signaling is initiated when ligand binds to receptor. The ligand-receptor complex establishes a rapid equilibrium between inactive and active states as determined by agonist efficiency α (effectiveness of an agonist in causing the receptor to adopt an active conformation) and the receptor activation equilibrium constant KACT (discussed in (Kinzer-Ursem et al., 2006; Woolf and Linderman, 2003)). B) Signaling occurs when an active ligand-receptor complex diffuses to and activates the G-protein heterotrimer, allowing the α subunit to release GDP, bind GTP, and dissociate from the βγ subunit. C) The free G-protein βγ subunit recruits receptor kinase (RK) to the membrane. D) The βγ-kinase complex can phosphorylate a receptor, targeting the receptor for desensitization. E) The α subunit is inactivated when GTP is hydrolyzed to GDP, a reaction that can be catalyzed by RGS proteins. F) The inactive α subunit recombines with the βγ subunit to reform a heterotrimeric G-protein.
For the two dimensional reactions in the cell membrane, G-protein activation and receptor phosphorylation, we used values of D = 10−11 - 10−9 cm2/sec (Lee et al., 1993; Sako and Kusumi), SA = 1000 μm2, and [G] = 10 – 100/μm2 (Pardo et al., 1997). For G-protein activation we then calculate range for k+ of 10−6 to 10−3 (#/cell)−1 sec−1. This range overlaps with observed values of kf (10−7 (#/cell)−1 sec−1 to 10−4 (#/cell)−1 sec−1 (Bornheimer et al., 2004; Simons et al., 2004; Yi et al., 2003)). This broad range of values for kf is likely due to the differences in the cell types used and the concentrations of the receptors and G-proteins in these experiments. For receptor phosphorylation a similar value of k+ is calculated because the diffusion coefficient and the mean separation between reactants is similar. Values of kf for GPCR phosphorylation have not been widely reported, but the rate constant for receptor phosphorylation estimated for T cell receptors is of the same range as for G-protein activation (Schade and Levine, 2002). Thus for these two reactions, diffusion likely limits the rate of reaction and the locations of the relevant molecules will be explicitly tracked in our simulations.
For the remaining three reactions, ligand binding, recruitment of receptor kinase and G-protein recombination, one of the reactants diffuses in three dimensions (Eqn. 2). For these cases k+ > kf and the overall reaction rate is limited by intrinsic reaction kinetics and not the diffusion of reactants (Lauffenburger and Linderman 1993). Thus the locations of individual ligand, Gα and (non membrane-bound) receptor kinase molecules are not necessary to track in simulations.
Simulation procedure
To accurately simulate the reactions in GPCR signaling and phosphorylation we track the spatial location of the receptors and G-proteins (to incorporate diffusion) and their discrete states (e.g. bound to agonist, phosphorylated) using a kinetic Monte Carlo model (Brinkerhoff and Linderman, 2005). A two-dimensional triangular lattice was used to represent the cell membrane. The lattice was 3000 by 3000 with a spacing of 2 nm. This simulates a total area of 36 μm2; periodic boundary conditions are used to approximate an entire cell. The lattice contains receptors and G-proteins with a diameter of 4 lattice spacings or 8 nm.
The simulation algorithm is similar to previous models (Woolf and Linderman, 2004). Briefly, a receptor or G-protein is chosen at random and attempts to move, react, bind, or dissociate as appropriate. This procedure is repeated until on average each protein has gotten one opportunity to act, which completes one time step (approximately 0.3 msec). For a diffusion event the molecule moves a single lattice space in a random direction, unless the move would cause two molecules to overlap, in which case the move is rejected.
An agonist-bound receptor will exist in one of many different rapidly interconverting conformations or energy states that dictate the possible interactions for the receptor (Kenakin, 2002). This is generally simplified to allow two possible states, active and inactive (e.g. Kinzer-Ursem et al., 2006). Each time the algorithm chooses an agonist-receptor complex it is randomly assigned to be either active or inactive, independent of its previous state or the status of other receptors. The percentage of agonist-bound receptors that are active on average is given by α KACT/(α KACT +1). We set KACT = 10−6 and α = 105 or 108, corresponding to 9% or 99% of agonist-bound receptors in the active conformation. Antagonist-bound receptors can only exist in the inactive state, and thus are incapable of activating G-proteins and of being phosphorylated. In other words, the value of α for an antagonist is 0. Antagonist dissociation from these receptors allows the receptors to be available for agonist or antagonist binding.
Agonist-bound active receptor can activate a G-protein if one is within the interaction radius of one lattice space, or 2 nm (i.e. receptor and G-protein must be neighbors to interact). Activation is recorded as the entry of a Gα–GTP subunit into the cytosol while the Gβγ subunit remains at the membrane. Gβγ subunits can bind to receptor kinases. Gβγ–kinases can diffuse to and phosphorylate active agonist-bound receptors. Phosphorylated receptors, when agonist-bound and active, can also activate G-proteins in the same way as unphosphorylated agoinst-bound active receptors (Jin et al., 2000). It is believed that steps subsequent to phosphorylation, i.e. arrestin binding, desensitize the receptor and prevent it from activating G-proteins, although we focus on shorter time-scale events and thus do not include these in our simulations. GTP is hydrolyzed with rate constant kGTP to give Gα–GDP; recombination of Gα–GDP and Gβγ reforms the inactive G protein.
Model output is the number of active G proteins (Gα–GTP) at steady state or the initial rates of G-protein activation and receptor phosphorylation as calculated by a least squares fit of the simulation output over the first 30 seconds. In addition, the ratio of the rate of G-protein activation to the rate of receptor phosphorylation (GARP) is calculated (Woolf and Linderman, 2003). The ratio is interesting as an indicator of the relative initial amounts of each process, and is similar to the relative agonist signaling vs. endocytosis measurements of Whistler et al. (1999) except that our measure follows events at earlier times.
Parameter values and probabilities
For discrete time models, reactions can be modeled as Poisson processes and the probabilities of reaction can be derived from the bulk reaction rates using a Poisson distribution. With sufficiently small time steps (Δt), the probabilities of reaction are nearly proportional to the intrinsic reaction rate constants, according to (Rowley, 1994)
| (4) |
The probability of a diffusion event, Pmove, was calculated using the translational diffusion coefficient D of proteins in a lipid bilayer. For a single particle exhibiting Brownian diffusion on a triangular lattice, the probability of a particle moving at least one lattice spacing, l, in one iteration time step, Δt, can be approximated with
| (5) |
Parameter values used in the simulations are listed in Table 1
Table 1.
Parameter values for G-protein activation and receptor phosphorylation
| Rate Constant | Definition | Value | References |
|---|---|---|---|
| kon-ag (M−1s−1) | agonist association rate constant | 108a | a |
| koff-ag (s−1) | agonist dissociation rate constant | 1 Ğ 2500 b,c | c |
| kon-antag (M−1s−1) | antagonist association rate constant | 108a | a |
| koff-antag (s−1) | antagonist dissociation rate constant | 0.0001 Ğ 1000 b,c | c |
| khyd (s−1) | GTP hydrolysis rate constant | 1 d | d |
| α | Agonist efficiency | 105, 108 d | d |
| kon-RK (M−1s−1) | receptor kinase association rate constant | 1000 e | e |
| koff-RK (s−1) | receptor kinase dissociation rate constant | 1 d | d |
| kG-recombine (s−1) | G-protein recombination rate constant | 1000 f | f |
| D (cm2/s) | Diffusion coefficient | 10−11 Ğ 10 −9 g | g |
| Concentrations | |||
| [L] (M) | ligand concentration | Varied | |
| [R] (#/cell) | Receptor concentration | 2×10³–2×10⁴ h | h |
| [G] (#/cell) | G-protein concentration | 104 h | h |
Varying the value of kon-ag and kon-antag between 106 and 1010 M−1s−1 has no noticeable effect on the results. The association rate constant in part determines the time course of receptor-ligand binding reaching equilibrium and under these conditions receptor-ligand equilibrium is reached sufficiently fast to have no noticeable effect on G-protein activation or receptor phosphorylation.
the physiologic range of koff-ag and koff-antag is 0.0001 to 100 s−1. We use some values of koff-ag and koff-antag larger than 100/sec, but expect that these values would not occur in experimental systems.
To compare equivalent conditions while varying the antagonist dissociation rate constant, we simultaneously vary the concentrations of agonist and antagonist to maintain a constant occupancy of the receptors by antagonist for any given agonist occupancy. For example, if the antagonist dissociation rate constant koff-antag is increased by 10 fold the concentration of antagonist is also increased by 10 fold as indicated by the familiar Gaddum equation (Colquhoun 2006):
| (6) |
where KD-antag = koff-antag/kon-antag and KD-ag = koff-ag/kon-ag.}
Results
With our model of agonist and antagonist binding to receptors we explore a range of parameters to determine their impact on G-protein activation and receptor phosphorylation.
Antagonist dissociation rate constant can modulate G-protein activation
Steady state G-protein activation was simulated for constant agonist binding and dissociation kinetics (kon-ag, koff-ag), antagonist association kinetics (kon-antag) and agonist concentration. When we varied the antagonist dissociation rate constant (koff-antag) we made an equivalent adjustment in antagonist concentration so that at a given agonist concentration the antagonist occupancy was constant (Eqn. 6). We plot our results for G protein activation at steady state against the level of agonist occupancy in order to compare cases with equal numbers of receptors bound by agonist. Previous models have shown that at constant occupancy of receptors by agonist (with no antagonist present) the agonist dissociation rate constant koff-ag can modulate the number of active G-proteins (Shea et al., 1997); we use similar conditions in this model of competition between agonist and antagonist.
When comparing cases of equal agonist occupancy, simulations show that the presence of the antagonist reduces G-protein activation and, in addition, that the antagonist dissociation kinetics can modulate the amount of this reduction (Fig 2a). For example, at 10% agonist occupancy and an antagonist with koff-antag = 100/sec, the agonist is able to activate ~3 times as many G-proteins as compared to an antagonist with koff-antag = 0.1/sec. The highest levels of activation, comparable to those achieved in the absence of antagonist, are found when antagonist dissociates quickly. In this case, the occupancy of any individual receptor by antagonist is fleeting, freeing the receptor to be next occupied by agonist and then able to activate nearby G-proteins. At a given agonist occupancy, the amount of G-protein activation decreases with decreasing antagonist dissociation kinetics.
Figure 2. Varying the antagonist dissociation rate constant koff-antag can modulate the amount of G-protein activation.

(a) Activation as a function of agonist occupancy. Values of koff-antag are listed. The extent of G protein activation is dependent on the value of koff-antag when koff-antag is less than 0.001/sec. Parameters: kon-ag =108/M-sec, koff-ag =100/sec, kon-antag =108/M-sec, koff-antag =0.0001–100/sec. [Antag]/KD-antag = 3, D = 10–11 cm2/sec, [R] = 2×10³/cell, [G] = 104/cell and α = 108. (b) Simulation results from (a) replotted to show activation as a function of agonist concentration.
Interestingly, when antagonist dissociation is very slow (koff-antag less than about 0.001/sec), the tightly binding antagonist effectively removes some G-proteins from the total by not allowing access of agonist to the receptors near these G-proteins. Thus the maximum extent of activation is reduced as compared to less tightly binding antagonists.
The steady state results of Fig. 2a are replotted in the more traditional format of a dose-response curve in Fig. 2b. We note that our Hill coefficients are larger than typically observed. There are two possible explanations for this. First, our simulations here do not incorporate cell-to-cell variation in parameter values. We have previously shown that such variation, particularly when threshold-like behavior is present in later steps in the activation pathway, leads to a flattening (smaller Hill coefficient) of the dose-response curve (Mahama and Linderman, 1994). In addition, large Hill coefficients in our simulations may also be due to particular assumptions about molecular movement and reaction (e.g., movement is constrained to a lattice and the entire circumference of a molecule is considered to be equally reactive). However, the qualitative trends observed here with regard to the role of antagonist dissociation kinetics are expected to hold over a range of assumptions about how to code molecular movement and collision events (data not shown).
We next tested a range of parameter values (Fig. 3a,b) to determine when the extent of G-protein activation is most influenced by antagonist dissociation kinetics, as determined by comparing activation by agonist in the presence of an antagonist that moves quickly among the receptors (koff-antag = 100/sec) with an antagonist with a longer half-life (koff-antag = 0.1/sec). Simulations with changed parameter values are compared to the base case shown in Fig. 2 and reproduced in Fig. 3 as the black curves.
Figure 3. Steady state G-protein activation as a function of agonist occupancy also depends on the receptor number (R), diffusivity (D), agonist dissociation rate constant (koff-ag) and agonist efficiency (α).

(a) By comparing cases when the antagonist dissociation rate constant koff-antag is large (100/sec; solid lines) with koff-antag small (0.1/sec; dotted lines) we show the effect of antagonist dissociation kinetics (koff-antag) on activation are less significant when receptor number (R) is large (red curve), diffusivity (D) is large (orange curve), koff-ag is small (green curve) or agonist efficiency (α) is small (purple curve). Parameters for the base case are as in Fig. 2. The comparison cases have their respective parameters changed to [R] = 2×10⁴/cell, D = 10−10 cm2/sec, koff-ag = 0.1/sec or α =105. (b) Simulation results from (a) replotted to show activation as a function of agonist 24oncentration.
We begin with two agonist parameters, the agonist dissociation rate constant koff-ag and the agonist efficiency (α). When koff-ag is reduced (to 0.1/sec; Fig. 3, green curves) agonist movement among receptors is reduced, a smaller number of G-proteins are activated per agonist-bound receptor, and the modulation of activation by antagonist dissociation kinetics is reduced. In other words, because agonist movement among receptors plays a smaller role in activation, interference of that movement by a slowly dissociating antagonist has little effect. When α is reduced (to 105; Fig. 3, purple curves) receptors will be in an active conformation only a small fraction of the time that they are bound by agonist. As compared to a higher value of α, a smaller number of G-proteins are activated per agonist-bound receptor and the modulation of activation by antagonist dissociation kinetics is reduced. A low efficiency agonist binds many receptors and only activates some of them. The specific receptors that are bound by agonist and in an active conformation changes rapidly and this changing of receptors between active and inactive conformations takes the place of the direct movement of agonist among receptors. Thus the effect of antagonist dissociation kinetics (koff-antag) on G-protein activation is most likely to be observed with an agonist that has a high dissociation rate constant (koff-ag) and a high efficiency (α).
We next examined the role of diffusivity and receptor number. In general, the movement of agonist among receptors contributes significantly to G-protein activation when receptors are fairly isolated and each receptor essentially has its own “pool” of G-proteins to activate; it is under this circumstance that changes in antagonist dissociation kinetics should significantly modulate activation. As expected, when diffusion in the membrane is faster (D = 10−10 cm2/sec vs. 10−11 cm2/sec) each active agonist-receptor complex has access to a large section of the membrane and activates many more G-proteins. However, receptors are now less isolated and can activate G-proteins near other receptors, reducing the effect of antagonist dissociation kinetics (Fig 3, orange curves). Similarly, increasing the receptor concentration results in higher G-protein activation but, because receptors can more easily reach G-proteins near another receptor, less of an effect of antagonist dissociation kinetics (Fig. 3, red curves). Thus the effect of antagonist dissociation kinetics (koff-antag) on G-protein activation is most likely to be observed when diffusion is slow and receptor number is low.
Antagonist dissociation rate constant can modulate the relative rates of G-protein activation and receptor phosphorylation
We now investigate signaling and desensitization at an early physiological time point. We calculate the initial rates of G-protein activation and receptor phosphorylation as well as their ratio, GARP (G-protein activation/receptor phosphorylation), a measure we previously introduced and explored as it relates to agonist dissociation kinetics (Woolf and Linderman, 2003). A change in GARP indicates that activation and phosphorylation can be partially decoupled. For the parameter values of Fig. 2, antagonist dissociation kinetics have little effect on these rates or their ratio (Fig. 4a,b). However, conditions exist for which GARP is significantly influenced by antagonist dissociation kinetics (Fig. 4c,d). This new set of parameters has two key differences from previous conditions. First, the agonist dissociation rate constant koff-ag is increased to 1000/sec to allow improved access of antagonist to receptors previously occupied by agonist. Second, the antagonist occupancy is high (85%) and agonist occupancy is low (2.5%) to increase the chances that a receptor previously occupied by an agonist will next be occupied by an antagonist. In this new parameter regime, antagonist dissociation kinetics have no noticeable effect on G-protein activation over the range koff-antag = 1–300/sec (Fig. 4c); agonist-bound receptors have sufficient access to G proteins throughout the range. Receptor phosphorylation, however, is a minimum at an intermediate value of koff-antag ~ 100/sec. The explanation of this effect involves the timing of several events (and thus depends on several rates) and is as follows. A receptor occupied by agonist will activate a nearby G protein that in turn will recruit a receptor kinase. If agonist dissociates from the receptor and then antagonist binds before the receptor kinase phosphorylates the receptor, then the antagonist-bound receptor cannot be phosphorylated; phosphorylation is reduced. This effect is most pronounced at koff-antag ~ 100/sec. This reduction in receptor phosphorylation produces a maximum in the GARP ratio (Fig. 4d), demonstrating a partial uncoupling of activation and desensitization as the antagonist dissociation rate constant increases from ~1 to ~ 100.
Figure 4. Varying the antagonist dissociation rate constant koff-antag can modulate the initial rates of G-protein activation and receptor phosphorylation and their ratio.

a) The initial rates of G-protein activation and receptor phosphorylation are plotted as a function of the antagonist dissociation rate constant koff-antag. Parameter values are as in Fig. 2 and 20% of receptors are occupied by agonist. b) The ratio of the initial rate of G-protein activation to the initial rate of receptor phosphorylation (GARP) is plotted from the simulation results of (a); there is no statistically significant variation in GARP with antagonist dissociation kinetics. c,d) A different parameter set than in a) gives a more pronounced effect of antagonist dissociation kinetics Parameters: kon-ag =108/Msec, koff-ag =1000/sec, [Ag] =2 μM, [Ag]/KD-ag = 0.2, kon-antag =108, koff-antag =1–1000/sec, . [Antag]/KD-antag = 7, D = 10−11 cm2/sec, [R] = 2×10³/cell, [G] = 104/cell and α = 108.
We further explore the sensitivity of the GARP ratio to the antagonist dissociation rate constant for a range of conditions. In Fig. 5 we demonstrate the effects of four parameters that modulate the GARP ratio over the range of koff-antag = 1–1000/sec and compare them to the result in Fig. 4d (reproduced as the top curve in Figs. 5a and b). When koff-ag is reduced, agonist moves less quickly from one receptor to another, reducing the access of antagonist to receptors once bound by agonist and thus limiting the effect that antagonist dissociation kinetics can have on phosphorylation (Fig. 5a). Similarly, when the agonist efficiency α is reduced, receptors are in an active conformation only a small fraction of the time that they are bound by agonist and this toggling between active and inactive conformations plays a greater role than movement of agonist and antagonist among receptors in determining the GARP ratio (Fig. 5a). Thus the effect of koff-antag on the GARP ratio is most likely to be observed with an agonist that has a high koff-ag and efficacy.
Figure 5. GARP ratio also depends on the parameters α, koff-ag, D, and receptor number.

a) Larger values of the agonist efficiency α and the agonist dissociation rate constant koff-ag are needed to see an effect of antagonist dissociation kinetics on the GARP ratio. For reference, the filled circles (α =108, koff-ag =1000/sec) are the same simulations as in Fig. 4d. b) Smaller values of the diffusivity D and receptor number R are needed to see an effect of antagonist dissociation kinetics on the GARP ratio. For reference, the filled circles (D =10−11, 2×10³ R/cell) are the same as in Fig. 4d. Other parameters: kon-ag =108/Msec, koff-ag =1000/sec, [Ag] =2 μM, [Ag]/KD-ag = 0.2, kon-antag =108, koff-antag =1–1000/sec, [Antag]/KD-antag = 7, D = 10−11 cm2/sec, [R] = 2×10³/cell, [G] = 104/cell and α = 108.
Receptor, G-protein and receptor kinase diffusion in the membrane also play a role in determining the GARP ratio, much as seen in Fig. 3 for activation alone. When diffusion is slow each molecule is effectively more isolated and koff-antag has a larger effect on the GARP ratio than when diffusion is fast (Fig. 5b). Similarly, decreasing the receptor concentration increases the distance between receptors and increases the effect of koff-antag on the GARP ratio. In other words, the effect of koff-antag on the GARP ratio is most likely to be observed when diffusivity and receptor number are small.
Discussion
In this work, we examine the effect of competition between agonist and antagonist, and in particular antagonist dissociation kinetics, on G-protein activation and receptor phosphorylation over a range of parameters. We find two effects of antagonist. The first and of course well-known effect is that antagonist reduces agonist occupancy by blocking agonist binding. Normalizing the results for agonist occupancy removes this effect from the analysis. The second, unexpected effect is that the antagonist dissociation rate constant koff-antag can modulate the amounts of G-protein activation and receptor phosphorylation by blocking access of the agonist to particular receptors. As shown in Fig. 2a, for the same agonist and antagonist occupancy levels, antagonists that dissociate quickly allow more G-protein activation than antagonists that dissociate more slowly. The effect of antagonist dissociation kinetics on the ratio of the initial rates of G-protein activation to receptor phosphorylation is more nuanced: both increases and decreases in the ratio are seen as koff-antag is increased (Figs. 4,5).
Our simulations further explore the range of conditions that would be necessary to observe an effect of koff-antag in GPCR systems. For example, the antagonist dissociation rate constant must be small, as an antagonist with a larger dissociation rate constant (e.g. koff-antag = 100/sec) could allow the agonist to activate the same number of G-proteins at constant agonist occupancy as if the antagonist was not present at all (Fig 2). In addition, the agonist must have a fast dissociation rate constant and be a highly efficient agonist (Figs. 3 & 5). The diffusion of receptors and G-proteins in the membrane must be slow and the numbers of receptors and G-proteins must be relatively small (Figs. 3 & 5).
Because we found that the modulation of G-protein activation and receptor phosphorylation by koff-antag is significant only within specific parameter ranges (Figs 3 & 5), there may be limited physiological systems in which our predictions can be thoroughly tested. The values of koff-ag necessary are near the highest observed. Similarly, the value of the diffusivity necessary is at the lower end of the normal range, although some cell systems may have even slower diffusion of receptors and G-proteins because of lipid rafts or the actin cytoskeleton constraining the diffusion of membrane proteins (Labrador et al. 2003; Ritchie et al., 2005) and this would enhance the likelihood of observing an effect of koff-antag. For most GPCRs it is likely an agonist with high efficiency (α) exists. In addition, the necessary receptor and G-protein numbers both are at the low end of the range of known concentrations. This means that activation in cells with overexpressed or upregulated receptors will likely be insensitive to varying koff-antag.
Most interestingly, our simulations offer new hypotheses regarding the role of antagonist kinetics in influencing G protein activation and receptor phosphorylation. Recall that a slowly dissociating antagonist not only blocks receptors from being bound by agonist but also in effect (because diffusion is slow) blocks access to the G-proteins near those antagonist-bound receptors. The effect can limit the maximal amount of G-protein activation that an agonist can elicit (Fig. 2), suggesting a new mechanism to explain the phenomenon termed insurmountable antagonism. This mechanism could be experimentally tested and compared with other proposed mechanisms; for example, a two-state receptor model and a slowly binding antagonist model, both formulated as ordinary differential equation models, have been described (Lew and Ziogas 2004; Lew et al. 2001). As a second example, a correlation between antipsychotic side effects and antagonist dissociation kinetics has been observed and could be in part related to the role of antagonist kinetics in activation and desensitization demonstrated here (Kapur and Seeman, 2000, 2001).
Acknowledgments
We thank John Traynor for many helpful discussions and the anonymous reviewers for their insights. This work was supported by Merck Research Laboratories and NIH R01 GM 062930.
Footnotes
Publisher's Disclaimer: This is a PDF file of an unedited manuscript that has been accepted for publication. As a service to our customers we are providing this early version of the manuscript. The manuscript will undergo copyediting, typesetting, and review of the resulting proof before it is published in its final citable form. Please note that during the production process errors may be discovered which could affect the content, and all legal disclaimers that apply to the journal pertain.
Contributor Information
Christopher J. Brinkerhoff, Email: brinkerh@umich.edu.
Ji Sun Choi, Email: jisunc@umich.edu.
Jennifer J. Linderman, Email: linderma@umich.edu.
References
- Bornheimer SJ, Maurya MR, Farquhar MG, Subramaniam S. Computational modeling reveals how interplay between components of a GTPase-cycle module regulates signal transduction. Proc Natl Acad Sci U S A. 2004;101(45):15899–904. doi: 10.1073/pnas.0407009101. [DOI] [PMC free article] [PubMed] [Google Scholar]
- Breitwieser GE. G protein-coupled receptor oligomerization: implications for G protein activation and cell signaling. Circ Res. 2004;94(1):17–27. doi: 10.1161/01.RES.0000110420.68526.19. [DOI] [PubMed] [Google Scholar]
- Brinkerhoff CJ, Linderman JJ. Integrin dimerization and ligand organization: key components in integrin clustering for cell adhesion. Tissue Eng. 2005;11(5–6):865–76. doi: 10.1089/ten.2005.11.865. [DOI] [PubMed] [Google Scholar]
- Colquhoun D. The quantitative analysis of drug-receptor interactions: A short history. Trends Pharmacol Sci. 2006;27:149–158. doi: 10.1016/j.tips.2006.01.008. [DOI] [PubMed] [Google Scholar]
- Contreras ML, Wolfe BB, Molinoff PB. Kinetic analysis of the interactions of agonists and antagonists with beta adrenergic receptors. J Pharmacol Exp Ther. 1986;239(1):136–43. [PubMed] [Google Scholar]
- George SR, O'Dowd BF, Lee SP. G-protein-coupled receptor oligomerization and its potential for drug discovery. Nat Rev Drug Discov. 2002;1(10):808–20. doi: 10.1038/nrd913. [DOI] [PubMed] [Google Scholar]
- Jin T, Zhang N, Long Y, Parent CA, Devreotes PN. Localization of the G protein betagamma complex in living cells during chemotaxis. Science. 2000;287(5455):1034–6. doi: 10.1126/science.287.5455.1034. [DOI] [PubMed] [Google Scholar]
- Kapur S, Seeman P. Antipsychotic agents differ in how fast they come off the dopamine D2 receptors. Implications for atypical antipsychotic action. J Psychiatry Neurosci. 2000;25(2):161–6. [PMC free article] [PubMed] [Google Scholar]
- Kapur S, Seeman P. Does fast dissociation from the dopamine D2 receptor explain the action of atypical antipsychotics? A new hypothesis. Am J Psychiatry. 2001;158(3):360–9. doi: 10.1176/appi.ajp.158.3.360. [DOI] [PubMed] [Google Scholar]
- Kenakin T. Drug efficacy at G protein-coupled receptors. Annu Rev Pharmacol Toxicol. 2002;42:349–79. doi: 10.1146/annurev.pharmtox.42.091401.113012. [DOI] [PubMed] [Google Scholar]
- Kinzer-Ursem TL, Sutton KL, Waller A, Omann GM, Linderman JJ. Multiple receptor states are required to describe both kinetic binding and activation of neutrophils via N-formyl peptide receptor ligands. Cell Signal. 2006;18(10):1732–47. doi: 10.1016/j.cellsig.2006.01.014. [DOI] [PubMed] [Google Scholar]
- Krupnick JG, Benovic JL. The role of receptor kinases and arrestins in G-protein-coupled receptor regulation. Ann Rev Pharmocol Toxicol. 1998;38:289–319. doi: 10.1146/annurev.pharmtox.38.1.289. [DOI] [PubMed] [Google Scholar]
- Labrador V, Riha P, Muller S, Dumas D, Wang X, Stoltz JF. The strength of integrin binding between neutrophils and endothelial cells. Eur Biophys J. 2003;32(8):684–688. doi: 10.1007/s00249-003-0329-4. [DOI] [PubMed] [Google Scholar]
- Lauffenburger D, Linderman JJ. Receptors: Models for Binding, Trafficking, and Signaling. New York: Oxford University Press; 1993. [Google Scholar]
- Lee GM, Zhang F, Ishihara A, McNeil CL, Jacobson KA. Unconfined lateral diffusion and an estimate of pericellular matrix viscosity revealed by measuring the mobility of gold-tagged lipids. J Cell Biol. 1993;120(1):25–35. doi: 10.1083/jcb.120.1.25. [DOI] [PMC free article] [PubMed] [Google Scholar]
- Lew M, Christopoulos A, Ziogas J. Insurmountable AT1 receptor antagonism: Message in a bottle? Trends Pharmacol Sci. 2001;22:555–557. doi: 10.1016/s0165-6147(00)01826-5. [DOI] [PubMed] [Google Scholar]
- Lew M, Ziogas J. The two-state model of antagonist-AT1 receptor interaction: An hypothesis defended but not tested. Biochem Pharmacol. 2004;67:397–399. doi: 10.1016/j.bcp.2003.11.007. [DOI] [PubMed] [Google Scholar]
- Mahama PA, Linderman JJ. Calcium signaling in individual BC3H1 muscle cells: Speed of calcium mobilization and heterogeneity. Biotechnology Prog. 1994;10:45–54. [Google Scholar]
- Mahama PA, Linderman JJ. Monte Carlo simulations of membrane signal transduction events: effect of receptor blockers on G-protein activation. Ann Biomed Eng. 1995;23(3):299–307. doi: 10.1007/BF02584430. [DOI] [PubMed] [Google Scholar]
- Neubig RR, Gantzos RD, Thomsen WJ. Mechanism of agonist and antagonist binding to alpha 2 adrenergic receptors: evidence for a precoupled receptor-guanine nucleotide protein complex. Biochemistry. 1988;27(7):2374–84. doi: 10.1021/bi00407a019. [DOI] [PubMed] [Google Scholar]
- Pardo L, Campillo M, Giraldo J. The effect of the molecular mechanism of G protein-coupled receptor activation on the process of signal transduction. Eur J Pharmacol. 1997;335(1):73–87. doi: 10.1016/s0014-2999(97)01170-9. [DOI] [PubMed] [Google Scholar]
- Ritchie K, Shan XY, Kondo J, Iwasawa K, Fujiwara T, Kusumi A. Detection of non-Brownian diffusion in the cell membrane in single molecule tracking. Biophys J. 2005;88(3):2266–77. doi: 10.1529/biophysj.104.054106. [DOI] [PMC free article] [PubMed] [Google Scholar]
- Rowley RL. Statistical Mechanics for Thermophysical Property Calculations. New Jersey: Prentice Hall; 1994. [Google Scholar]
- Sako Y, Kusumi A. Compartmentalized structure of the plasma membrane for receptor movements as revealed by a nanometer-level motion analysis. J Cell Biol. 1994;125(6):1251–64. doi: 10.1083/jcb.125.6.1251. [DOI] [PMC free article] [PubMed] [Google Scholar]
- Schade AE, Levine AD. Lipid raft heterogeneity in human peripheral blood T lymphoblasts: a mechanism for regulating the initiation of TCR signal transduction. J Immunol. 2002;168(5):2233–9. doi: 10.4049/jimmunol.168.5.2233. [DOI] [PubMed] [Google Scholar]
- Shea LD, Linderman JJ. Compartmentalization of receptors and enzymes affects activation for a collision coupling mechanism. Journal of Theoretical Biology. 1998;191(3):249–258. [Google Scholar]
- Shea LD, Omann GM, Linderman JJ. Calculation of diffusion-limited kinetics for the reactions in collision coupling and receptor cross-linking. Biophys J. 1997;73(6):2949–59. doi: 10.1016/S0006-3495(97)78323-1. [DOI] [PMC free article] [PubMed] [Google Scholar]
- Simons PC, Biggs SM, Waller A, Foutz T, Cimino DF, Guo Q, Neubig RR, Tang WJ, Prossnitz ER, Sklar LA. Real-time analysis of ternary complex on particles: direct evidence for partial agonism at the agonist-receptor-G protein complex assembly step of signal transduction. J Biol Chem. 2004;279(14):13514–21. doi: 10.1074/jbc.M310306200. [DOI] [PubMed] [Google Scholar]
- Stickle D, Barber R. Analysis of receptor-mediated activation of GTP-binding protein/adenylate cyclase using the encounter coupling model. Mol Pharmacol. 1993;43(3):397–411. [PubMed] [Google Scholar]
- Tolkovsky AM, Levitzki A. Mode of coupling between the beta-adrenergic receptor and adenylate cyclase in turkey erythrocytes. Biochemistry. 1978;17(18):3795. doi: 10.1021/bi00611a020. [DOI] [PubMed] [Google Scholar]
- Waelbroeck M, Tastenoy M, Camus J, Christophe J. Binding kinetics of quinuclidinyl benzilate and methyl-quinuclidinyl benzilate enantiomers at neuronal (M1), cardiac (M2), and pancreatic (M3) muscarinic receptors. Mol Pharmacol. 1991;40(3):413–20. [PubMed] [Google Scholar]
- Whistler JL, Chuang HH, Chu P, Jan LY, von Zastrow M. Functional dissociation of μ-opioid receptor signaling and endocytosis: Implications for the biology of opiate tolerance and addiction. Neuron. 1999;23:737–746. doi: 10.1016/s0896-6273(01)80032-5. [DOI] [PubMed] [Google Scholar]
- Woolf PJ, Linderman JJ. Untangling ligand induced activation and desensitization of G-protein-coupled receptors. Biophys J. 2003;84(1):3–13. doi: 10.1016/S0006-3495(03)74828-0. [DOI] [PMC free article] [PubMed] [Google Scholar]
- Woolf PJ, Linderman JJ. An algebra of dimerization and its implications for G-protein coupled receptor signaling. J Theor Biol. 2004;229(2):157–68. doi: 10.1016/j.jtbi.2004.03.012. [DOI] [PubMed] [Google Scholar]
- Yi TM, Kitano H, Simon MI. A quantitative characterization of the yeast heterotrimeric G protein cycle. Proc Natl Acad Sci U S A. 2003;100(19):10764–9. doi: 10.1073/pnas.1834247100. [DOI] [PMC free article] [PubMed] [Google Scholar]
- Zhong H, Wade SM, Woolf PJ, Linderman JJ, Traynor JR, Neubig RR. A spatial focusing model for G protein signals. Regulator of G protein signaling (RGS) protien-mediated kinetic scaffolding. J Biol Chem. 2003;278(9):7278–84. doi: 10.1074/jbc.M208819200. [DOI] [PubMed] [Google Scholar]