

Abstract
RNA Polymerase II (Pol II) is bound to the promoter regions of many or most developmental control genes before their activation during Drosophila embryogenesis. It has been suggested that Pol II stalling is used to produce dynamic and rapid responses of developmental patterning genes to transient cues such as extracellular signaling molecules. Here, we present a combined computational and experimental analysis of stalled promoters to determine how they come to bind Pol II in the early Drosophila embryo. At least one-fourth of the stalled promoters contain a shared sequence motif, the “pause button” (PB): KCGRWCG. The PB motif is sometimes located in the position of the DPE, and over one-fifth of the stalled promoters contain the following arrangement of core elements: GAGA, Inr, PB, and/or DPE. This arrangement was used to identify additional stalled promoters in the Drosophila genome, and permanganate footprint assays were used to confirm that the segmentation gene engrailed contains paused Pol II as seen for heat-shock genes. We discuss different models for Pol II binding and gene activation in the early embryo.
Keywords: bioinformatics, core promoter motifs, developmental biology
The dorsal-ventral (DV) patterning of the Drosophila embryo is controlled by one of the best-defined gene regulatory networks known for any developmental process (1–6). It serves as a model for developmental patterning and provides a unique opportunity to study the mechanisms of transcriptional regulation in vivo. To characterize Pol II transcription in the DV pathway, comprehensive ChIP-chip Pol II binding assays were performed with Toll10b mutant embryos (7). Although DV patterning is initiated by a broad Dorsal nuclear gradient that regulates the expression of target genes in a concentration-dependent manner (3, 4), Toll10b mutant embryos contain uniformly high levels of Dorsal (5). As a result, early mesodermal patterning genes, such as Mes2, Heartless (FGF receptor), and WntD are expressed throughout the embryo (3–5). In contrast, developmental control genes that initiate the specification of the neurogenic and dorsal ectoderm (e.g., rho, ind, sog, and tup) are uniformly repressed by the Toll10b embryos.
ChIP-chip Pol II binding assays in Toll10b mutant embryos showed that many repressed genes contain high levels of Pol ll near the transcription start site (7). Closer examination revealed that Pol II is predominantly found in an inactive, stalled form at these genes (7, 8). Many sites of stalled Pol II appear to represent classical instances of promoter-proximal pausing as described at Drosophila heat shock genes (e.g., ref. 9). Stalled Pol II is not only seen at repressed genes but also at a large number of genes that are activated in older embryos, within 12 h after the timeframe of the analysis. For example, a number of genes that are activated in specific mesodermal cell types, such as the cardiac mesoderm, display stalling. Thus, Pol II stalling might be used for the dual purpose of repressing gene expression, and preparing genes for rapid induction at later stages of development.
Altogether, there are ≈1,500 genes in the early Drosophila embryo that contain disproportionately high levels of Pol II near the transcription start site as compared with internal regions of the genes (7, 8). These putative stalled loci include a large number of developmental control genes, including Hox genes, and genes encoding components of various signaling pathways. Indeed, nearly 75% of all DV patterning genes contain stalled Pol II. In contrast, housekeeping genes contain similar levels of Pol II in 5′ and 3′ regions of the transcription units. It is conceivable that Pol II stalling depends on core promoter elements that are absent in constitutively expressed housekeeping genes.
We searched the promoter regions of stalled and constitutively expressed genes for over-represented sequence motifs that might explain the divergent behavior of Pol II binding. Stalled promoters were found to contain a significantly higher GC content and CpG content than constitutive promoters in the region spanning +1 to +60 downstream of the transcription start site. This analysis identified a new core promoter motif [the pause button (PB); KCGRWCG] that was used to predict additional stalled genes in the Drosophila genome. KMnO4 footprint assays were used to confirm that the segmentation gene engrailed contains stalled Pol II. We discuss the possibility that the regulation of Pol II elongation is a critical mechanism for differential gene activity during development.
Results
Promoter Regions of Stalled Genes Contain Enriched GC and CpG Content.
To determine whether promoter sequence elements might contribute to Pol II stalling, we performed DNA sequence analysis with the ≈1,500 stalled promoters identified (7). These genes contain at least 4-fold higher levels of Pol II in the promoter region vs. internal regions of the transcription unit (stalling index >4). The promoter sequences from these genes were then compared with ≈3,000 promoter sequences from constitutively expressed (active) genes, which contain <2-fold higher levels of Pol II in the promoter region vs. the transcription unit (stalling index <2).
The most striking and immediate finding of this comparison is that the promoter regions associated with stalled genes contain a much higher GC content than those associated with constitutive genes, particularly in 3′ regions of the core promoter [see the supporting information (SI)]. In addition, there is a 1.8-fold enrichment of CpG dinucleotides in the region located between +1 and +50 of stalled promoters compared to active promoters (see SI and Table 1). This observation raises the possibility that the region of enriched GC content contributes to the formation of stalled Pol II (see Discussion).
Table 1.
Statistically significant motifs
| Motif | LOGO | Enriched window | Active |
Stalled |
||
|---|---|---|---|---|---|---|
| Density per kb | Percentage | Density per kb | Percentage | |||
| Inverted GAGA |  |
[−295 to −25] | 0.42 | 7 | 3.35 | 26 |
| GAGA | 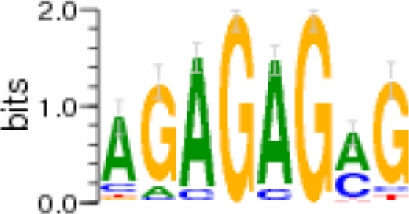 |
[−425 to −5] | 0.28 | 7 | 2.15 | 26 |
| Inr |  |
[−25 to +35] | 5.68 | 27 | 14.48 | 58 |
| Pause button | 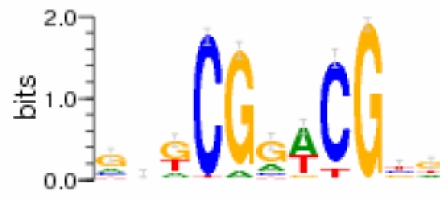 |
[−5 to +55] | 0.67 | 4 | 4.79 | 24 |
Most significant motifs found in ab initio motif search. The presence of each of these motifs shows a highly significant correlation with the stalling index.
Ab initio motif analysis was performed to identify the motifs that are most commonly found in stalled promoters (Table 1 and SI). The enhanced CpG content can be explained, in part, by the presence of specific CpG rich sequence motifs in proximal regions of the stalled promoters. The most enriched motif has the consensus sequence KCGRWCG (Fig. 1C and Table 1), which we named the pause button (PB). Approximately one-fourth of all stalled promoters contain a copy of this motif between +1 and +60, with the most common location at +20 to +30.
Fig. 1.

Motif positional distributions. These figures demonstrate the positional frequency of GAGA, Inr, and PB motifs. The curve shows the fraction of promoters from a given set (stalled or active) that have an instance of the motif in discrete and nonoverlapping 10-bp windows relative to the TSS, centered on multiples of 10.
GAGA, Inr, and DPE Motifs Are Over-Represented in Stalled Promoter Regions.
Further analysis of the stalled vs. constitutive promoter sequences revealed that a number of known sequence motifs are over-represented in stalled promoters. First, GAGA elements, which are known to be essential for Pol II pausing at heat shock genes (10–12), are enriched in proximal regions of many stalled promoters. GAGA motifs are typically found between −250 bp and −50 bp upstream of the transcription start site (Fig. 1A) with the strongest enrichment residing between −100 bp and −80 bp. GAGA elements are also sometimes seen 3′ of the transcription start site (TSS), near the PB or DPE (see below). Such elements are quite common, but the stalled promoters contain ≈8-fold higher densities of the GAGA motif compared with constitutive promoters (Table 1). GAGA-binding proteins might facilitate the access of Pol II to stalled promoters by fostering an open chromosomal conformation (10–12) (see Discussion).
Second, specific core promoter elements are significantly over-represented in stalled promoters. The most common elements are the TATA, Inr, and DPE motifs (13). All three elements are responsible for the binding of TFIID to the core promoter, although it is possible that TFIID adopts different conformations when recruited via TATA or DPE (14). Although TATA is not significantly associated with stalled promoters—it is found in approximately the same fraction of stalled and constitutive promoters (see SI)—the Inr and DPE motifs are significantly enriched in promoters with stalled Pol II. Note that we use the term “DPE” to refer to matches to the DPE consensus in the preferred positions relative to the TSS (15) rather than imposing additional spacing constraints with the Inr (16).
Using previously defined consensus sequences and windows (17), the Inr motif is found in 46.2% of stalled promoters and just 23.6% of active promoters, whereas DPE motifs are detected in 29.3% of stalled promoters compared with 16.1% of active promoters. In both cases, there is ≈2-fold enrichment of the core promoter elements in the stalled promoters (see SI). In contrast, constitutive promoters contain a ≈2-fold enrichment of the DRE motif, which is thought to function as an alternate TATA element (18).
The PB motif described above could also serve as a core promoter element. It is similar to the DPE motif (Fig. 2) and often found at +25 to +35, although the PB has a broader distribution of positions than the DPE. Indeed, matches to the standard DPE consensus in stalled promoters are somewhat more GC-rich than those in active promoters (Fig. 2) and resemble the PB in base composition. These results suggest that specialized core promoter elements might contribute to the propensity of Pol II to stall after transcriptional initiation (see Discussion).
Fig. 2.

PB vs. DPE. (A) LOGO for the “Pause Button” (PB) motif, computed from instances in stalled promoters. (B) LOGO for matches to the DPE consensus (RGWYV) in stalled promoters. (C) LOGO for matches to the DPE consensus in active promoters. Stalled promoters show a DPE base composition that more closely matches the PB LOGO. Positions on the x axis of LOGOs do not represent position relative to the TSS, but show a 20-bp window around the core of each motif, centered such that positions of similar base composition match for each motif.
The Combination of GAGA, Inr, and PB Motifs Best Predicts Stalled Promoters.
We next asked which motif combinations best predict the occurrence of stalled Pol II (Fig. 3). The most predictive combination is the cooccurrence of the GAGA, Inr, and PB motifs. It is seen for 133 stalled promoters, but just 5 constitutive promoters, representing a striking 26.6-fold enrichment for stalled promoters (Table 2). The second most enriched class of stalled promoters contain GAGA, Inr, and DPE elements. 157 of the stalled promoters fall into this category, whereas only 21 constitutive promoters contain all three elements (Table 3), which is an ≈7.5-fold enrichment for stalled genes. Altogether, over a fifth of the stalled promoters contain GAGA, Inr, and either the PB or DPE motif. These are the most predictive combinations of core elements for identifying stalled promoters (see below). In contrast, <2% of the ≈3,000 constitutive promoters contain these combinations of motifs.
Fig. 3.

Graphical representation of promoter sequences. All promoters sorted by stalling index in Toll10b mutants. This figure demonstrates that stalled genes have a higher concentration of GAGA (red), Inr (green), and PB (black) motifs. The main section of the figure shows a horizontal line for each promoter (one pixel thick), with a colored line representing an instance of a motif. The curve on the right shows the percentage of promoters with an occurrence of each motif in a 100-promoter window as a function of stalling index. The schematic representation of a promoter (top) shows a rectangle for each motif in its modal position.
Table 2.
GAGA-Inr-PB synergy
| GAGA | Inr | Pause button | Total, no. | Stalled, % | Active, % | Ambiguous, % | Fold enrichment |
|---|---|---|---|---|---|---|---|
| + | + | + | 165 | 81 | 3 | 16 | 27 |
| + | + | − | 466 | 52 | 16 | 32 | 3.4 |
| + | − | + | 73 | 55 | 12 | 33 | 4.4 |
| − | + | + | 209 | 63 | 16 | 21 | 3.9 |
| + | − | − | 553 | 33 | 32 | 35 | 1.0 |
| − | + | − | 1,515 | 24 | 34 | 42 | 0.7 |
| − | − | + | 183 | 38 | 23 | 39 | 1.7 |
| − | − | − | 3,373 | 14 | 43 | 43 | 0.3 |
Promoters that have all three of GAGA, Inr, and DPE show a greater likelihood of being stalled vs promoters that have two, one, or no occurrences of either. Although more promoters can be explained with a GAGA-Inr-DPE model, GAGA-Inr-PB promoters show a greater enrichment of stalled promoters (see Table 3).
Table 3.
GAGA-Inr-DPE synergy
| GAGA | Inr | DPE | Total, no. | Stalled, % | Active, % | Ambiguous, % | Fold enrichment |
|---|---|---|---|---|---|---|---|
| + | + | + | 228 | 69 | 9 | 22 | 7.5 |
| + | + | − | 386 | 56 | 14 | 31 | 4.2 |
| + | − | + | 104 | 40 | 24 | 36 | 1.7 |
| − | + | + | 387 | 42 | 21 | 37 | 2.0 |
| + | − | − | 508 | 35 | 30 | 35 | 1.2 |
| − | + | − | 1,335 | 25 | 34 | 41 | 0.7 |
| − | − | + | 587 | 20 | 42 | 38 | 0.5 |
| − | − | − | 3,002 | 14 | 43 | 43 | 0.3 |
Promoters that have all three of GAGA, Inr, and PB show a much greater likelihood of being stalled vs promoters that have two, one, or no occurrences.
Motif Analysis Improves the Identification of Stalled Genes.
If the identified sequence elements are strong predictors for Pol II stalling, then it should be possible to classify those genes that were previously found to contain ambiguous stalling indices (7). Furthermore, Pol II stalling is dynamic and genes that have stalled Pol II in one tissue may have an active form of Pol II in another (7). Thus, the prediction of stalled promoters based on sequence analysis could provide clues as to whether a gene contains the stalled form of Pol II in any tissue. Indeed, we found many examples where sequence information helped identify genes with stalled or active Pol II.
The usnp gene, which encodes a protein involved in neurotransmitter release, was classified as stalled (7) but contains core promoter elements typical of either inactive or constitutively expressed genes (Fig. 4 A and B). The promoter lacks all of the features that are enriched in stalled genes—GAGA, Inr, PB, and/or DPE—but contains a DRE motif, which is enriched in constitutive promoters. Closer inspection suggests that the gene was assigned a stalling index score >4 due to Pol II binding at a closely linked gene, CG5554, which is constitutively expressed and encodes a metabolic enzyme (protein disulfide isomerase). To confirm that usnp does not contain stalled Pol II, permanganate footprint assays were performed with Toll10b embryos as described in ref. 7. This method identifies exposed T (and sometimes C) residues in regions of denatured DNA, as seen for transcription bubbles formed at Pol II pause sites. No hypersensitive T or C residues were found in the core promoter and associated regions (Fig. 4C), consistent with the absence of paused Pol II (see below).
Fig. 4.

Predicting DV genes that have stalled Pol II. A genome browser (http://flybuzz.berkeley.edu/cgi-bin/gbrowse/fly4_3) was constructed to integrate all of the results of RNA Pol II ChIP-chip analyses performed with three 2–4 h AED mutant embryos; Toll10b (red), Tollrm9/rm10 (yellow), and Pipe (blue). (A, B, and D–I) Results of RNA Pol II ChIP-chip analyses on the loci of usnp (A and B), Mes2 (D and E), Wnt2 (F and G), and en (H and I). Gene prediction models are displayed above each graphical presentation. Each 3′ end is labeled with open triangle. (B, E, G, and I) Promoter sequences around transcription start site (TSS). Each TSS (+1) is underlined. GAGA element, Initiator (Inr) and Pause Button (PB)/Downstream Promoter Element (DPE) are shown in red, green and purple, respectively. (C and J) Permanganate protection assays were done for usnp (C) and engrailed (en) (J) in 2–4 h Toll10b, Tollrm9/rm10, and gd7 mutants. Transcription start sites (TSSs) are marked on the left and the location of prominent bands relative to TSS (+1) are shown on the right of the autoradiograms. Genomic sequences of G+A and C+T are shown as size markers. As a control, purified genomic DNA from yw embryos was either not treated (Naked 0″) or treated (Naked 30″ and 60″) with 20 mM KMnO4 for 30 and 60 sec. Arrowheads indicate prominent pyrimidine residues (T or C) modified only in chromatin isolated from three mutant embryos by KMnO4 treatment, implying the existence of transcription bubbles in vivo. (B and I) RNA Pol II ChIP-chip results and promoter sequences around TSS of usnp (B) and en (I) are shown.
Mes2 is one of the genes that is predicted to contain stalled Pol II based on promoter structure, but is specifically expressed in the mesoderm (Fig. 4D). Mes2 encodes a putative SANT-domain transcription factor (19) that is activated throughout Toll10b mutant embryos. As a result, it has a Pol II index score below the cut-off for stalling (7) (Fig. 4D). Sequence information, however, predicts that the core promoter should contain stalled Pol II because it contains multiple GAGA sites (four located 200 bp upstream of the transcription start site, and one located downstream) (Fig. 4E, in red), and a PB motif (located downstream of the normal location of the DPE) (Fig. 4E, in purple). The Mes2 gene contains a Pol II index score of ≈3 in Toll10b mutants, below the cut-off for stalled genes (Fig. 4D, Toll10b track in red). The Pol II ChIP-chip assays were extended to include Tollrm9/rm10 and pipe mutants, which lack mesoderm and contain only neurogenic ectoderm or dorsal ectoderm, respectively. Indeed, Mes2 is inactive in both mutants and displays Pol II index scores above the threshold for stalling (Fig. 4D, blue and yellow tracks). For comparison, Wnt2 is shown, which is expressed in the dorsal ectoderm. The Wnt2 promoter contains an Inr and PB motif, and 5′ and 3′ GAGA elements (Fig. 4 F and G).
The engrailed (en) promoter also contains GAGA, Inr, and PB elements predictive of Pol II stalling (Fig. 4I). ChIP-chip assays in Toll10b mutants did not identify en as a stalled gene, because it contains a Pol II index <4 (7). This low score probably reflects the fact that en is a segmentation gene and is expressed in a series of stripes along the length of the embryo. en stripes are expressed in all three tissues across the dorsal-ventral axis, the mesoderm, neurogenic ectoderm, and dorsal ectoderm (Fig. 4H). Thus, none of the mutants we examined (Toll10b, Tollrm9/rm10, and gd7) eliminate en expression. However, permanganate footprint assays identified hypersensitive T and C residues that extend from +42 to +57 in Toll10b mutants, where it contains the highest stalling index (Fig. 4J). There is only weak KMnO4-hypersentivity in Tollrm9/rm10 mutants, which contain the lowest stalling index. Finally, gd7 mutants contain an intermediate Pol II index (Fig. 4H) and display clear hypersensitivity in the region extending from +53 to +67, suggesting a shift in the site of Pol II pausing in the dorsal ectoderm compared with the mesoderm. This evidence for Pol II pausing is entirely consistent with the recent demonstration that the en promoter region contains Nelf-E, a known inhibitor of Pol II elongation (20).
Discussion
We have presented evidence that core promoters containing stalled Pol II in the Drosophila embryo are highly enriched for a GC-rich sequence motif, the pause button (PB) (KCGRWCG). Approximately one-fourth of the ≈1,500 stalled promoters identified in the early embryo contain a copy of the PB motif between +1 and +60 downstream of the TSS. Although the PB does not appear to be a definitive mark for stalled genes, it is possible that a significantly higher fraction of stalled genes will prove to contain a PB or PB-related motif. First, additional GC-rich motifs were identified as being over-represented in stalled vs. constitutive promoters (see SI). Some of these additional motifs are clearly related to the PB. Second, genomic data contain inherent noise. For example, the majority of the promoter sequences that were used for this analysis are based on gene models and EST databases. Thus, a significant fraction of the sequences used in this study might not correspond to bona fide promoter sequences.
The function of the PB is currently unknown. However, the PB and other GC-rich motifs might contribute to the enhanced GC content found in the +1 to +50 region of stalled promoters. This could promote Pol II stalling by creating a “speed bump” that attenuates the movement of the Pol II complex. For example, the high GC content might require higher energy for DNA melting compared with the lower GC content seen for constitutive promoters. Alternatively, the higher GC content might stabilize nucleosomes at these positions and thereby attenuate Pol II elongation indirectly (21, 22).
The PB motif might also influence Pol II stalling by being part of the core promoter. The motif is similar to the consensus of the DPE and is sometimes located in the position of the DPE, between +25 and +35 (15, 16). It is distinct from other core promoter elements, such as the Motif Ten Element (MTE) (23, 24). Altogether, over a fifth of all stalled promoters contain the combination of GAGA, Inr, PB/DPE, a ≈10-fold enrichment compared with the promoter regions of housekeeping genes. Promoter elements such as TATA, Inr and DPE interact with individual subunits of the TFIID complex. It is possible that TFIID adopts a particular conformation when bound to Inr and PB/DPE elements and that this confirmation allows efficient recruitment but not elongation of Pol II. In contrast, TATA might lead to an alternate conformation of TFIID that fails to recruit Pol II without the help of accessory factors bound to promoter-proximal regions or distal enhancers.
Another motif enriched in genes with stalled Pol II is the GAGA motif. This is not surprising, because the GAGA element has been shown to be important for Pol II pausing at the hsp70 locus (10, 12). Mutations in GAGA eliminate pausing, but the core promoter is still active and mediates hsp70 transcription in response to heat shock (12). The loss of paused Pol II reduces the rate of hsp70 induction, and it has been suggested that a major function of pausing is to “prepare” genes for rapid activation. GAGA may promote Pol II pausing at hsp70 by creating an open chromosomal conformation through the recruitment of chromatin remodeling complexes such as NURF (11, 25).
According to the models described above, Pol II stalling represents an intrinsic feature of the sequences contained at and around the core promoter. Indeed, we found that the combination of GAGA, Inr, and PB/DPE is predictive for the presence of stalled Pol II at genes in vivo. For example, the mesodermal gene Mes2 and the segmentation gene en both contain paused Pol II, whereas a gene previously classified as stalled (usnp) but lacking GAGA, Inr, and PB/DPE is not paused.
Based on the intrinsic properties of promoters to promote Pol II stalling, we propose that a large proportion of developmental control genes (Hox, Wnt signaling, etc.) are stalled by default. The right combination of stalling motifs in the core promoter and general activators bound to promoter-proximal regions might establish a stalled form of Pol II at these genes. Selective gene activation then depends on sequence-specific DNA binding proteins bound to distal enhancers, which may stimulate Pol II elongation and Pol II reinitiation. This model is consistent with the observation that a number of genes containing paused Pol II, including hsp70, rho, and en, display stable transcription bubbles even when they are actively expressed. The advantage of such a two-step mechanism of activation is that it may facilitate sharp on/off switches in transcription. Pol II stalling may not only poise genes for rapid activation but might lead to a rapid shut-off of transcription once appropriate sequence-specific activators are no longer active. It is possible that these observations provide an explanation for a recent result showing that developmental genes are enriched for Inr-DPE usage and that housekeeping genes are enriched for DRE usage (26).
Materials and Methods
Sequence Analysis of Stalled and Active Promoters.
Full-genome RNA polymerase II ChIP-chip data from mutants characterizing the three main early embryo germ layers (Toll10b, Tollrm9/rm10, and pipe) from Zeitlinger et al. (7) was used for quantitatively identifying stalled and active loci across the genome. FlyBase annotation, release 4.3, was used for the purpose of identifying transcription start sites and for mapping the transcriptional units of genes. The stalling index for a given gene was computed as
where MaxTSS is the maximum Pol II binding within 300bp of one of the alternate transcripts for the gene. Mediantranscripts is the median Pol II binding across all alternate transcripts for the gene. This is a slight modification of the method described in Zeitlinger et al. (7), where they compute the median only over the alternate transcript that corresponds to the maximum. This modification was made to correct potential errors made when only choosing one transcript, which may be unrepresentatively short compared to other transcripts. We focused on genes that are stalled in the early mesoderm (Toll10b mutants), and unless otherwise noted, we define stalled promoters as having SI ≥ 4 in Toll10b, active promoters are such that SI ≤ 2 for all germ layers. For all further analysis of a given gene, the TSS nearest to the maximum Pol II peak was used. Promoters from a given class where aligned such that each TSS is at the same position.
The GC content profile analysis uses a 10-bp windows relative to the TSS. The average GC content across all promoters was computed. The GC content computed from each sequence bin was used to define a log-likelihood score across all bins from −600 to +200. A score was then computed for each promoter, quantifying how closely it matches the positional GC-profile of the stalled promoters and differs from the active promoters. For promoters matching the stalled promoter profile, the score will be positive, and, for promoters matching the active promoter profile, the score will be negative. Such a log-likelihood score shows a significant correlation with the stalling index (see SI).
The motif search was performed in 50-bp windows from −100 to +100 around the TSS. In each window, all motifs defined such that their instances are within 1 mismatch from a central 8-mer were enumerated, generating 48 ≈ 6.5 × 10⁴ motifs. For each motif j, an z score quantifying how enriched the motif was in the stalled promoters was defined such that
where Ns,j is the number of stalled promoters with motif j, Λs is the total number of mers of length ℓ in a given window in the stalled promoters, and pa,j is the frequency of occurrence of motif j in the same window in the active promoters. To determine a z score threshold, sequences from each bin were randomized such that the base composition at each position relative to the TSS was preserved. This is achieved by shuffling bases at a particular position across all promoters from a given promoter class. Ten randomized stalled and active promoter sets were constructed, and a z score threshold was chosen that corresponded to a P value of 10−5, which is essentially the smallest P value that can be resolved with one randomization. Significant motifs are then updated, and similar motifs are merged until the process converges. More information on the details of the motif finding protocol is available in the SI.
To determine which motifs most significantly characterized the stalled promoters, a multivariate regression analysis was performed to measure the correlation with the number of occurrences of a given motif and the stalling index. To achieve this end, we created a feature vector to describe each promoter, x = (x1, x2, … , xn), where x1 = NGAGA, the number of GAGA sites surrounding the gene, and so on for each found motif or feature. The number of occurrences of each motif found is included as a feature in this vector. The simplest model is a linear relationship between each of these features and the stalling score
 |
which is the standard expression for multivariate regression. These coefficients can be computed to minimize the error in the predicted stalling index, SIpred, and the empirical stalling index, SIemp. Each coefficient is evaluated on its individual correlation with the empirical stalling score. Therefore, the null hypothesis for each coefficient is Hi,0:θi = 0, and each coefficient can be evaluated by using a Student's t statistic and a two-tailed P value computation. Features with P > 0.05 where removed, and the analysis was repeated. The remaining significant motifs and features were then used to compute a predicted stalling index. As a figure of merit, the top 500 predicted stalled promoters (highest SIpred) contains 73% empirically stalled promoters. GAGA, Inr, and the PB are among the most significant motifs found from this analysis.
Potassium Permanganate (KMnO4) Transcription Bubble Assay.
A KMnO4 transcription bubble assay was performed as described in refs. 20 and 25. Embryos were collected 2–4, 6–8, and 10–12 h after egg deposition (AED), dechorinated, partially homogenized with a plastic pestle, and treated with 20 mM KMnO4 for 90 sec on ice. Transcription start sites (TSSs) of investigated genes were identified based on the analysis of ESTs and annotated TSSs in Flybase and confirmed by genome-wide expression analysis, using tiling arrays (27). A pair of linker primers and gene-specific primers were used for ligation-mediated PCR (LM-PCR). The sequences, relative locations to TSS as +1 and melting temperatures (Tm) were as follows: linker A, 5′-GCGGTGATTTAAAAGATCTGAATTC-3′ (61.4°C); linker B, 5′-GAATTCAGATC-3′; en-LMPCR-1, 5′- ACACTGAGCCACTGATTCTT-3′ (+154 to +134, 54.81°C); en-LMPCR-2, 5′-GCCACTGATTCTTCTGATTGCT-3′ (+147 to +125, 60.77°C); en-LMPCR-3, 5′-GCCACTGATTCTTCTGATTGCTCA-3′ (+147 to +123, 64.98°C); usnp-LMPCR-1, 5′-GAATCTGTCCACGTCATC-3′ (+136 to +118, 51.5°C); usnp-LMPCR-2, 5′-GTCCACGTCATCGAAGTGAT-3′ (+130 to +110, 58.51°C); usnp-LMPCR-3, 5′-TCCACGTCATCGAAGTGATCG-3′ (+129 to +108, 64.5°C).
Supplementary Material
Acknowledgments.
M.L. thanks Tom Kornberg for his insightful suggestions. This work was funded by National Institutes of Health Grant GM34431 (to M.L.); the Moore Foundation; and, in part, by the Stowers Institute for Medical Research (J.Z.).
Footnotes
The authors declare no conflict of interest.
This article contains supporting information online at www.pnas.org/cgi/content/full/0802406105/DCSupplemental.
References
- 1.Levine M, Davidson EH. Gene regulatory networks for development. Proc Natl Acad Sci USA. 2005;102:4936–4942. doi: 10.1073/pnas.0408031102. [DOI] [PMC free article] [PubMed] [Google Scholar]
- 2.Stathopoulos A, Levine M. Genomic regulatory networks and animal development. Dev Cell. 2005;9:449–462. doi: 10.1016/j.devcel.2005.09.005. [DOI] [PubMed] [Google Scholar]
- 3.Rushlow CA, Han K, Manley JL, Levine M. The graded distribution of the dorsal morphogen is initiated by selective nuclear transport in Drosophila. Cell. 1989;59:1165–1177. doi: 10.1016/0092-8674(89)90772-1. [DOI] [PubMed] [Google Scholar]
- 4.Roth S, Stein D, Nüsslein-Volhard C. A gradient of nuclear localization of the dorsal protein determines dorsoventral pattern in the Drosophila embryo. Cell. 1989;59:1189–1202. doi: 10.1016/0092-8674(89)90774-5. [DOI] [PubMed] [Google Scholar]
- 5.Stathopoulos A, Van Drenth M, Erives A, Markstein M, Levine M. Whole-genome analysis of dorsal-ventral patterning in the Drosophila embryo. Cell. 2002;111:687–701. doi: 10.1016/s0092-8674(02)01087-5. [DOI] [PubMed] [Google Scholar]
- 6.Zeitlinger J, et al. Whole-genome ChIP-chip analysis of Dorsal, Twist, and Snail suggests integration of diverse patterning processes in the Drosophila embryo. Genes Dev. 2007;21:385–390. doi: 10.1101/gad.1509607. [DOI] [PMC free article] [PubMed] [Google Scholar]
- 7.Zeitlinger J, et al. RNA polymerase stalling at developmental control genes in the Drosophila melanogaster embryo. Nat Genet. 2007;39:1512–1516. doi: 10.1038/ng.2007.26. [DOI] [PMC free article] [PubMed] [Google Scholar]
- 8.Muse GW, et al. RNA Polymerase is poised for activation across the genome. Nat Genet. 2007;39:1507–1511. doi: 10.1038/ng.2007.21. [DOI] [PMC free article] [PubMed] [Google Scholar]
- 9.Lee H, Kraus KW, Wolfner MF, Lis JT. DNA sequence requirements for generating paused polymerase at the start of hsp70. Genes Dev. 1992;6:284–295. doi: 10.1101/gad.6.2.284. [DOI] [PubMed] [Google Scholar]
- 10.Shopland LS, Hirayoshi K, Fernandes M, Lis JT. HSF access to heat shock elements in vivo depends critically on promoter architecture defined by GAGA factor, TFIID, and RNA polymerase II binding sites. Genes Dev. 1995;9:2756–2769. doi: 10.1101/gad.9.22.2756. [DOI] [PubMed] [Google Scholar]
- 11.Tsukiyama T, Wu C. Chromatin remodeling and transcription. Curr Opin Genet Dev. 1997;7:182–191. doi: 10.1016/s0959-437x(97)80127-x. [DOI] [PubMed] [Google Scholar]
- 12.Wilkins RC, Lis JT. Dynamics of potentiation and activation: GAGA factor and its role in heat shock gene regulation. Nucleic Acids Res. 1997;25:3963–3968. doi: 10.1093/nar/25.20.3963. [DOI] [PMC free article] [PubMed] [Google Scholar]
- 13.Smale ST, Kadonaga JT. The RNA polymerase II core promoter. Annu Rev Biochem. 2003;72:449–479. doi: 10.1146/annurev.biochem.72.121801.161520. [DOI] [PubMed] [Google Scholar]
- 14.Amir-Zilberstein L, et al. Differential regulation of NF-κB by elongation factors is determined by core promoter type. Mol Cell Biol. 2007;27:5246–5259. doi: 10.1128/MCB.00586-07. [DOI] [PMC free article] [PubMed] [Google Scholar]
- 15.Burke TW, Kadonaga JT. The downstream core promoter element, DPE, is conserved from Drosophila to humans and is recognized by TAFII60 of Drosophila. Genes Dev. 1997;11:3020–3031. doi: 10.1101/gad.11.22.3020. [DOI] [PMC free article] [PubMed] [Google Scholar]
- 16.Burke TW, Kadonaga JT. Drosophila TFIID binds to a conserved downstream basal promoter element that is present in many TATA-box-deficient promoters. Genes Dev. 1996;10:711–724. doi: 10.1101/gad.10.6.711. [DOI] [PubMed] [Google Scholar]
- 17.Gershenzon NI, Trifonov EN, Isohikhes IP. The features of Drosophila core promoters revealed by statistical analysis. BMC Genomics. 2006;7:161–170. doi: 10.1186/1471-2164-7-161. [DOI] [PMC free article] [PubMed] [Google Scholar]
- 18.Kopytova DV, et al. Two isoforms of Drosophila TRF2 are involved in embryonic development, premeiotic chromatin condensation, and proper differentiation of germ cells in both sexes. Mol Cell Bio. 2006;26:7492–7505. doi: 10.1128/MCB.00349-06. [DOI] [PMC free article] [PubMed] [Google Scholar]
- 19.Zimmermann G, Furlong EE, Suyama K, Scott MP. Mes2, a MADF-containing transcription factor essential for Drosophila development. Dev Dyn. 2006;235:3387–3395. doi: 10.1002/dvdy.20970. [DOI] [PubMed] [Google Scholar]
- 20.Wang X, Lee C, Gilmour DS, Gergen JP. Transcription elongation controls cell fate specification in the Drosophila embryo. Genes Dev. 2007;21:1031–1036. doi: 10.1101/gad.1521207. [DOI] [PMC free article] [PubMed] [Google Scholar]
- 21.Anderson JD, Widom J. Poly (dA-dT) promoter elements increase the equilibrium accessibility of nucleosomal DNA target sites. Mol Cell Biol. 2001;21:3830–3839. doi: 10.1128/MCB.21.11.3830-3839.2001. [DOI] [PMC free article] [PubMed] [Google Scholar]
- 22.Segal E, et al. A genomic code for nucleosomal positioning. Nature. 2006;442:772–778. doi: 10.1038/nature04979. [DOI] [PMC free article] [PubMed] [Google Scholar]
- 23.Ohler U, Liao G, Niemann H, Rubin GM. Computational analysis of core promoter elements in the Drosophila genome. Genome Biol. 2002;3 doi: 10.1186/gb-2002-3-12-research0087. research0087.1-0087.12. [DOI] [PMC free article] [PubMed] [Google Scholar]
- 24.Lim CY, et al. The MTE, a new core promoter element for transcription by RNA polymerase II. Genes Dev. 2004;18:1606–1617. doi: 10.1101/gad.1193404. [DOI] [PMC free article] [PubMed] [Google Scholar]
- 25.Wang YV, Tang H, Gilmour DS. Identification in vivo of different rate-limiting steps associated with transcriptional activators in the presence and absence of a GAGA element. Mol Cell Biol. 2005;25:3543–3552. doi: 10.1128/MCB.25.9.3543-3552.2005. [DOI] [PMC free article] [PubMed] [Google Scholar]
- 26.Engström PG, Sui JHS, Drivenes Ø, Becker TS, Lenhard B. Genomic regulatory blocks underlie extensive microsynteny conservation in insects. Genome Res. 2007;17:1898–1908. doi: 10.1101/gr.6669607. [DOI] [PMC free article] [PubMed] [Google Scholar]
- 27.Biemar F, et al. Comprehensive identification of Drosophila dorsal-ventral patterning genes using a whole-genome tiling array. Proc Natl Acad Sci USA. 2006;103:12763–12768. doi: 10.1073/pnas.0604484103. [DOI] [PMC free article] [PubMed] [Google Scholar]
Associated Data
This section collects any data citations, data availability statements, or supplementary materials included in this article.