

Abstract
ARNT and ARNT2 proteins are expressed in mammalian and aquatic species and exhibit a high level of amino acid identity in the bHLH/PAS domains involved in protein interactions and DNA binding. Since the analysis of ARNT2 function at the protein level has been limited, ARNT2 function in aryl hydrocarbon receptor (AHR) mediated signaling was evaluated and compared to ARNT. In vitro, ARNT and ARNT2 dimerized equally with the AHR in the presence of TCDD and ARNT2 out-competed ARNT for binding to the AHR when expressed in excess. In contrast, activation of the AHR with 3-methylcholanthrene or benzo[a]pyrene resulted in predominant formation of AHR•ARNT complexes. ARNT2 expressed in Hepa-1 cell culture lines with reduced ARNT protein resulted in minimal induction of endogenous CYP1A1 protein compared to cells expressing ARNT and mutation of the putative proline residue at amino acid 352 to histidine failed to produce an ARNT2 that could function in AHR-mediated signaling. However, the expression of ARNT2 in wild type Hepa-1 cells reduced TCDD-mediated induction of endogenous CYP1A1 protein by 30%, even though AHR•ARNT2 complexes could not be detected in nuclear extracts. Western blot analysis of numerous mouse tissues and various cell culture line showed that both endogenous ARNT and ARNT2 could be detected in cells derived from kidney, CNS and retinal epithelium. Thus, ARNT2 has the ability to dimerize with the liganded AHR in vitro.and is influenced by the activating ligand yet appears to be limited in its ability to influence AHR mediated signaling in cell culture.
Keywords: Ah receptor, ARNT, ARNT2, bHLH/PAS, TCDD, CYP1A1
Introduction
ARNT is a member of the basic-helix loop-helix PER/ARNT/SIM (bHLH/PAS) protein family that is involved in mediating numerous developmental and response pathways (Kewley et al., 2004). Several isoforms of ARNT have been identified in mammalian and aquatic species and are termed: ARNT (HIF-1B), ARNT2, and ARNT3 (BMAL1, MOP3, JAP3, ARNTL1). ARNT and ARNT2 possess a 95% amino acid identity within the bHLH and >90% amino acid identity PAS A and B domains that are known to be involved in DNA binding and heterodimerization (Pongratz et al., 1998; Reisz-Porszasz et al., 1994). ARNT appears to be ubiquitously expressed in nearly all cell types in various species (Abbott et al., 1995; Aitola and Pelto-Huikko, 2003), while ARNT2 was initially classified a being expressed primarily in the brain and kidney (Hirose et al., 1996). However, while ARNT is known to have a more ubiquitous expression pattern than ARNT2, mRNA for the two genes is co-expressed to some degree during mouse development and in many adult tissues (Aitola and Pelto-Huikko, 2003). It is interesting, therefore, that gene knock-out of either ARNT or ARNT2 in mice, results in embryonic or perinatal lethality that is characterized by distinct phenotypes (Keith et al., 2001; Kozak et al., 1997; Maltepe et al., 1997). These findings have led to the hypothesis that the ARNT and ARNT2 proteins have distinct functions in the presence of different dimerization partners and are not fully capable of complementing each other despite the high level of amino acid identity. Hwever, while much is known about the expression of ARNT at the protein level and its ability to dimerize with various bHLH/PAS partners (Kewley et al., 2004; Pongratz et al., 1998; Reisz-Porszasz et al., 1994), the overlap of expression of ARNT and ARNT2 protein in cells and tissues and well as the direct interaction of ARNT2 with various bHLH/PAS dimerization partners is less defined.
ARNT is a well established dimerization partner with the ligand activated Ah receptor (AHR; (Reyes et al., 1992), and Hif-1a (Semenza et al., 1997). ARNT has also been implicated in binding to the aryl hydrocarbon receptor repressor (AHRR) where it may be involved with negatively influencing AHR signaling (Baba et al., 2001). In addition, ARNT appears to be a binding partner for mSIM (Sonnenfeld et al., 1997; Swanson et al., 1995). Finally, the ability of ARNT to function as a homodimer has been suggested by the use of yeast two-hybrid screens, E-box reporter studies, and gel shift assays and would likely involve regulation through class A E-box motifs (5′CACGTG) as observed for MyoD or USF (Antonsson et al., 1995; Sogawa et al., 1995; Swanson et al., 1995). In contrast, the interactions of mammalian ARNT2 with bHLH/PAS partners remain less clear. Much of the evidence for the interaction of ARNT2 with binding partners is implied by phenotypes of gene disruption studies in mice. For example, the interaction of ARNT2 with HIF-1a is implied based on the evidence that HIF-1a knockout animals exhibit a greater severity of vascular defects during development than ARNT knockouts (Iyer et al., 1998; Ryan et al., 1998). Since mRNA to HRE-regulated genes such as VEGF is present in the neural tube of Arnt−/− mice, it has been suggested that ARNT2 is a compensating protein (Kozak et al., 1997; Maltepe et al., 1997). Additionally, Arnt−/− cultured neurons expressing ARNT2 continue to display hypoxic induction of HIF-1-regulated target genes, though this induction is reduced (Maltepe et al., 1997). Finally, the interaction of ARNT2 with mSIM is implied by the similarity in phenotype between mSim−/− and Arnt2−/− mice as both animal models fail to develop specific neuroendocrine lineages in the paraventricular and supraoptic nuclei of the hypothalamus (Hosoya et al., 2001; Michaud et al., 2000). Thus, it appears that both ARNT and ARNT2 have the capability of associating with the same sets of bHLH/PAS dimerization partners, yet do not appear to complement each others’ loss in knockout models. Unfortunately, the limited number of studies that have evaluated biochemical and molecular differences in ARNT and ARNT2 function and whether they compete for dimerization partners report conflicting results (Dougherty and Pollenz 2006; Hirose et al., 1996; Sekine et al., 2006). In addition, there is very little information on the co-expression of ARNT and ARNT2 protein in cell lines or tissues. In an effort to address these questions, studies were initiated to investigate the ability of defined concentrations of ARNT and ARNT2 to interact with the AHR and bind DNA in vitro and in cell culture.
Materials and Methods
Materials
2,3,7,8-tetracholorodibenzo-p-dioxin (TCDD) (≥98% stated chemical purity) was obtained from Cambridge Isotopes. (Andover, MA) and was solubilized in dimethyl sulfoxide (Me2SO). Benzo[a]pyrene (BAP) (≥96% stated chemical purity) and 3-methylcholanthrene (3-MC) (≥98% stated chemical purity) were purchased from Sigma (St. Louis, MO) and solubilized in dimethyl sulfoxide (Me2SO).
Buffers
Phosphate-buffered saline is 0.8% NaCl, 0.02%KCL, 0.14% Na2HPO4, 0.02% KH2PO4, pH 7.4. Gel sample buffer (2X) is 125 mM Tris, pH 6.8, 4% SDS, 25% glycerol, 4 mM EDTA, 20 mM dithiothreitol, 0.005% bromophenol blue. Tris-buffered saline is 50 mM Tris and 150 mM NaCl, pH 7.5. TTBS is 50 mM Tris, 0.2% Tween 20, 300 mM NaCl, pH 7.5. TTBS+ is 50 mM Tris, 0.5% Tween 20, 300 mM NaCl, pH 7.5. BLOTTO is 5% dry milk in TTBS. Lysis buffer (2X) is 50 mM HEPES, pH 7.4, 40 mM sodium molybdate, 10 mM EGTA, 6 mM MgCl2, and 20% glycerol. Gel shift buffer (5X) is 50 mM HEPES, pH 7.5, 15 mM MgCl2 and 50% glycerol. MENG is 25 mM MOPS, 10mM EDTA, and 10% glycerol. RIPA is 50 mM Tris, pH 7.4, 150 mM NaCl, and 0.2% NP40.
Cells and Growth Conditions
Wild-type Hepa-1c1c7 (Hepa-1) mouse hepatoma cells, type II (LA-II) Hepa-1 variants, human ARPE-19 retinal pigmented epithelium cells, B35 rat central nervous system cells, TCMK-1 mouse kidney cells, NRK-49F rat kidney cells, and A498 human kidney adenocarcinoma cells were purchased from the American Type Culture Collection (Manassas, VA). All cells were propagated in the growth medium specified by ATCC. All cells were passaged at 3–4 day intervals and were used in experiments during a 2-month period at approximately 70–90% confluence. For treatment regimens, stock chemicals were administered directly into growth medium for the indicated incubation times.
Antibodies
Specific antibodies against the AHR (A-1, A1A) and ARNT (R-1) were identical to those described previously (Holmes and Pollenz, 1997; Pollenz et al., 1994). All antibodies are affinity-purified IgG fractions. Monoclonal mouse antibodies against the V5 epitope were purchased from Invitrogen (Carlsbad, CA). Polyclonal rabbit antibodies against ARNT2 and CYP1A1 for Western blotting were purchased from Santa Cruz Biotechnology (Santa Cruz, CA). Polyclonal rabbit antibodies against rat CYP1A1 for immunofluorescence studies were purchased from Chemicon (Billerica, MA). Polyclonal rabbit B-actin antibodies were purchased from Sigma (St. Louis, MO). conjugated secondary antibodies were purchased from Jackson Immunoresearch (West Grove, PA).
Generation of Expression Constructs
Each of the coding regions from ARNT and ARNT2 was ligated into a pcDNA 3.1(−) vector allowing each of the full-length untagged proteins to be expressed. V5 tagged ARNTs were also generated. For these expression constructs, the V5 epitope (GKPIPNPLLGLDST) was added to the coding region of each ARNT by sequential PCR along with XhoI and HindIII sites allowing the resultant PCR product to cloned into pcDNA 3.1(−). The following forward primers were used for ARNT: 5′CCTAACCCTCTCCTCGGTCTCGATTCTACGGCGGCGACTACAGCTAACCCAG and 5′CAATCTCGAGCCACCATGGGTAAGCCTATCCCTAACCCTCTCCTCGGTCTC. The reverse primer for ARNT was 5′CAATAAGCTTCTATTCGGAAAAGGGGGGAAACATAG TTAG. For the V5 tag of ARNT2, the following forward primers were used: 5′CCTAACCCTCTCCTCGGTCTCGATTCTACGGCAACCCCGGCCGCCGTCAAC and 5′-CAATCTCGAGCCACCATGGGTAAGCCTATCCCTAACCCTCTCCTCGGTCTC. The reverse ARNT2 primer was 5′-CAATAAGCTTCTACTCAGAAAATGGAGGGAACATGC. Transcription start and stop sites are underlined.
In Vitro Mutagenesis
Site-directed mutagenesis of the V5-ARNT2 parental construct to mutate the proline in ARNT2 at position 352 to a histidine residue was performed using the Quikchange II XL site-directed mutagenesis kit as per the manufacturer’s protocol (Stratagene). The primer sets used are listed with the specific base changes underlined. Forward 5′-CACGTTTGTGGACCACAGATGCATCAGTGTG; Reverse 5′-CACACTGATGCATCTGTGGTCCACAAACGTG
In Vitro Expression of Protein
Recombinant protein was produced from expression constructs using the TNT Coupled Reticulocyte Lysate System essentially as detailed by the manufacturer (Promega, Madison, WI). Upon completion of the 90-min reaction, a portion of the sample was combined with an equal volume of 2X gel sample buffer and boiled for 5 min for Western blotting and the remaining portion stored at −80°C for use in functional studies.
Transient transfection of LA-II and WT cells
LA-II cells were seeded at 2×10⁵ cells/well onto 35 mm dishes and propagated overnight. A cocktail containing 3–6 μg ARNT expression vector and 22 μl LipofectAMINE™ (Gibco) transfection reagent was prepared in 1.3 mL of serum-free DMEM. This volume was sufficient for transfecting six 35mm wells from the same pool of DNA/transfection reagent allowing for triplicates of control and experimental samples. After a 6–8 h transfection period, medium from each well was replaced with fresh medium containing FBS and allowed to recover for 16 h prior to experimental treatments. Cells were then harvested from plates and processed as detailed below. WT Hepa-1 cells were similarly transfected using 3–6 μg expression vector and 15 μl LipofectAMINE™. Experiments were repeated at least three times.
Preparation of Total Cell/Tissue Lysates
After treatment, cell monolayers were washed twice with PBS and detached from plates by trypsinization (0.05% trypsin/0.5 mM EDTA). Cell pellets were washed with PBS and suspended in 50 to 100 μl of ice-cold 2X lysis buffer. Cell suspensions were immediately sonicated for 5 s, supplemented with phenylmethylsulfonyl fluoride (PMSF, final concentration, 100 μM), and sonicated for an additional 5 s. For total tissue lysates, frozen tissue samples were weighed and 200–750ul of 2x lysis buffer supplemented with Nonidet P-40 (0.5%), leupeptin (10 μg/ml), and aprotinin (20 μg/ml) was added to each sample depending on tissue sample size. Samples were sonicated for 10–20 s, supplemented with PMSF, and sonicated for an additional 10–20 s. either total cell or total tissue lysates, a small portion of the lysate was removed immediately after sonication for protein determination and the remainder was combined with an equal volume of 2X gel sample buffer, sonicated an addition 10 s, and immediately heated for 5 min at 100°C. After heating samples were sonicated an additional 5 s and stored at −20°C or −70°C. Protein concentrations were determined by the Coomassie Blue Plus assay (Pierce, Rockford, IL) with bovine serum albumin as the standard.
Preparation of Cytosol and Nuclear Extracts
Cell monolayers were washed twice with PBS and detached from plates by trypsinization (0.05% trypsin/0.5 mM EDTA). Cell pellets were then washed with PBS and suspended in ice-cold MENG. Lysis was carried out by homogenization in small glass dounce vessels using 30–50 strokes or by vortexing for 30 s in 1% Nonidet P-40 lysis buffer. Nuclei were pelleted by centrifugation at 5,000 rpm for 2 min at 4°C. The supernatant was removed for protein determination or combined with an equal volume of 2X gel sample buffer and boiled for 5 min for Western blotting. Nuclei were washed twice with MENG and pelleted at 5,000 rpm for 2 min at 4°C. Pellets were suspended in MENG supplemented with 400 mM KCl and vigorously vortexed. Samples were kept on wet ice for 30 min, and vortexed every 5 minutes. Samples were then centrifuged at 14,000 rpm for 15 min at 4°C. Nuclear extracts were dialyzed against MENG at 4°C for 2 h to remove the KCl. Dialyzed samples were evaluated for protein concentration and frozen at −80°C, or combined with an equal volume of 2X gel sample buffer and boiled. Protein concentrations were determined by the Coomassie Blue Plus assay (Pierce, Rockford, IL) with bovine serum albumin as the standard.
Western Blot Analysis and Quantification of Protein
Protein samples were resolved by denaturing electrophoresis on discontinuous polyacrylamide slab gels (SDS-PAGE) and were electrophoretically transferred to nitrocellulose. Immunochemical staining was carried out with varying concentrations of primary antibody (figure legends) in BLOTTO buffer supplemented with DL-histidine (20 mM) for 1 hour at 22°C. Blots were washed with three changes of TTBS or TTBS+ for a total of 45 min. The blot was then incubated in BLOTTO buffer containing a 1:10,000 dilution of goat anti-rabbit- or goat anti-mouse-HRP secondary antibodies for 1 h at 22°C and washed in TTBS or TTBS+ as above. Before detection, the blots were washed in PBS for 5 min. Bands were visualized with the enhanced chemiluminescence (ECL) kit as specified by the manufacturer (Amersham Biosciences, Piscataway, NJ). Multiple exposures of each set of samples were produced. The relative concentration of target proteins was determined by computer analysis of the exposed film as detailed previously (Pollenz, 1996; Sojka et al., 2000)
Immunofluorescence Staining and Microscopy
All immunocytochemical procedures (cell plating, fixation, and staining) were carried out as previously described (Pollenz et al., 1994; Pollenz 1996; Holmes and Pollenz 1997) and antibody conditions are indicated in the figure legends. Cells were observed on an Olympus IX70 microscope. On average, 5–10 fields (15–25 cells per field) were evaluated on each coverslip and 3–4 fields were photographed with a digital camera at the same exposure time to generate the raw data.
In Vitro Activation of AHR·ARNT Complexes and Electrophoretic Mobility Shift Assay
In vitro activation and EMSA were performed as previously described (Pollenz et al., 1996). Briefly, 50 ug of cytosol or approximately equal amounts of in vitro translated ARNT or ARNT2 were mixed with limiting amounts of in vitro translated AHR in MENG buffer in a total volume proportionate to the number of samples being evaluated. Aliquots were then removed from this master mix and treated as detailed for each of the experiments detailed. Each of the samples were supplemented with TCDD (100 nM), 3-MC (54 uM), BAP (17 uM) or DMSO (0.5%) and incubated at 30°C for 2 h. For EMSA, double-stranded fragments corresponding to the consensus XRE-D of the murine CYP1A1 promoter were utilized (Shen and Whitlock, 1992). A portion of the in vitro activated sample was mixed 1X gel shift buffer, polydIdc and KCl (final concentration of 80mM). If supershift was to be evaluated, 100ng of IgG was also added to the sample at this time. Samples were incubated at 22°C for 15 minutes. Approximately 4ng of 32P-labeled XRE was then added to each sample and the reaction incubated an additional 15 minutes at 22°C. The samples were then resolved on 5% acrylamide/TBE gels, dried, and exposed to film. To assess the level of target protein in the activated samples, a portion of samples were combined with an equal volume of 2X gel sample buffer and evaluated by Western analysis. The relative DNA binding intensity of EMSA samples were determined by computer analysis of the exposed film as detailed previously (Pollenz, 1996; Sojka et al., 2000).
Immunoprecipitation
In vitro activated samples were precipitated in RIPA buffer supplemented with bovine serum albumin (20 μg/ml), histidine (20 mM), 1 μg specific or pre-immune IgG and 15 ul Protein A/G agarose (Pierce) for 2 hours at 4°C. Pellets were washed with 800 ul TTBS three times for 10 minutes at 4°C and protein eluted by boiling in 30 ul 1X gel sample buffer. Samples were centrifuged at 14,000 rpm and the supernatant resolved by SDS-PAGE and Western blotting as described above.
Statistical Analysis
Target protein bands were normalized to internal standards (actin) to generate normalized densitometry units. Values were compared by ANOVA and Tukey-Kramer multiple comparison tests using InStat software (GraphPad Software Inc. San Diego, CA). Results are presented as mean ± SE. A probability value of <0.05 was considered significant.
Results
Association of ARNT and ARNT2 with the AHR and DNA in vitro
Recent studies suggest that ARNT2 does not complement AHR-mediated signaling in ARNT deficient cell lines (Sekine et al., 2006). To begin to investigate whether the reduced ability of ARNT2 to complement AHR signaling was occurring at the level of AHR dimerization and DNA binding, cDNAs for both genes were ligated into expression vectors so that the expressed proteins would both contain the V5 epitope tag at the NH-terminus. This allowed the concentration of both proteins to be directly compared in all subsequent experiments whether the proteins were expressed in vitro or in cell culture. To validate the in vitro activation assay, ARNT, ARNT2 and AHR were expressed in an in vitro reticulocyte system and evaluated by Western blotting to establish the level of target protein expression. Equal amounts of ARNT or ARNT2 were then mixed with a limiting concentration of AHR, activated in the presence of TCDD, and evaluated using electrophoretic mobility shift assays (EMSA) in the presence or absence of antibodies against the AHR, ARNT, ARNT2 or preimmune IgG (Figure 1A). A Western blot of the exact samples utilized for the EMSA is shown in Figure 1B. The results show that there is a shift in the XRE oligonucleotide when the samples are activated with TCDD and the intensity of the shift is the same whether the AHR is activated with ARNT of ARNT2 (Figure 1A, lanes 2 and 8). The specificity of the shift to the AHR, ARNT and ARNT2 is demonstrated by the ability to supershift the bands in the presence of IgG specific to the target proteins but not to preimmune IgG (Figure 1A, lanes 3–8 and 9–12).
Figure 1. DNA binding of AHR•ARNT and AHR•ARNT2 heterodimers.

A) In vitro expressed AHR was combined with either ARNT or ARNT2 into a stock sample and then aliquoted and incubated in the presence of DMSO (0.5%) or TCDD (100 nM) for 2 h at 30°C. Aliquots from the stock samples were mixed with 32P-labeled XRE oligonucleotides and protein•DNA complexes resolved as detailed in Materials and Methods. In some samples, 50ng of IgG specific to ARNT (A1), ARNT2 (A2), AHR (Ah) or preimmune IgG (IG) were included in the binding reaction prior to loading on the gel. The location of the specific AHR•ARNT•XRE and AHR•ARNT2•XRE complex and free XRE are indicated. B) Aliquots of the activation reactions utilized in A were denatured and evaluated for ARNT, ARNT2 or AHR protein by Western analysis using either anti-V5 IgG (1:500) or anti-AHR IgG (1ug/ml) and visualized by ECL with GAM-HRP IgG (1:10,000; V5) or GAR-HRP IG (1:10,000; AHR). Note that the concentration of both V5-ARNT and V5-ARNT2 in each sample is similar. C, control samples; T, samples activated with TCDD. C) In vitro expressed AHR, ARNT and ARNT2 were combined in the same tube and activated and analyzed by EMSA as detailed in A. D) Aliquots of the activation reactions utilized in C were denatured and evaluated for ARNT and ARNT2 expression using the V5 antibody as above. Note that the level of ARNT and AR0NT2 was similar. E) The intensity of the shifted bands from several different EMSA experiments were quantified by computer densitometry as detailed in Materials and Methods. Results are plotted as the mean +/− SE of each shifted band with the samples containing preimmune IgG set to 100%. IG, samples incubated with preimmune IgG; A1, samples incubated with anti-ARNT IgG; A2, samples incubated with anti-ARNT2. Numbers on the bottom indicate the relative intensity compared to samples containing preimmune IgG. *, Statistically different from samples incubated with IgG; p<0.05.
To determine whether ARNT and ARNT2 had the potential to dimerize equally with the AHR, equal amounts of in vitro expressed ARNT and ARNT2 were incubated with a limiting concentration of AHR, activated with TCDD and evaluated by EMSA as in Figure 1A. The results are presented in Figure 1C. As in Figure 1A, it can be observed that there is a dramatic shift of the labeled XRE oligonucleotide when the mixture of AHR, ARNT and ARNT2 protein is incubated with TCDD (Figure 1C lane 2). Importantly, when specific IgG against ARNT or ARNT2 was added to the TCDD-activated samples, there was a supershift of approximately half of the complex (Figure 1C lanes 3 and 4). The relative intensity of the shift in the presence of the ARNT IgG (A1), ARNT2 IgG (A2) or preimmune IgG (IG) was determined by densitometry as detailed in Materials and Methods and the results of three different experiments is presented in Figure 1E. It can be observed that approximately 50% of the shifted band is lost in the presence of IgG against ARNT or ARNT2 when compared to the samples incubated with preimmune IgG. Thus, since all the samples in the experiment were aliquoted from a stock mixture that contained the same level of ARNT and ARNT2 protein (Figure 1D), and the amount of AHR was limiting, the results suggest that in the presence of TCDD, ARNT and ARNT2 form the same number of AHR•ARNT and AHR•ARNT2 complexes.
To confirm that an equal number of AHR•ARNT and AHR•ARNT2 complexes could be formed when equal levels of the proteins were incubated with TCDD-activated AHR, the in vitro activation experiment described above was repeated but instead of carrying out an EMSA, equal amounts of sample were immunoprecipitated with AHR or preimmune IgG. A representative experiment is presented in Figure 2. The results indicate that the same amount of AHR is precipitated from samples that are activated with TCDD or DMSO (Figure 2 lanes 3, 5). However, ARNT and ARNT2 proteins are only brought down in the samples in which the AHR was activated with TCDD (Figure 2, compare lanes 3 and 5). Importantly, the level of ARNT and ARNT2 protein brought down in the presence of TCDD was equal (Figure 3, lane 5). Therefore, these studies confirm that when equal amounts of ARNT and ARNT2 protein are mixed with the AHR in the presence of TCDD in vitro, an equal number of ARNT•AHR and ARNT2•AHR complexes will be formed.
Figure 2. Association of ARNT and ARNT2 with AHR.
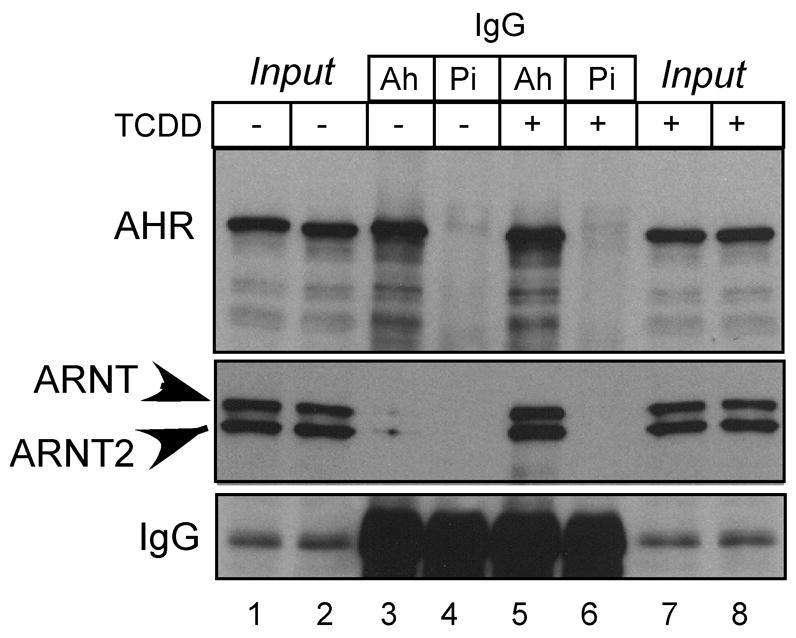
In vitro expressed AHR, ARNT, and ARNT2 were combined into a stock sample and then equally split and incubated in the presence of DMSO (0.5%) or TCDD (100 nM) for 2 h at 30°C. Equal amounts of each sample were then incubated with 1 μg anti-AHR IgG (Ah) or pre-immune IgG (Pi) for 1 hr at 4°C. The samples were then precipitated with protein A/G agarose beads, washed with TTBS and the boiled in the presence of 1x gel sample buffer. Equal amounts of sample were resolved by SDS-PAGE, blotted and stained with either anti-V5 IgG (1:500) or anti-AHR IgG (1ug/ml) and visualized by ECL with GAM-HRP IgG (1:10,000; V5) or GAR-HRP IG (1:10,000; AH). The precipitated IgG band (lanes 3–6) is shown to demonstrate the uniformity of the precipitation across all samples.
Figure 3. Effect of ARNT2 concentration on the formation of AHR•ARNT complexes.
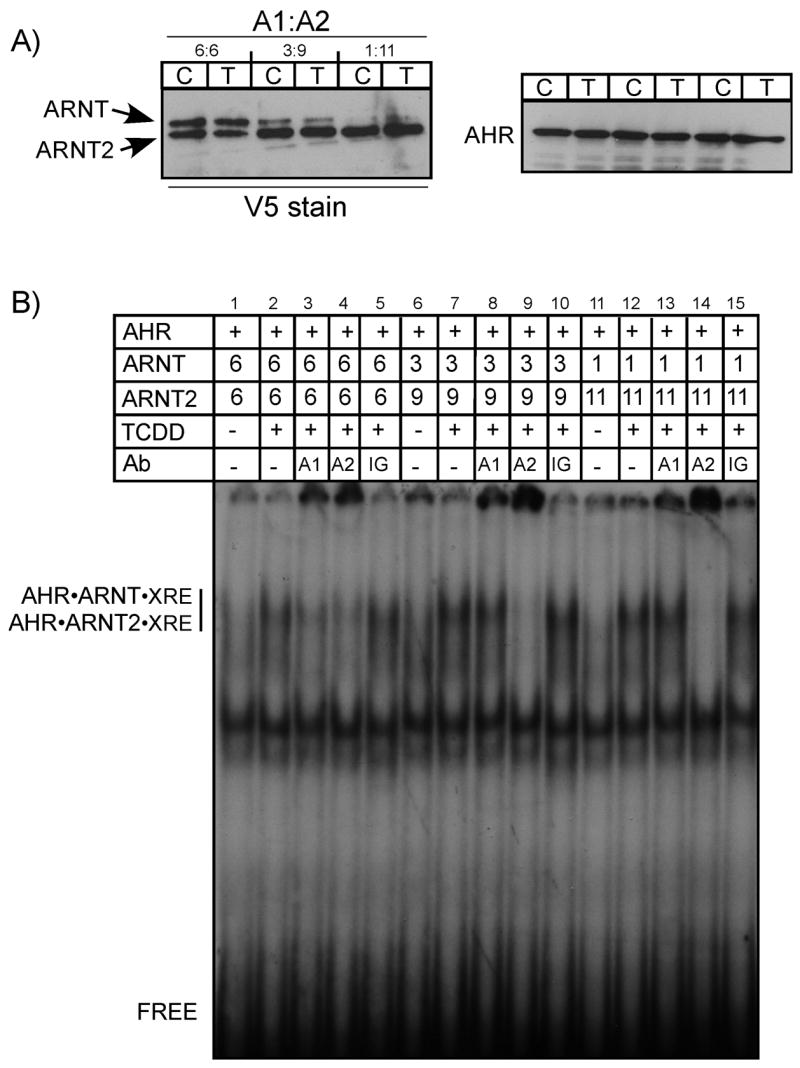
In vitro expressed AHR was combined with the indicated ratios of ARNT and ARNT2, the samples equally split and incubated in the presence of DMSO (0.5%) or TCDD (100 nM) for 2 h at 30°C. A) Aliquots of the activated reactions were denatured and evaluated for ARNT, ARNT2 or AHR protein by Western analysis using either anti-V5 IgG (1:500) or A-1A (1ug/ml) and visualized by ECL with GAM-HRP IgG (1:10,000; V5) or GAR-HRP IG (1:10,000; AHR). B) The exact samples visualized in A were mixed with 32P-labeled XRE oligonucleotides and protein•DNA complexes resolved as detailed in Materials and Methods. In some samples, 50ng of IgG specific to ARNT (A1), ARNT2 (A2), or preimmune IgG (IG) were included in the binding reaction prior to loading on the gel (lanes 11–14). The location of the specific AHR•ARNT•XRE and AHR•ARNT2•XRE complex and free XRE are indicated. Numbers indicate the relative level of ARNT or ARNT2 that were used in the activation reaction.
The results presented in Figures 1 and 2 indicated that ARNT2 expressed in vitro is able to heterodimerize with the AHR and form DNA binding complexes to the same level as ARNT. Therefore, it was pertinent to investigate the effect that increasing concentrations of ARNT2 would have on the dimerization of ARNT and the AHR. Therefore, ARNT and ARNT2 were synthesized in vitro and mixed with the AHR so that the ratio of ARNT2/ARNT was 1:1, 3:1 or 11:1. The total amount of ARNT + ARNT2 protein that was utilized in the experiment was held constant and only the ratio of the two proteins was varied. Figure 3A shows the level of ARNT, ARNT2 and AHR utilized in the study. Samples were activated with TCDD and analyzed by EMSA as detailed for Figure 1. As expected, ARNT•AHR heterodimers were detected in the presence of TCDD and the level of AHR•ARNT and AHR•ARNT2 complexes that were formed were equal at a 1:1 ratio (Figure 3B lanes 3–4). However, as the ratio of ARNT2:ARNT was increased, the shifted XRE complex was formed of predominantly AHR•ARNT2 dimers (Figure 3B lanes 8–9 and 13–14). Thus, these results confirm that ARNT2 synthesized in vitro associates with the AHR in a ligand-dependent manner and is capable of out-competing ARNT for AHR dimerization when expressed in excess of ARNT.
Effect of protein concentration on ARNT and ARNT2 association with DNA
The finding that ARNT2 dimerizes with the AHR in vitro is consistent with previous findings (Hirose et al., 1996). However, recent studies have suggested that the 1996 findings may not be physiological due to the level of ARNT2 used in the studies (Sekine et al., 2006). Therefore, it was important to assess whether ARNT or ARNT2 dimerization with the AHR and subsequent DNA binding would be altered when the levels of ARNT and ARNT2 proteins were reduced in the assay. For these studies, the level of AHR was held constant while ARNT and ARNT2 levels were reduced to the lowest level that could be detected by the V5 antibody. The samples were then subject to the in vitro activation and EMSA assay as detailed previously. A representative experiment is presented in Figure 4. The Western blot at the top of the figure shows that the level of AHR is constant in each sample, while the level of ARNT and ARNT2 is varied. Regardless of the level of ARNT or ARNT2 protein in the sample, a ligand dependent shift can be observed. To obtain quantitative data for the experiment, the level of ARNT or ARNT2 proteins as well as the intensity of EMSA shifts were evaluated by densitometry as detailed in Materials and Methods. The results are presented in Figure 4B and show that at each dilution, the level of ARNT and ARNT2 protein as well as the intensity of the gel shift is essentially equal. Based on previous studies of the level of target protein that can be produced in vitro (Pollenz et al., 1994), it is estimated that at the lowest dilutions used in this experiment, the ratio of AHR to that of ARNT or ARNT2 was approximately 3:1. This type of ratio is consistent with the physiological levels of AHR and ARNT found in numerous cell culture lines (Holmes and Pollenz, 1997), and show that both ARNT and ARNT2 function in identical manners when proteins levels are reduced.
Figure 4. Effect of target protein concentration on the formation of AHR•ARNT and AHR•ARNT2 heterodimers.
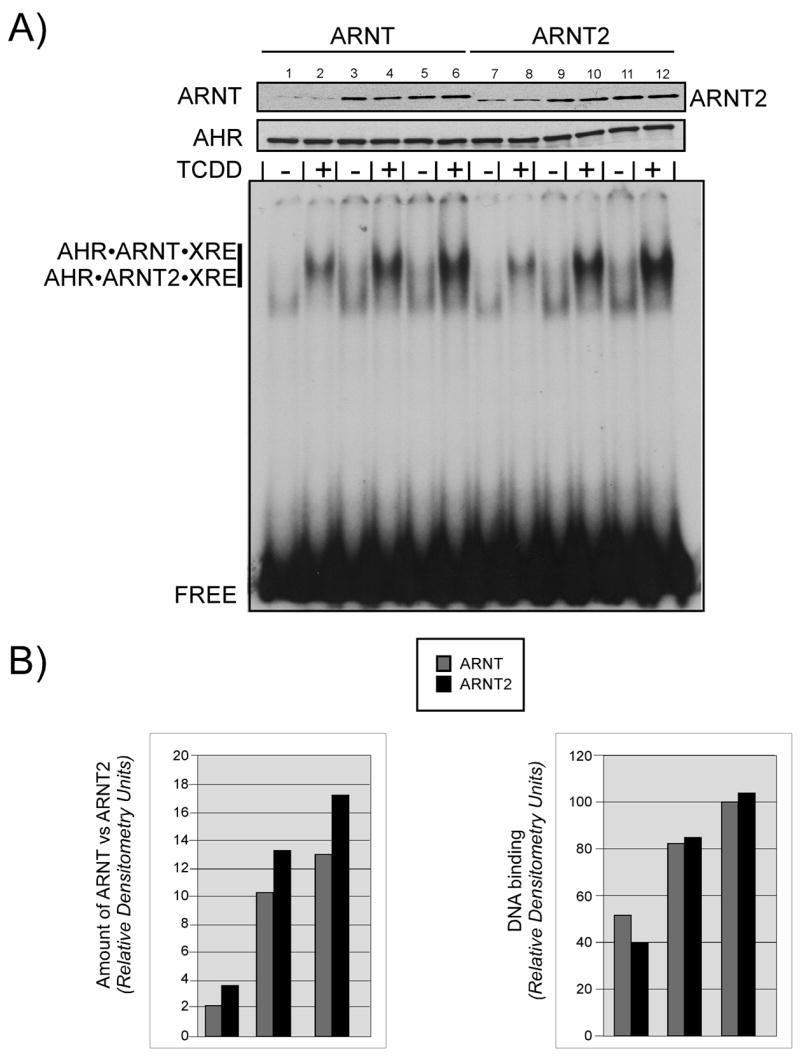
In vitro expressed AHR was mixed with increasing concentrations of ARNT or ARNT2, the samples equally split and incubated in the presence of DMSO (0.5%) or TCDD (100 nM) for 2 h at 30°C. A) A portion of the activated samples were denatured and evaluated for ARNT and ARNT2 or AHR expression by Western analysis using anti-V5 IgG (1:500) or anti-AHR IgG (1ug/ml), respectively. Reactive bands were visualized using GAM-HRP IgG (1:10,000) and ECL. The remaining samples were mixed with 32P-labeled XRE oligonucleotides and protein•DNA complexes resolved as detailed in Materials and Methods. The location of the specific AHR•ARNT•XRE and AHR•ARNT2•XRE complex and free XRE are indicated. B) The relative level of ARNT and ARNT2 protein was determined using computer densitometry of the bands shown in the Western blot of A. The relative intensity of the shifted bands from the EMSA in A was determined using computer densitometry.
Effect of different activating ligands on ARNT and ARNT2 association with DNA
The recent study of Sekine et al. (2006) hypothesizes that ARNT2 does not function in AHR-mediated signaling due to lack of dimerization of the two proteins in vitro and in vivo. Since these results are in direct contrast to those of Hirose et al., (1996) as well as the results presented in Figures 1–4 of the current report, it was important to identify possible differences in how the studies were performed. Aside from using different N-terminal peptide tags to identify the ARNT and ARNT2 proteins, the most significant difference between the current and previous studies was the ligand utilized to activate the AHR in vitro and in vivo. In both of the previous studies (Hirose et al., 1996; Sekine et al., 2006), the activating ligand used by the investigators was the low affinity compound 3-methylcholanthrene (3MC) and not TCDD. Since there is little information pertaining to the molecular structure of an AHR•ARNT complex in the presence of different ligands, studies were initiated to assess whether activation of the AHR with halogenated aromatic hydrocarbons (typified by TCDD) or polyaromatic hydrocarbons (typified by 3MC and benzo[a]pyrene; BAP) would result in differential formation of AHR•ARNT and AHR•ARNT2 complexes.
To examine this possibility, aliquots of AHR and ARNT or AHR and ARNT2 were taken from the same pool and activated in vitro using either TCDD or 3MC and then subjected to EMSA. As shown previously, activation of the samples with TCDD resulted in an equal shift whether ARNT or ARNT2 was the dimerization partner for the AHR (Figure 5A lanes 3–4). However, when identical samples were activated with 3MC, there was a significant reduction in the level of shift produced by the AHR•ARNT2 complex compared to AHR•ARNT (Figure 5A lanes 5–6). The relative intensity of the shift in the presence of TCDD or 3MC was determined by densitometry as detailed in Materials and Methods and the results of three different experiments are presented in Figure 5B. The intensity of the shift produced when AHR and ARNT2 were activated with 3MC was consistently 1.6-fold lower than that of samples activated with TCDD. Importantly, increasing the concentration of 3MC in the activation mixture did not change the results.
Figure 5. Effect of 3MC on the DNA binding of AHR· ARNT and AHR · ARNT2 complexes.
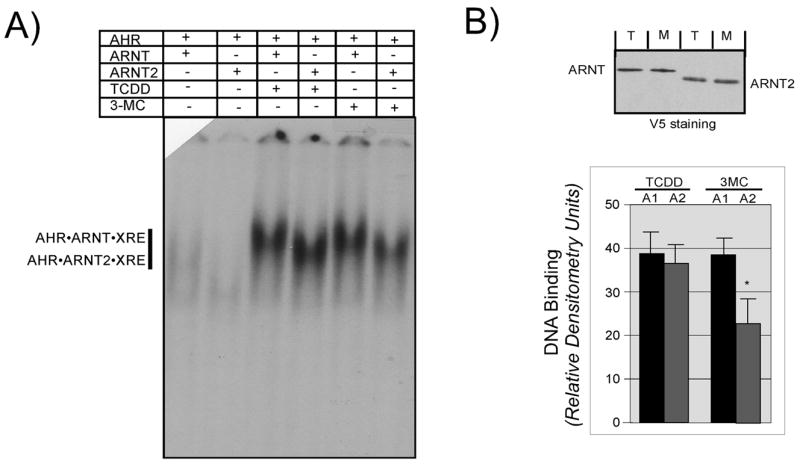
A) In vitro expressed AHR was combined with either ARNT or ARNT2 into a stock sample and then aliquoted and incubated in the presence of DMSO (0.5%), TCDD (100 nM) or 3-MC (54uM) for 2 h at 30°C. Aliquots from the stock samples were mixed with 32P-labeled XRE oligonucleotides and protein•DNA complexes resolved as detailed in Materials and Methods. The location of the specific AHR•ARNT•XRE and AHR•ARNT2•XRE complexes are indicated. Free XRE was run off the bottom of the gel so that the difference in migration of the complexes could be observed. B) Aliquots of the activation reactions utilized in A were denatured and evaluated for ARNT and ARNT2 protein by Western analysis using anti-V5 IgG (1:500) and visualized by ECL with GAM-HRP IgG (1:10,000). Note that the concentration of both V5-ARNT and V5-ARNT2 in each sample is similar. T, samples activated with TCDD; M, samples activated with 3-MC. The intensity of the shifted bands from several different EMSA experiments were quantified by computer densitometry as detailed in Materials and Methods. Results are plotted as the mean +/− SE of the 3-MC or TCDD activated samples. *, statistically different from the ARNT sample activated with 3-MC; p<0.05.
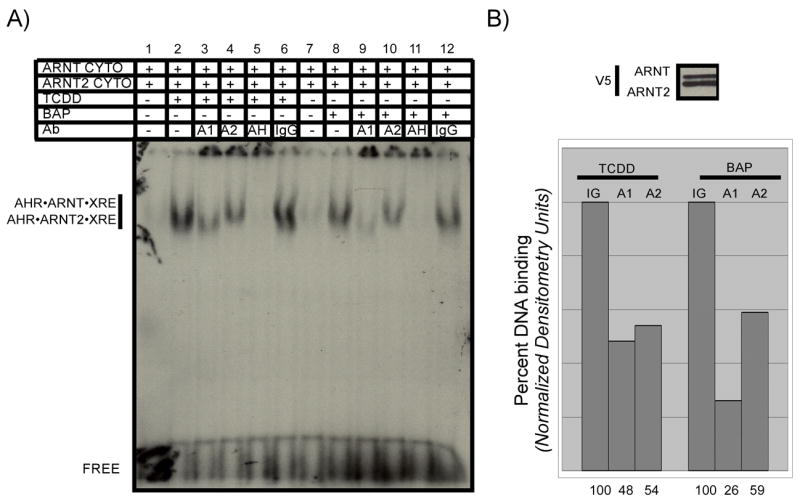
To examine the previous findings in more detail, equal amounts of ARNT or ARNT2 were incubated in the presence of limiting AHR, activated in vitro using either TCDD, 3MC, or BAP and evaluated by EMSA as previously described. A representative study is presented in Figure 6. Consistent with the results presented in Figure 1, activation with TCDD resulted in a strong shift that was supershifted equally with IgG specific to ARNT or ARNT2 (Figure 6A, lanes 3, 4). The equal concentration of ARNT and ARNT2 as well as the quantitative analysis of the proportion of the shifts in the presence of the different antibodies is shown in Figure 6B. However, when the identical mixtures of AHR and ARNT or AHR and ARNT2 proteins were activated with 3MC, there was a greater proportion of AHR•ARNT•XRE complexes when compared to AHR•ARNT2•XRE (Figure 6A, lanes 9, 10). Indeed, the ratio of AHR•ARNT•XRE to AHR•ARNT2•XRE was approximately 2:1 (Figure 6B). To confirm that the results obtained with 3MC were not exclusive to that compound, the experiments were repeated utilizing BAP as the AHR ligand. It can be observed that activation of an identical mixture of AHR, ARNT and ARNT2 with either TCDD or BAP results in a strong shift of near equal intensity (Figure 6C compare lanes 2 and 8). However, when IgG specific to ARNT or ARNT2 was included in the assay, the majority of the shift in the samples activated with BAP was supershifted with IgG specific to ARNT (Figure 6C, lanes 3–4), while the samples activated with TCDD were proportionally supershifted with IgG specific to either ARNT or ARNT2 (Figure 6C lanes 9–10). A Western blot of ARNT and ARNT2 concentration as well as the quantitative analysis of the proportion of the shifts in the presence of the different antibodies is shown in Figure 6D. Similar results were obtained when studies were repeated with the rat or mouse Ahb-2 allele of the AHR (RSP and ED, unpublished results). Collectively, these results suggest that when low affinity PAH compounds are utilized to activate the AHR in vitro, there is a significant reduction in the formation of AHR•ARNT2 dimers or their affinity for DNA that is distinct from AHR•ARNT dimers in this model system. Thus, the use of 3MC in the previous studies may partially explain the reduced level of interaction between AHR and ARNT2 (Sekine et al., 2006).
Figure 6. Effect of different ligands on the DNA binding of AHR•ARNT and AHR•ARNT2 complexes.

In vitro expressed AHR, ARNT, and ARNT2 were combined into a stock sample and then equally split and incubated in the presence of the specific ligands for 2 h at 30°C as detailed below. A) Samples were incubated with DMSO (0.5%), TCDD (100nM) or 3-MC (54uM) and then mixed with 32P-labeled XRE oligonucleotides and protein•DNA complexes resolved as detailed in Materials and Methods. In some samples, 50ng of IgG specific to ARNT (A1), ARNT2 (A2), AHR (AH) or preimmune IgG were included in the binding reaction prior to loading on the gel. The location of the specific AHR•ARNT•XRE and AHR•ARNT2•XRE complex and free XRE are indicated. B) An aliquot of the stock activation mixture utilized in A were denatured and evaluated for ARNT and ARNT2 expression by Western analysis. The Western blot was stained with anti-V5 IgG (1:500) and visualized by ECL with GAM-HRP IgG (1:10,000). The intensity of the shifted bands from the EMSA in A was quantified by computer densitometry as detailed in Materials and Methods. Results are plotted withthe samples containing preimmune IgG set to 100%. IG = samples incubated with preimmune IgG; A1 = samples incubated with anti-ARNT IgG; A2 = samples incubated with anti-ARNT2. Numbers on the bottom indicate the relative intensity compared to samples containing preimmune IgG. C) Samples were incubated with DMSO (0.5%), TCDD (100nM) or BAP (17uM) and EMSA performed as detailed in A. D) An aliquot of the stock activation mixture utilized in C were denatured and evaluated for ARNT and ARNT2 expression by Western analysis as indicated in B. The intensity of the shifted bands from the EMSA in C was quantified by computer densitometry as detailed in Materials and Methods. Results are plotted with the samples containing preimmune IgG set to 100%. IG, samples incubated with preimmune IgG; A1, samples incubated with anti-ARNT IgG; A2, samples incubated with anti-ARNT2. Numbers on the bottom indicate the relative intensity compared to samples containing preimmune IgG.b.
Analysis of ARNT or ARNT2 protein expressed in cell culture
ARNT and the AHR have been shown to be post-translationally modified in vivo (Kewley and Whitelaw, 2005). Therefore, it is possible that post-translational modifications could affect ARNT dimerization or DNA binding status and produce results that would be distinct from those using protein that had been translated in vitro. In order to compare the function of ARNT and ARNT2 expressed in cell culture to the results presented in Figures 1–6, expression vectors for ARNT or ARNT2 were transfected into the Hepa-1 variant that has reduced ARNT expression (LA-II cells), so that the ability of ARNT2 to compensate for the reduced expression of ARNT could be directly measured in the same genetic background. Since the majority of the nuclear ARNT is not tightly associated with nuclear structures, the protein can be quantitatively isolated in cytosolic lysates once cells are disrupted (Pollenz et al., 1994). Cytosolic samples containing equal concentrations of ARNT and ARNT2 protein expressed in the LA-II cells were activated by TCDD or BAP and evaluated by EMSA as detailed previously. Similar to what was shown for the in vitro translated proteins, activation of the samples with either TCDD or BAP produced a specific shift that was not present in samples that were incubated with DMSO (Figure 7A). However, as observed with the in vitro translated proteins in Figure 6, activation of the sample with BAP resulted in a lower percentage of AHR•ARNT2 complexes that were associated with the XRE in comparison to the samples activated with TCDD. (Figure 7A, compare lanes 3, 4 to lanes 9, 10). This trend was consistent over several experiments and the quantified results are presented in Figure 7B. Thus, ARNT and ARNT2 expressed under physiological conditions in LA-II cells are capable of associating with endogenous AHR and binding XREs in a ligand dependent manner. This finding suggests that any post-translational modifications that would affect the AHR, ARNT or ARNT2 do not alter the ability of the proteins to associate or bind XREs when evaluated by the in vitro activation assay. However, it is also possible that post-translational modifications may not occur properly in proteins overexpressed from transiently transfected cDNAs.
Figure 7. DNA binding of ARNT and ARNT2 expressed in cell culture.
Expression vectors fro ARNT and ARNT2 were transfected in LA-II cells and cytosol produced as detailed in Materials and Methods. A) Stock mixtures containing equal levels of ARNT and ARNT2 protein were incubated with DMSO (0.5%), TCDD (100nM) or BAP (17uM) for 2 h at 30°C. Samples were aliquoted and mixed with 32P-labeled XRE oligonucleotides and protein•DNA complexes resolved as detailed in Materials and Methods. In some samples, 50ng of IgG specific to ARNT (A1), ARNT2 (A2), AHR (AH) or preimmune IgG were included in the binding reaction prior to loading on the gel. The location of the specific AHR•ARNT•XRE and AHR•ARNT2•XRE complex and free XRE are indicated. B) An aliquot of the stock activation mixture utilized in A were denatured and evaluated for ARNT and ARNT2 expression by Western analysis. The Western blot was stained with anti-V5 IgG (1:500) and visualized by ECL with GAM-HRP IgG (1:10,000). The intensity of the shifted bands from the EMSA in A was quantified by computer densitometry as detailed in Materials and Methods. Results are plotted with the samples containing preimmune IgG set to 100%. IG, samples incubated with preimmune IgG; A1, samples incubated with anti-ARNT IgG; A2, samples incubated with anti-ARNT2. Numbers on the bottom indicate the relative intensity compared to samples containing preimmune IgG.
Analysis of ARNT2 and ARNT2-H on AHR-mediated gene regulation in cell culture
The previous results demonstrate that both ARNT and ARNT2 are capable of dimerizing with the AHR in a ligand dependant manner and can associate with individual XREs in vitro. It was pertinent therefore, to functionally evaluate whether both proteins could restore AHR-mediated induction of the endogenous CYP1A1 gene in the LA-II cell line. For these studies, expression vectors for ARNT or ARNT2 were transfected into LA-II cells and the cells exposed to TCDD. Total cell lysates were then evaluated for the expression of ARNT and ARNT2 using the V5 epitope antibody as well for the expression of endogenous CYP1A1 protein. The results in Figure 8A show that the overall level of ARNT and ARNT2 expression in the LA-II cells was consistent. However, the TCDD-dependent induction of CYP1A1 protein was only detected in the cells expressing ARNT. To confirm that the results presented in Figure 8A were not due to differences in the transfection efficiency or level of ARNT expression, identical experiments were repeated and the cells fixed and evaluated by indirect immunoflourescence microscopy. Figure 8B shows that while the LA-II cells were not transfected with a high level of efficiency, ARNT and ARNT2 showed similar levels of expression and were predominately localized to the nucleus (Figure 8B panels c and g). Importantly, when TCDD treated cells were stained for CYP1A1, only those cells transfected with ARNT cDNAs exhibited expression of CYP1A1 (Figure 8B compare panels d and e to h) confirming the results from the Western blotting studies.
Figure 8. Induction of CYP1A1 protein in cells expressing ARNT or ARNT2.
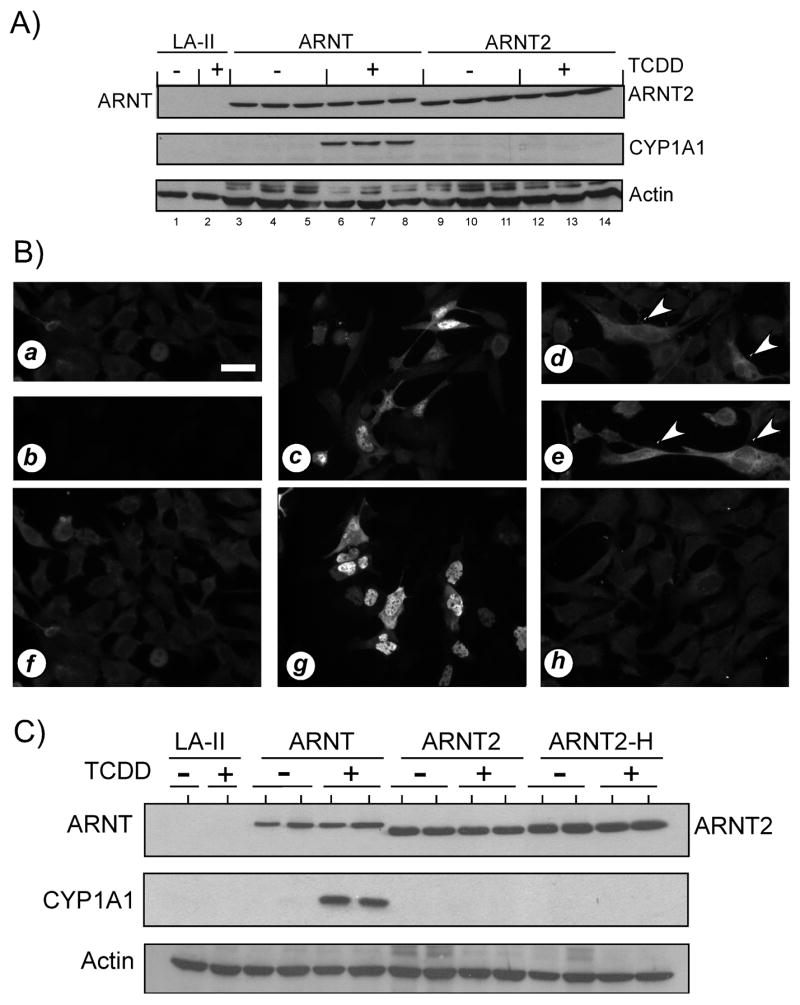
A) LA-II cells were transfected with the indicated expression constructs as detailed in Materials and Methods and treated with DMSO (0.5%) or TCDD (2nM) for 6 hours at 37°C. Equal amounts of total cell lysates from triplicate plates were resolved by SDS-PAGE, blotted and stained with anti-V5 IgG (1:500), anti-CYP1A1 (1:200) as well as anti-β-actin (1:1000). Reactivity was visualized by ECL with GAR-HRP (1:10,000) or GAM-HRP (1:10,000). Each lane represents and independent sample. LA-II = parental cells transfected with naked vector. B) LA-II cells were propagated on glass coverslips and transfected and treated as detailed in A. Fixed slips were stained with anti-ARNT IgG (0.5μg/ml), anti-ARNT2 IgG (0.5μg/ml), or anti-CYP1A1 (1:100) and reactivity was visualized using GAR-RHO (1:400). All panels that were stained with the same antibodies were photographed for identical times. a) LA-II cells stained for ARNT. b) LA-II cells stained for ARNT2. c) LA-II cells transfected with ARNT and stained for ARNT. d–e) LA-II cells transfected with ARNT, treated with TCDD and stained for CYP1A1. Arrowheads indicate cells expressing cytoplasmic CYP1A1. f) LA-II cells treated with TCDD and stained for CYP1A1. g) LA-II cells transfected with ARNT2 and stained for ARNT2. h) LA-II cells transfected with ARNT2, treated with TCDD and stained for CYP1A1. Note: LA-II cells transfected with either ARNT or ARNT2, treated with DMSO, and stained for CYP1A1 showed staining similar to that presented in panels f and h. C) LA-II cells were transfected with the indicated expression constructs as detailed in Materials and Methods and treated with DMSO (0.5%) or TCDD (2nM) for 6 hours at 37°C. Equal amounts of total cell lysates from triplicate plates were resolved by SDS-PAGE, blotted and stained with anti-V5 IgG (1:500), anti-CYP1A1 (1:200) as well as anti-β-actin (1:1000). Reactivity was visualized by ECL using GAR-HRP (1:10,000) or GAM-HRP (1:10,000). Each lane represents and independent sample. LA-II, parental cells transfected with naked vector.
Since the reduced level of ARNT2 function was not consistent with the ability of ARNT2 to dimerize with the AHR in vitro, mutagenesis was utilized to change the proline at amino acid 352 to a histidine in the V5-tagged ARNT2 cDNA (ARNT2-H). This was carried out due to a recent report that has suggested that ARNT2 does not function in AHR signaling in vivo due to the presence of a proline at amino acid 352 within the PAS B domain (ARNT has a histidine at the same position. Sekine et al., 2006). However, this hypothesis has not been examined directly. Studies were designed to assess the ability of ARNT2-H to restore AHR-mediated induction of the endogenous CYP1A1 gene in the LA-II cell line as detailed for ARNT2 above. The results in Figure 8C show that ARNT, ARNT2 and ARNT2-H were expressed to similar levels in the LA-II cells, but as before, only cells expressing ARNT were capable of inducing endogenous CYP1A1. In addition, immunofluorescence microscopy confirmed that all proteins were expressed in the nucleus and only cells expressing ARNT expressed CYP1A1 protein (ED, RSP results not shown). Thus, these studies show that ARNT2 does not appear to function to the same level of ARNT in the induction of the endogenous CYP1A1 gene in cell culture and the lack of function is not due to the presence of a proline at amino acid 352.
Since ARNT2 exhibited minimal ability to restore AHR-mediated induction of CYP1A1 in the LA-II cells, it was of interest to determine whether ARNT2 expression would impact the ability of ARNT to function when both proteins were co-expressed. Thus, wild type Hepa-1 cells (WT) that endogenously express ARNT, but have no detectable expression of ARNT2, were transfected with ARNT2 expression vectors or naked vector and treated with TCDD for 6 hrs. Total cells lysates were prepared and evaluated for the level of endogenous CYP1A1 protein. The results in Figure 9A show that WT cells expressing ARNT2 exhibited a reduction of approximately 30% in the level of endogenous CYP1A1 protein when compared to cells that did not express ARNT2. Importantly, a reduction in CYP1A1 was not seen when WT cells were similarly transfected with ARNT (ED and RSP, unpublished results). Figure 9B shows the analysis of ARNT, ARNT2 and CYP1A1 expression in the transfected cells by immunofluorescence microscopy. As with the LA-II studies, the transfection efficiency was <50%, and this may account for the moderate level of CYP1A1 reduction observed in the cells expressing ARNT2. Importantly, the expression of ARNT2 in the WT cells did not appear to impact the expression of AHR or ARNT.
Figure 9. Impact of ARNT2 expression on AHR-mediated signaling in cell culture.

A) Hepa-1 cells were transfected with naked vector (−) or ARNT2 expression vectors (+) and treated with DMSO (0.05%) or TCDD (2nM) for 6 h at 37°C. Equal amounts of total cell lysates were resolved by SDS-PAGE, blotted and stained with either anti AHR IgG(1ug/ml), anti-ARNT2 IgG (1ug/ml), anti-CYP1A1 IgG (1:200), or anti-β-actin IgG (1:1000). Reactivity was visualized by ECL with GAR-HRP (1:10,000). Each lane represents and independent sample. CYP1A1 protein expression was quantified by computer densitometry and normalized to β-actin controls. Results represent the mean +/- SE of three independent samples. *, Statistically different from TCDD treated cells that were not transfected with ARNT2; p<0.05. B) Hepa-1 cells were propagated on glass coverslips and transfected and treated as detailed in A. Fixed slips were stained with anti-ARNT IgG (0.5μg/ml; A1), anti-ARNT2 IgG (0.5μg/ml; A2), or anti-CYP1A1 (1:100) and reactivity was visualized using GAR-RHO (1:400). All panels that were stained with the same antibodies were photographed for identical times. WT, cells transfected with naked vector. WT + A2, cells transfected with ARNT2 vector. C) Hepa-1 cells were transfected with naked vector or ARNT2 expression vectors and treated with DMSO (0.05%) or TCDD (2nM) for 6 h at 37°C. Nuclear extracts were prepared as detailed in Materials and Methods, combined with 2X gel sample buffer and resolved by SDS-PAGE. Blots and stained with anti-AHR IgG (1.0μg/ml), anti-ARNT IgG(1.0μg/ml), or anti-ARNT2 IgG (1.0μg/ml). Reactivity was visualized by ECL with GAR-HRP (1:10,000). D) 15ug of the indicated nuclear extracts were subject to EMSA as detailed in Materials and Methods. In the indicated samples, 50 ng of anti-ARNT IgG (A1), anti-ARNT2 IgG (A2), anti-AHR IgG (AH), or pre-immune IgG (IG) were added to nuclear extracts during the incubation with 32P-labeled XRE. The location of the specific AHR•ARNT•XRE and AHR•ARNT2•XRE complex is indicated.
To gain further insight into the mechanism whereby ARNT2 was reducing AHR-mediated signaling, ARNT2 was expressed in the WT Hepa-1 cells and nuclear extracts prepared and evaluated by Western blotting and EMSA. As expected, TCDD treatment resulted in a dramatic increase in the level of both AHR and ARNT protein in nuclear extracts (Figure 9C). However, there was not a significant reduction in the level of AHR or ARNT protein in the extracts when ARNT2 was expressed in the cells. In fact, ARNT2 appeared to be associated with nuclear structures in the absence of TCDD treatment and was not increased in the presence of TCDD. When the identical nuclear extracts were evaluated for binding to XRE oligonucleotides in the EMSA assay, there was no apparent difference in the intensity of the TCDD-dependent shift when ARNT2 was expressed in the cells (Figure 9D). Indeed, incubation of the samples with specific antibodies against ARNT2 failed to reduce the intensity of the gel shift as demonstrated in all the in vitro studies reported earlier. Due to the modest effect of ARNT2 expression on TCDD-mediated induction of CYP1A1 (Figure 9A, B), the inability to detect AHR•ARNT2 complexes may be related to the level of ARNT2 expression across the cell population and sensitivity of the assay. Alternatively, the negative regulation of AHR-mediated signaling by ARNT2 in this cell culture system may not involve the direct formation of AHR•ARNT2 complexes that associate with XRE sequences. Studies are currently underway to generate stable lines to better evaluate these possibilities.
ARNT2 is endogenously expressed in various murine tissues and cells
The previous studies suggest that ARNT2 has the potential to affect AHR-mediated signaling in a negative manner when expressed in cell culture. However, it is not known whether the conditions utilized for the various studies represent a truly physiological condition. For example, the ability of ARNT2 to impact AHR-mediated signaling and affect the function of AHR•ARNT2 complexes in vivo will be dependent on the co-expression of ARNT and ARNT2 in the same cells. However, it has generally been hypothesized that ARNT and ARNT2 are not expressed in the same cells at the protein level due to the limited tissue distribution of ARNT2 (Hirose et al., 1996). Importantly, a more recent study, has described mRNA for both ARNT and ARNT2 as being co-localized in many murine peripheral organs and neuronally derived tissue, suggesting that distribution of ARNT2 may not be as restricted as previously described (Aitola and Pelto-Huikko, 2003). In addition, studies of ARNT2 expression have generally examined mRNA for ARNT2 with no analysis of endogenous protein expression. In order to investigate possible interactions between ARNT and ARNT2 in a physiological setting, studies were carried out to determine the expression of ARNT and ARNT2 protein in various murine tissues and cell culture lines. In the first set of studies, whole tissue lysates from the brain, eye, heart, kidney, liver, lung, muscle, skin, spleen, and thymus were prepared as described in Materials and Methods and analyzed for ARNT and ARNT2 protein by Western blotting. Figure 10 shows that ARNT protein was detected in all the tissues evaluated while ARNT2 protein was detected in the brain, eye, and kidney, and was also detected at lower expression levels in the heart, spleen and thymus (Figure 10A). Since these results do not confirm that the ARNT and ARNT2 protein are localized to the same cells, several continuous cell lines were purchased from ATCC and the level of ARNT and ARNT2 protein evaluated by Western blotting. Figure 10B shows that ARNT and ARNT2 protein were co expressed in human pigmented retinal epithelial cells (ARPE-19), rat central nervous system cells (B35), and human, mouse and rat kidney cells (A498, TCMK, NRK, respectively). To gain insight into the ratio of ARNT and ARNT2 protein in these lines, ARNT and ARNT2 TNT reactions containing equal amounts of ARNT and ARNT2 protein (Figure 10C), were included in the experiment so that the staining with the specific ARNT and ARNT2 antibodies could be normalized. The quantified results are presented in Figure 10D. The ratio of ARNT:ARNT2 protein was variable among the different cells with the NRK-49F rat kidney cells showing a near equal ratio (1.3:1), and the A498 cells showing the lowest (7.2:1). Thus, these studies confirm that ARNT and ARNT2 can be co-expressed in the same cell and provide novel models for the future analysis of the physiological interactions of these proteins in AHR as well as other bHLH/PAS signaling pathways.
Figure 10. ARNT and ARNT2 protein expression in tissues and cells.
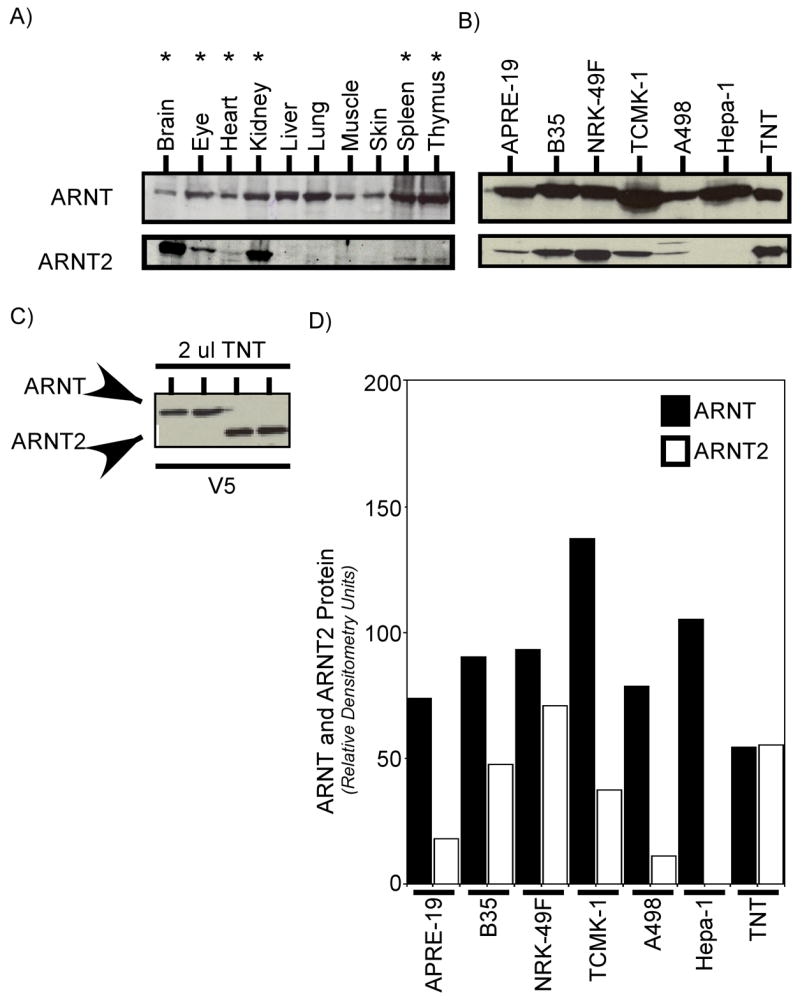
A) Total cell lysates were generated from a variety of adult C57BL/6 mouse tissues, resolved by SDS-PAGE, blotted and stained with anti-ARNT IgG (1.0μg/ml) or anti-ARNT2 IgG (1:500). Antibodies were tittered to react to the TNT samples with the same sensitivity. Reactivity was visualized by ECL with GAR-HRP (1:10,000). Tissues expressing both ARNT and ARNT2 proteins are noted by the asterisk. B) The indicated cell lines were purchased from ATCC, and cultured as detailed in Materials and Methods. Total cell lysates evaluated for expression of both ARNT and ARNT2 using RI and ARNT2 IgG that were titered to give the same level of reactivity to the TNT samples. ARPE-19 normal rat kidney; TCMK-1, mouse kidney; A498; human kidney adenocarcinoma; Hepa-1, mouse hepatoma; TNT, in vitro synthesized ARNT or ARNT2. C) The same level of TNT samples loaded in B was stained with anti-V5 IgG (1:500). Reactivity was visualized by ECL with GAM-HRP (1:10,000). D) ARNT and ARNT2 levels were determined by computer densitometry from the blots presented in B. Results are presented as relative densitometry units.
Discussion
The ARNT and ARNT2 proteins share > 95% amino acid identity in the bHLH domain and exhibit approximately 90% amino acid identity in the defined PAS A and PAS B domains (Hirose et al., 1996). These different domains are known to specify both protein-protein interaction and DNA binding of the various bHLH/PAS proteins (Pongratz et al., 1998; Reisz-Porszasz et al., 1994). Since the high levels of identity between the proteins in the dimerization domains would suggest that both proteins have the same potential to interact with common bHLH/PAS partners, it is striking that the knock-out of either ARNT and ARNT2 in the mouse produces different phenotypes (Kozak et al., 1997; Maltepe et al., 1997). Initial studies of the expression patterns of ARNT and ARNT2 mRNA in mouse suggested that ARNT2 had an expression pattern that was restricted to the kidneys and central nervous system that would limit the function of the ARNT2 protein (Hirose et al., 1996). However, recent studies show that while ARNT2 is expressed less ubiquitously than ARNT in the mouse, ARNT and ARNT2 mRNA can be detected in the same cells in many peripheral tissues and the two genes show a high level of overlap in expression in most organ systems during development (Aitola and Pelto-Huikko, 2003). Interestingly, ARNT2 has been demonstrated to be the predominant form of ARNT in several fishes including Fundulus heteroclitus and Danio rerio and more recently in the common cormorant, Phalacrocorax carbo (Lee et al., 2007; Powell et al., 1999; Tanguay et al., 2000). In addition, ARNT2 protein from Fundulus heteroclitus, Danio rerio and Xenopus laevis has been shown to associate with the liganded AHR and bind XREs when synthesized in vitro (Powell et al., 1999; Rowatt et al., 2003; Tanguay et al., 2000). Therefore, due to the limited functional analysis of the ARNT2 protein in mammalian model systems, it was pertinent to investigate whether ARNT and ARNT2 could interact with a common dimerization partner in vitro and in cell culture.
In the current studies, experiments were performed to assess the ability of ARNT or ARNT2 to associate with the AHR. In order to compare the ability of ARNT and ARNT2 to interact, it was imperative to be able to know that equal amounts of each protein were being evaluated. In all of the in vitro studies in which the AHR was activated with TCDD, ARNT2 showed no difference in its potential to form AHR complexes when compared to ARNT and was able to out-compete ARNT for binding to the AHR when ARNT2 was expressed in excess. An important aspect of these studies was that the ability of ARNT2 to associate with the AHR appeared to decrease (in comparison to ARNT) when the AHR was activated by ligands other than the high affinity ligand TCDD. Indeed, when low affinity non-halogenated polyaromatic hydrocarbons were used to activate the AHR in the in vitro assay in the presence of equal concentrations of ARNT, approximately two-thirds of the DNA bound complexes formed were AHR•ARNT. These findings were also observed when the in vitro assays were carried out with ARNT or ARNT2 protein expressed in cell culture lines that lacked either ARNT protein. This is an intriguing finding that suggests the AHR may have a slightly different conformation when bound with different ligands and implies that dimerization potential may be influenced by the species of ligand. The use of 3MC as an activating ligand may partially explain why recent studies suggest that ARNT2 does not interact with the AHR when expressed in culture (Sekine et al., 2006). However, there is little known about how the ligand binding domain impacts the structure of the HLH or PAS regions at the molecular level although homology modeling is currently being used to gain insight into this important question (Pandini et al., 2007).
Since the ARNT2 protein that was produced in vitro appeared to function equivalently to ARNT in the in vitro assays, it was important to assess whether ARNT2 could function in AHR-mediated signaling in a physiological model. For these studies, several different types of experiments were carried out, and the results were in dramatic contrast to those obtained in vitro. Expression of ARNT2 in the LA-II variant of the Hepa-1 cell line was unable to support TCDD-mediated induction of the endogenous CYP1A1 gene and actually could partially inhibit the positive function of ARNT in AHR-mediated signaling. The ability of ARNT isoforms to function as dominant negative regulators of AHR-mediated signaling has previously been reported for the ARNTa splice variant expressed in rainbow trout and zebrafish (Necela and Pollenz, 2001; Pollenz et al., 1996). In the case of the rainbow trout ARNTa, negative function is manifested by dimerization with the AHR but lack of binding to XRE enhancers. A similar mechanism may explain the current results with ARNT2, as Western blotting and EMSA studies failed to detect AHR•ARNT2 complexes in nuclear extracts of Hepa-1 cells expressing ARNT2 protein. Thus, ARNT2 expressed in culture appears to lose the ability to form AHR complexes capable of associating with DNA as evidenced by the lack of accumulation in nuclear lysates of TCDD treated cells. These results are consistent with studies that have evaluated the function of ARNT2 in zebrafish. In these studies, ithas been shown that although ARNT2 is the predominate ARNT protein in aquatic species and can associate with AHR and bind DNA in vitro, knockdown of ARNT2 levels using antisense morpholino oligonucleotides in vivo does not reduce AHR-mediated signaling in this organism (Prasch et al., 2004). In contrast, reducing AHR or ARNT in zebrafish completely abolishes the effects of TCDD on the development of embryos indicating that zfARNT2 cannot compensate for the loss of ARNT in vivo (Prasch et al., 2006).
The mechanism that underlies the lack of ARNT2 function in AHR-mediated signaling in vivo is currently undefined. However, Sekine et al., (2006) have hypothesized that ARNT2 does not dimerize with the AHR in vivo because it contains a proline and not a histidine residue at amino acid 352 within the PAS B domain. This hypothesis is based on studies in which the histidine at amino acid 378 in the PAS B region of ARNT was mutated to a proline that caused ARNT to have reduced ability to function in AHR-mediated signaling. However, the studies did not directly evaluate the role of the P352 in ARNT2 function by converting it a histidine and producing a protein capable of functioning in AHR-mediated signaling. The PAS B domain has been implicated in contributing to the heterodimerization potential and stability of ARNT and HIF-1a/HIF-2a through interactions occurring via the PAS B central B-sheet, and mutations in this region have been suggested to affect the transcriptional ability of the overall heterodimer (Card et al., 2005; Erbel et al., 2003). Importantly, mutation of P352 to histidine in the mouse ARNT2 did not cause the protein to function like ARNT in AHR-mediated signaling when transfected into LA-II cells (Figure 8C). This may be due to the observation that the PAS A domain is also critical for DNA binding and protein-protein interactions and contributes directly to AHR•ARNT XRE binding (Chapman-Smith et al., 2004; Pongratz et al., 1998). Thus, the findings that i) ARNT2 containing the P352 can dimerize and form functional complexes with the AHR in vitro and ii) ARNT2-H does not restore ARNT-like function in cells, indicate that the reduced function of ARNT2 in vivo is unlikely to be solely related to P352 residue and, instead, is likely to involve regulatory mechanisms that are impacting the interaction of ARNT2 with the AHR. Such a mechanism could involve i) the interaction with tissue specific proteins yet to be defined that are not found in cytosolic fractions used in the in vitro activation assay, ii) the formation of ARNT2 homodimers that limit the pool of ARNT2 that is available, iii) the formation of a non-functional AHR•ARNT2 complex, iv) differences in the compartmentalization of ARNT2 that limit is access to the AHR, or v) heterodimerization of ARNT2 with ARNT that could also limit is access to the AHR. The ability to now have model cell culture lines that for the first time show the co-expression of ARNT and ARNT2 in the same cell will be key systems to further define the function and interaction of these proteins across different signaling pathways.
Acknowledgments
This work was supported by a grant from the National Institutes of Health to RSP (ES 10991). We thank Dr. T. Zacharewski for providing the mouse tissue samples.
Abbreviations
- AHR
aryl hydrocarbon receptor
- bHLH
basic helix-loop-helix
- PAS
PER/ARNT/SIM
- ARNT
aryl hydrocarbon receptor nuclear translocator
- ARNT2
aryl hydrocarbon nuclear translocator isoform 2
- TCDD
2,3,7,8-tetrachlorodibenzo-p-dioxin
- BAP
benzo[a]pyrene
- 3MC
3-methylcholanthrene
- Me2SO
dimethyl sulfoxide
- PBS
phosphate-buffered saline
- TTBS
Tris buffered saline with Tween 20
- PAGE
polyacrylamide electrophoresis
- ECL
enhanced chemiluminescence
- EMSA
electrophoretic mobility shift assay
- XRE
xenobiotic response element
- DMEM
Dulbecco’s modified Eagle’s medium
- WT
wild-type
- SIM
single-minded protein
- HIF
hypoxia-inducible factor
- IP
immunoprecipitation
- Pi
Pre-immune
- GAR-HRP
goat-anti-rabbit IgG conjugated to hydrogen peroxidase
- GAM-HRP
goat-anti-mouse IgG conjugated to hydrogen peroxidase
- GAR-RHO
goat-anti-rabbit IgG conjugated to hydrogen rhodamine
References
- Abbott BD, Birnbaum LS, Perdew GH. Developmental expression of two members of a new class of transcription factors: I. Expression of aryl hydrocarbon receptor in the C57BL/6N mouse embryo. Dev Dyn. 1995;204(2):133–43. doi: 10.1002/aja.1002040204. [DOI] [PubMed] [Google Scholar]
- Aitola MH, Pelto-Huikko MT. Expression of Arnt and Arnt2 mRNA in developing murine tissues. J Histochem Cytochem. 2003;51(1):41–54. doi: 10.1177/002215540305100106. [DOI] [PubMed] [Google Scholar]
- Antonsson C, Arulampalam V, Whitelaw ML, Pettersson S, Poellinger L. Constitutive function of the basic helix-loop-helix/PAS factor Arnt. Regulation of target promoters via the E box motif. J Biol Chem. 1995;270(23):13968–13972. doi: 10.1074/jbc.270.23.13968. [DOI] [PubMed] [Google Scholar]
- Baba T, Mimura J, Gradin K, Kuroiwa A, Watanabe T, Matsuda Y, Inazawa J, Sogawa K, Fujii-Kuriyama Y. Structure and expression of the Ah receptor repressor gene. J Biol Chem. 2001;276(35):33101–33110. doi: 10.1074/jbc.M011497200. [DOI] [PubMed] [Google Scholar]
- Card PB, Erbel PJ, Gardner KH. Structural basis of ARNT PAS-B dimerization: use of a common beta-sheet interface for hetero- and homodimerization. J Mol Biol. 2005;353(3):664–677. doi: 10.1016/j.jmb.2005.08.043. [DOI] [PubMed] [Google Scholar]
- Chapman-Smith A, Lutwyche JK, Whitelaw ML. Contribution of the Per/Arnt/Sim (PAS) domains to DNA binding by the basic helix-loop-helix PAS transcriptional regulators. J Biol Chem. 2004;279(7):5353–5362. doi: 10.1074/jbc.M310041200. [DOI] [PubMed] [Google Scholar]
- Dougherty EJ, Pollenz RS. Functional analysis of ARNT2 in Ah receptor mediated signal transduction. [775] The Toxicologist CD — An official Journal of the Society of Toxicology. 2006;90 Number S-1. [Google Scholar]
- Erbel PJ, Card PB, Karakuzu O, Bruick RK, Gardner KH. Structural basis for PAS domain heterodimerization in the basic helix--loop--helix-PAS transcription factor hypoxia-inducible factor. Proc Natl Acad Sci U S A. 2003;100(26):15504–15509. doi: 10.1073/pnas.2533374100. [DOI] [PMC free article] [PubMed] [Google Scholar]
- Hirose K, Morita M, Ema M, Mimura J, Hamada H, Fujii H, Saijo Y, Gotoh O, Sogawa K, Fujii-Kuriyama Y. cDNA cloning and tissue-specific expression of a novel basic helix-loop-helix/PAS factor (Arnt2) with close sequence similarity to the aryl hydrocarbon receptor nuclear translocator (Arnt) Mol Cell Biol. 1996;16(4):1706–1713. doi: 10.1128/mcb.16.4.1706. [DOI] [PMC free article] [PubMed] [Google Scholar]
- Holmes JL, Pollenz RS. Determination of aryl hydrocarbon receptor nuclear translocator protein concentration and subcellular localization in hepatic and nonhepatic cell culture lines: development of quantitative Western blotting protocols for calculation of aryl hydrocarbon receptor and aryl hydrocarbon receptor nuclear translocator protein in total cell lysates. Mol Pharmacol. 1997;52(2):202–211. doi: 10.1124/mol.52.2.202. [DOI] [PubMed] [Google Scholar]
- Hosoya T, Oda Y, Takahashi S, Morita M, Kawauchi S, Ema M, Yamamoto M, Fujii-Kuriyama Y. Defective development of secretory neurones in the hypothalamus of Arnt2-knockout mice. Genes Cells. 2001;6(4):361–374. doi: 10.1046/j.1365-2443.2001.00421.x. [DOI] [PubMed] [Google Scholar]
- Iyer NV, Leung SW, Semenza GL. The human hypoxia-inducible factor 1alpha gene: HIF1A structure and evolutionary conservation. Genomics. 1998;52(2):159–165. doi: 10.1006/geno.1998.5416. [DOI] [PubMed] [Google Scholar]
- Keith B, Adelman DM, Simon MC. Targeted mutation of the murine arylhydrocarbon receptor nuclear translocator 2 (Arnt2) gene reveals partial redundancy with Arnt. Proc Natl Acad Sci U S A. 2001;98(12):6692–6697. doi: 10.1073/pnas.121494298. [DOI] [PMC free article] [PubMed] [Google Scholar]
- Kewley RJ, Whitelaw ML, Chapman-Smith A. The mammalian basic helix-loop-helix/PAS family of transcriptional regulators. Int J Biochem Cell Biol. 2004;36(2):189–204. doi: 10.1016/s1357-2725(03)00211-5. [DOI] [PubMed] [Google Scholar]
- Kewley RJ, Whitelaw ML. Phosphorylation inhibits DNA-binding of alternatively spliced aryl hydrocarbon receptor nuclear translocator. Biochem Biophys Res Commun. 2005;338(1):660–667. doi: 10.1016/j.bbrc.2005.08.073. [DOI] [PubMed] [Google Scholar]
- Kozak KR, Abbott B, Hankinson O. ARNT-deficient mice and placental differentiation. Dev Biol. 1997;191(2):297–305. doi: 10.1006/dbio.1997.8758. [DOI] [PubMed] [Google Scholar]
- Lee JS, Kim EY, Iwata H, Tanabe S. Molecular characterization and tissue distribution of aryl hydrocarbon receptor nuclear translocator isoforms, ARNT1 and ARNT2, and identification of novel splice variants in common cormorant (Phalacrocorax carbo) Comp Biochem Physiol C Toxicol Pharmacol. 2007;145(3):379–393. doi: 10.1016/j.cbpc.2007.01.007. [DOI] [PubMed] [Google Scholar]
- Maltepe E, Schmidt JV, Baunoch D, Bradfield CA, Simon MC. Abnormal angiogenesis and responses to glucose and oxygen deprivation in mice lacking the protein ARNT. Nature. 1997;386(6623):403–407. doi: 10.1038/386403a0. [DOI] [PubMed] [Google Scholar]
- Michaud JL, DeRossi C, May NR, Holdener BC, Fan CM. ARNT2 acts as the dimerization partner of SIM1 for the development of the hypothalamus. Mech Dev. 2000;90(2):253–261. doi: 10.1016/s0925-4773(99)00328-7. [DOI] [PubMed] [Google Scholar]
- Necela B, Pollenz RS. Identification of a novel C-terminal domain involved in the negative function of the rainbow trout Ah receptor nuclear translocator protein isoform a (rtARNTa) in Ah receptor-mediated signaling. Biochem Pharmacol. 2001;62(3):307–318. doi: 10.1016/s0006-2952(01)00671-2. [DOI] [PubMed] [Google Scholar]
- Pandini A, Denison MS, Song Y, Soshilov AA, Bonati L. Structural and functional characterization of the aryl hydrocarbon receptor ligand binding domain by homology modeling and mutational analysis. Biochemistry. 2007;46(3):696–708. doi: 10.1021/bi061460t. [DOI] [PMC free article] [PubMed] [Google Scholar]
- Pollenz RS. The aryl-hydrocarbon receptor, but not the aryl-hydrocarbon receptor nuclear translocator protein, is rapidly depleted in hepatic and nonhepatic culture cells exposed to 2,3,7,8-tetrachlorodibenzo-p-dioxin. Mol Pharmacol. 1996;49(3):391–398. [PubMed] [Google Scholar]
- Pollenz RS, Sattler CA, Poland A. The aryl hydrocarbon receptor and aryl hydrocarbon receptor nuclear translocator protein show distinct subcellular localizations in Hepa 1c1c7 cells by immunofluorescence microscopy. Mol Pharmacol. 1994;45(3):428–438. [PubMed] [Google Scholar]
- Pollenz RS, Sullivan HR, Holmes J, Necela B, Peterson RE. Isolation and expression of cDNAs from rainbow trout (Oncorhynchus mykiss) that encode two novel basic helix-loop-Helix/PER-ARNT-SIM (bHLH/PAS) proteins with distinct functions in the presence of the aryl hydrocarbon receptor. Evidence for alternative mRNA splicing and dominant negative activity in the bHLH/PAS family. J Biol Chem. 1996;271(48):30886–30896. doi: 10.1074/jbc.271.48.30886. [DOI] [PubMed] [Google Scholar]
- Pongratz I, Antonsson C, Whitelaw ML, Poellinger L. Role of the PAS domain in regulation of dimerization and DNA binding specificity of the dioxin receptor. Mol Cell Biol. 1998;18(7):4079–4088. doi: 10.1128/mcb.18.7.4079. [DOI] [PMC free article] [PubMed] [Google Scholar]
- Powell WH, Karchner SI, Bright R, Hahn ME. Functional diversity of vertebrate ARNT proteins: identification of ARNT2 as the predominant form of ARNT in the marine teleost, Fundulus heteroclitus. Arch Biochem Biophys. 1999;361(1):156–163. doi: 10.1006/abbi.1998.0992. [DOI] [PubMed] [Google Scholar]
- Prasch AL, Heideman W, Peterson RE. ARNT2 is not required for TCDD developmental toxicity in zebrafish. Toxicol Sci. 2004;82(1):250–258. doi: 10.1093/toxsci/kfh235. [DOI] [PubMed] [Google Scholar]
- Prasch AL, Tanguay RL, Mehta V, Heideman W, Peterson RE. Identification of zebrafish ARNT1 homologs: 2,3,7,8-tetrachlorodibenzo-p-dioxin toxicity in the developing zebrafish requires ARNT1. Mol Pharmacol. 2006;69(3):776–787. doi: 10.1124/mol.105.016873. [DOI] [PubMed] [Google Scholar]
- Reisz-Porszasz S, Probst MR, Fukunaga BN, Hankinson O. Identification of functional domains of the aryl hydrocarbon receptor nuclear translocator protein (ARNT) Mol Cell Biol. 1994;14(9):6075–6086. doi: 10.1128/mcb.14.9.6075. [DOI] [PMC free article] [PubMed] [Google Scholar]
- Reyes H, Reisz-Porszasz S, Hankinson O. Identification of the Ah receptor nuclear translocator protein (Arnt) as a component of the DNA binding form of the Ah receptor. Science. 1992;256(5060):1193–1195. doi: 10.1126/science.256.5060.1193. [DOI] [PubMed] [Google Scholar]
- Rowatt AJ, DePowell JJ, Powell WH. ARNT gene multiplicity in amphibians: characterization of ARNT2 from the frog Xenopus laevis. J Exp Zoolog B MolDev Evol. 2003;300(1):48–57. doi: 10.1002/jez.b.45. [DOI] [PubMed] [Google Scholar]
- Ryan HE, Lo J, Johnson RS. HIF-1 alpha is required for solid tumor formation and embryonic vascularization. EMBO J. 1998;17(11):3005–3015. doi: 10.1093/emboj/17.11.3005. [DOI] [PMC free article] [PubMed] [Google Scholar]
- Sekine H, Mimura J, Yamamoto M, Fujii-Kuriyama Y. Unique and overlapping transcriptional roles of arylhydrocarbon receptor nuclear translocator (Arnt) and Arnt2 in xenobiotic and hypoxic responses. J Biol Chem. 2006;281(49):37507–37516. doi: 10.1074/jbc.M606910200. [DOI] [PubMed] [Google Scholar]
- Semenza GL, Agani F, Booth G, Forsythe J, Iyer N, Jiang BH, Leung S, Roe R, Wiener C, Yu A. Structural and functional analysis of hypoxia-inducible factor 1. Kidney Int. 1997;51(2):553–555. doi: 10.1038/ki.1997.77. [DOI] [PubMed] [Google Scholar]
- Shen ES, Whitlock JP., Jr Protein-DNA interactions at a dioxin-responsive enhancer. Mutational analysis of the DNA-binding site for the liganded Ah receptor. J Biol Chem. 1992;267(10):6815–6819. [PubMed] [Google Scholar]
- Sogawa K, Nakano R, Kobayashi A, Kikuchi Y, Ohe N, Matsushita N, Fujii-Kuriyama Y. Possible function of Ah receptor nuclear translocator (Arnt) homodimer in transcriptional regulation. Proc Natl Acad Sci U S A. 1995;92(6):1936–1940. doi: 10.1073/pnas.92.6.1936. [DOI] [PMC free article] [PubMed] [Google Scholar]
- Sojka KM, Kern CB, Pollenz RS. Expression and subcellular localization of the aryl hydrocarbon receptor nuclear translocator (ARNT) protein in mouse and chicken over developmental time. Anat Rec. 2000;260(4):327–334. doi: 10.1002/1097-0185(200012)260:4<326::AID-AR10>3.0.CO;2-U. [DOI] [PubMed] [Google Scholar]
- Sonnenfeld M, Ward M, Nystrom G, Mosher J, Stahl S, Crews S. TheDrosophila tango gene encodes a bHLH-PAS protein that is orthologous to mammalian Arnt and controls CNS midline and tracheal development. Development. 1997;124(22):4571–4582. doi: 10.1242/dev.124.22.4571. [DOI] [PubMed] [Google Scholar]
- Swanson HI, Chan WK, Bradfield CA. DNA binding specificities and pairing rules of the Ah receptor, ARNT, and SIM proteins. J Biol Chem. 1995;270(44):26292–26302. doi: 10.1074/jbc.270.44.26292. [DOI] [PubMed] [Google Scholar]
- Tanguay RL, Andreasen E, Heideman W, Peterson RE. Identification and expression of alternatively spliced aryl hydrocarbon nuclear translocator 2 (ARNT2) cDNAs from zebrafish with distinct functions. Biochim Biophys Acta. 2000;1494(1–2):117–128. doi: 10.1016/s0167-4781(00)00225-6. [DOI] [PubMed] [Google Scholar]