Abstract
Oxytocin is known to have an antidiuretic effect, but the mechanisms underlying this effect are not completely understood. We infused oxytocin by osmotic minipump into vasopressin-deficient Brattleboro rats for five days and observed marked antidiuresis, increased urine osmolality, and increased solute-free water reabsorption. Administration of oxytocin also significantly increased the protein levels of aquaporin-2 (AQP2), phosphorylated AQP2 (p-AQP2), and AQP3 in the inner medulla and in the outer medulla plus cortex. Immunohistochemistry demonstrated increased AQP2 and p-AQP2 expression and trafficking to the apical plasma membrane of principal cells in the collecting duct, and increased AQP3 expression in the basolateral membrane. These oxytocin-induced effects were blocked by treatment with the vasopressin V2 receptor antagonist SR121463B, but not by treatment with the oxytocin receptor antagonist GW796679X. We conclude that vasopressin V2 receptors mediate the antidiuretic effects of oxytocin, including increased expression and apical trafficking of AQP2, p-AQP2, and increased AQP3 protein expression.
In recent years, the understanding of the molecular basis for the antidiuretic effect of vasopressin has been substantially advanced. The vasopressin V2 receptor1 and renal aquaporin (AQP) water channels2 have been cloned. Vasopressin has been shown to mediate both long- and short-term effects on AQP2 in the principal cells of the collecting duct. The long-term effect of vasopressin leads to increased expression of AQP2, whereas the short-term effects involve trafficking of AQP2 to the apical membrane of the principal cells.3 There is also evidence that vasopressin increases AQP3 protein expression on the basolateral membrane of the principal cells4 and up-regulates the Na-K-2Cl cotransporter,5 the initiator of the countercurrent concentrating mechanism.
Oxytocin (OT) is also known to possess antidiuretic properties.6 In this regard, use of OT to induce labor in pregnancy has been associated with water retention and hyponatremia.7 OT has been shown in vitro to increase osmotic water transport in microdissected renal inner medullary collecting ducts (IMCD)8 and in vivo to cause an antidiuresis in vasopressin-deficient Brattleboro rats.9,10 These effects were reversed by a vasopressin V2 receptor antagonist, suggesting that OT stimulation of vasopressin receptors mediates the antidiuresis. These in vitro observations were not altered by two different OT receptor antagonists.8 The effect of OT on the long- and short-term regulation of AQP2 or the expression of AQP3 and Na-K-2Cl cotransporter has not been studied. The present study was therefore undertaken to advance the knowledge at the molecular level of the antidiuretic effect of OT. The effects of OT on urine concentration, water channels, and ion transporters in the presence or absence of V2 receptor antagonist or OT receptor antagonist were examined.
RESULTS
Effect of V2 Receptor Antagonists in Brattleboro Rats Not Receiving Exogenous OT
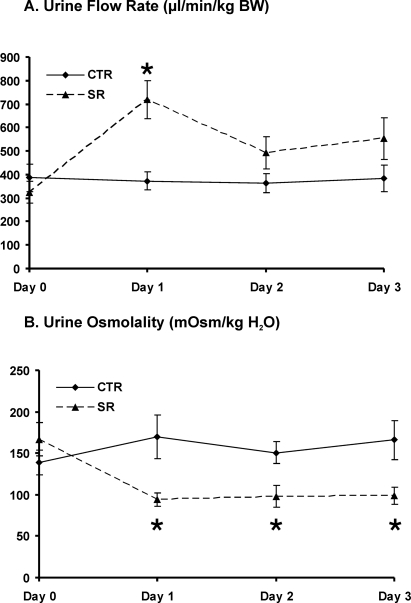
Homogenous Brattleboro rats exhibit profound polyuria and reduced urine osmolality in the absence of detectable vasopressin. Plasma OT concentrations in Brattleboro rats were increased compared with that of Sprague-Dawley rats (35 ± 6 versus 17 ± 2 pg/ml; P < 0.05). V2 receptor antagonist SR121463B subcutaneously injected increased urine flow rate after the first day (Figure 1A) and decreased urine osmolality (Figure 1B). Further investigation demonstrated that SR121463B decreased the abundance of AQP2 in the inner medulla and outer medulla plus cortex (OM+C) and sodium-potassium-2 chloride cotransporter in the OM+C (Table 1; Figure 2).
Figure 1.
Changes in urine flow rate (A) and urine osmolality (B) in Brattleboro rats of controls (CTR) and with SR treatment (SR) (protocol 1). V2 receptor antagonist SR was given twice a day for 3 d by subcutaneous injection. After SR administration urine flow rate was increased dramatically at day 1 and was still higher at days 2 and 3 but did not reach statistical significance. SR treatment decreased urine osmolality significantly compared with CTR rats. *P < 0.05, SR rats versus CTR rats.
Table 1.
Summary of Densitometric Analysis of Immunoblots in the Kidney Different Zones in Control (CTR) and SR-Treated (SR) Brattleboro Rats (Protocol 1)
| CTR | SR | |
|---|---|---|
| IM | ||
| AQP2 | 1.00 ± 0.06 | 0.81 ± 0.03* |
| AQP3 | 1.00 ± 0.09 | 1.11 ± 0.11 |
| AQP4 | 1.00 ± 0.05 | 0.83 ± 0.03 |
| AQP1 | 1.00 ± 0.02 | 1.00 ± 0.02 |
| UT-A1 | 1.00 ± 0.09 | 1.32 ± 0.13 |
| OM+C | ||
| AQP2 | 1.00 ± 0.02 | 0.84 ± 0.01* |
| NKCC2 | 1.00 ± 0.03 | 0.79 ± 0.08* |
| AQP3 | 1.00 ± 0.06 | 0.93 ± 0.14 |
| AQP1 | 1.00 ± 0.01 | 1.00 ± 0.01 |
| UT-A2 | 1.00 ± 0.02 | 0.99 ± 0.03 |
Values are mean ± SEM. UT, urea transporter; NKCC2, sodium-potassium-2 chloride cotransporter.
P < 0.05 compared to CTR Brattleboro rats.
Figure 2.
Immunoblots of membrane fractions of inner medulla (IM) and outer medulla plus cortex (OM+C) in the kidneys from Brattleboro rats: CTR (n = 4) and SR (n = 4) rats, protocol 1. Immunoblots were reacted with affinity-purified anti-AQP2 (A and B) and anti-NKCC2 (Na-K-2Cl Cotransporter) (C) antibodies. Densitometric analysis revealed that in the SR-treated Brattleboro rats the expression levels of AQP2 in the IM and OM+C and NKCC-2 in the OM+C were decreased significantly compared with CTR Brattleboro rats.
Effect of Exogenous OT on the Expression of Renal Water Channels in Brattleboro Rats
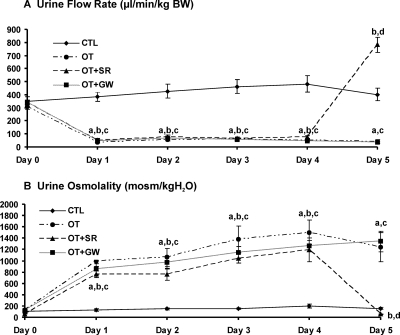
To examine the direct role of OT on renal function, water channels, and ion and urea transporters, exogenous OT was administered to vasopressin-deficient Brattleboro rats with osmotic minipumps for 5 d. During OT infusion, urine flow rate decreased in parallel with an increase in urine osmolality (Figure 3). The decrease in urine flow rate and increase in urine osmolality were associated with an increase in solute-free water reabsorption (TCH2O) (Table 2). To identify the antidiuretic binding receptor for OT, a specific nonpeptide vasopressin V2 receptor antagonist SR121463B and OT receptor antagonist GW796679X were used. SR121463B was given by subcutaneously injection twice daily on the fifth day of OT infusion. The above antidiuretic effects were reversed completely by the V2 receptor, but not OT receptor, antagonist (Figure 3 and Table 2).
Figure 3.
Changes in urine flow rate (A) and urine osmolality (B) in Brattleboro controls (CTL), chronic OT infusion Brattleboro rats (OT), OT infusion Brattleboro rats with SR treatment (OT+SR), and OT infusion Brattleboro rats with GW treatment (OT+GW) (protocol 2). Chronic OT infusion decreased urine flow rate and increased urine osmolality from day 1 to day 5. During day 5, SR administration increased urine flow rate and decreased urine osmolality dramatically, compared with untreated OT rats. However, there was no difference in the urine flow rate or urine osmolality between OT rats and OT rats treated with the oxytocin receptor antagonist GW. a, P < 0.001 OT versus CTL; b, P < 0.001 OT+SR versus CTL; c, P < 0.001 OT+GW versus CTL; d, P < 0.001 OT+SR versus OT and OT+GW.
Table 2.
Characteristics at the Last Day of Experiment in Brattleboro Rats Without Treatment (CTR) or Treated With OT, Followed by Administration of SR (OT+SR) or GW (OT+GW) (Protocol 2)
| CTR | OT | OT + SR | OT + GW | |
|---|---|---|---|---|
| Body weight (g) | 214 ± 5 | 204 ± 7 | 201 ± 6 | 209 ± 5 |
| SOsm (mOsm/kg·H2O) | 310 ± 1 | 299 ± 3 | 308 ± 3 | 305 ± 2 |
| SNa (mmol/L) | 147 ± 1 | 134 ± 7 | 147 ± 2 | 143 ± 1 |
| SCrea. (mg/dl) | 0.27 ± 0.06 | 0.37 ± 0.03 | 0.27 ± 0.03 | 0.39 ± 0.08 |
| ClCrea.(ml/min/kg bw) | 8.7 ± 2.8 | 6.5 ± 1.0 | 10.3 ± 1.2 | 9.5 ± 3.7 |
| UVol (μl/min/kg bw) | 401 ± 49 | 40 ± 14* | 783 ± 170*# | 36 ± 5* |
| UOsm (mOsm/kg·H2O) | 157 ± 14 | 1074 ± 309* | 55 ± 6*# | 1204 ± 207* |
| FENa (%) | 0.76 ± 0.28 | 0.53 ± 0.14 | 0.90 ± 0.24 | 0.36 ± 0.06 |
| TCH2O (μl/min/kg) | −203 ± 34 | 85 ± 27* | −646 ± 171*# | 93 ± 17* |
P < 0.05 compared with CTR Brattleboro rats.
P < 0.05 compared with OT-treated Brattleboro rats.
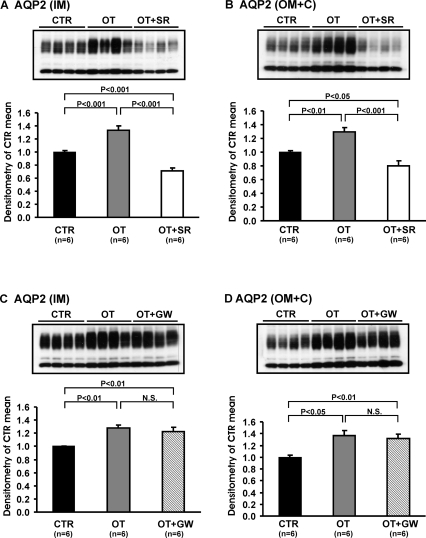
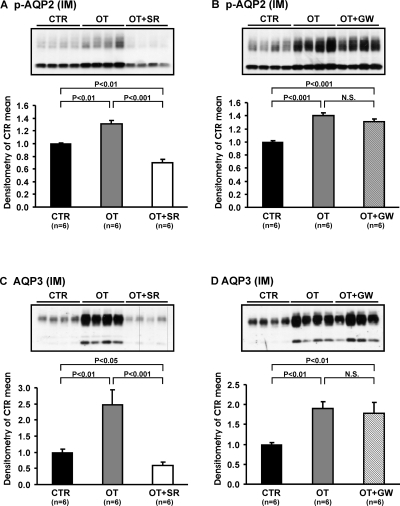
After 5 d OT infusion, there was a marked increase in AQP2 protein levels in the inner medulla (1.33 ± 0.07 versus 1.00 ± 0.02; P < 0.001) and OM+C (1.29 ± 0.07 versus 1.00 ± 0.02; P < 0.01), which was reversed with the V2 receptor antagonist (Figure 4A and B, Table 3). There was no effect of the OT receptor antagonist (Figure 4C and D, Table 4). The abundance of p-AQP2 in the inner medulla and OM+C, and AQP3 expressions in the inner medulla and OM+C were increased with the OT infusion. This effect was reversed with the V2 receptor antagonist (Figure 5A and C, Table 3), but not with the OT receptor antagonist (Figure 5B and D, Table 4).
Figure 4.
Immunoblots of membrane fractions of inner medulla and OM+C in the kidneys from CTR, OT, OT+SR, and OT+GW Brattleboro rats, protocol 2. Immunoblots were reacted with affinity-purified anti-AQP2 antibody. Densitometric analysis of all samples revealed that in OT rats the expression of AQP2 in the inner medulla and OM+C increased significantly compared with CTR rats (A-D). SR treatment decreased the expression levels of AQP 2 in inner medulla and OM+C compared with OT and CTR Brattleboro rats (A and B). GW did not affect OT-induced up-regulation of AQP2 in the inner medulla and OM+C (C and D).
Table 3.
Summary of Densitometric Analysis of Immunoblots in the Kidney Different Zones in Response to CTR, OT, and OT+SR Brattleboro Rats (Protocol 2)
| CTR | OT | OT+SR | |
|---|---|---|---|
| IM | |||
| AQP2 | 1.00 ± 0.02 | 1.33 ± 0.07* | 0.71 ± 0.04*# |
| p-AQP2 | 1.00 ± 0.01 | 1.31 ± 0.06* | 0.69 ± 0.06*# |
| AQP3 | 1.00 ± 0.09 | 2.47 ± 0.46* | 0.60 ± 0.11*# |
| AQP4 | 1.00 ± 0.05 | 1.13 ± 0.09 | 0.85 ± 0.05 |
| UT-A1 | 1.00 ± 0.09 | 1.03 ± 0.26 | 1.11 ± 0.20 |
| OM+C | |||
| AQP2 | 1.00 ± 0.02 | 1.29 ± 0.07* | 0.80 ± 0.07*# |
| p-AQP2 | 1.00 ± 0.04 | 1.53 ± 0.08* | 0.79 ± 0.05*# |
| AQP3 | 1.00 ± 0.14 | 2.01 ± 0.28* | 0.66 ± 0.10* |
| AQP1 | 1.00 ± 0.01 | 0.95 ± 0.03 | 1.00 ± 0.03 |
| UT-A2 | 1.00 ± 0.04 | 1.11 ± 0.21 | 0.89 ± 0.07 |
| NKCC2 | 1.00 ± 0.06 | 1.05 ± 0.07 | 1.15 ± 0.12 |
Values are mean ± SEM.
P < 0.05 compared with control Brattleboro rats.
P < 0.05 compared with OT-treated Brattleboro rats.
Table 4.
Summary of Densitometric Analysis of Immunoblots in the Kidney Different Zones in Response to CTR, OT, and OT+GW Brattleboro Rats (Protocol 2)
| CTR | OT | OT+GW | |
|---|---|---|---|
| IM | |||
| AQP2 | 1.00 ± 0.01 | 1.27 ± 0.05* | 1.23 ± 0.07* |
| p-AQP2 | 1.00 ± 0.01 | 1.40 ± 0.05* | 1.31 ± 0.04* |
| AQP3 | 1.00 ± 0.04 | 1.89 ± 0.18* | 1.72 ± 0.28* |
| AQP4 | 1.00 ± 0.08 | 1.03 ± 0.05 | 0.81 ± 0.10 |
| UT-A1 | 1.00 ± 0.05 | 1.16 ± 0.23 | 0.80 ± 0.11 |
| OM+C | |||
| AQP2 | 1.00 ± 0.03 | 1.37 ± 0.08* | 1.32 ± 0.07* |
| p-AQP2 | 1.00 ± 0.03 | 1.71 ± 0.11* | 1.66 ± 0.10* |
| AQP3 | 1.00 ± 0.08 | 1.99 ± 0.21* | 2.08 ± 0.11* |
| AQP1 | 1.00 ± 0.01 | 0.96 ± 0.03 | 0.96 ± 0.02 |
| UT-A2 | 1.00 ± 0.06 | 1.16 ± 0.04 | 1.31 ± 0.08 |
| NKCC2 | 1.00 ± 0.02 | 0.95 ± 0.03 | 0.94 ± 0.03 |
Values are mean ± SEM. Statistical analysis of results was performed using ANOVA with Student-Newman-Keuls: compare all pairs of columns.
P < 0.05 compared with control Brattleboro rats.
# P < 0.05 compared with OT-treated Brattleboro rats.
Figure 5.
Immunoblots of membrane fractions of inner medulla in the kidneys from CTR, OT, OT+SR, and OT+GW Brattleboro rats, protocol 2. Immunoblots were reacted with affinity-purified anti-p-AQP2 and anti-AQP3 antibody. Densitometric analysis revealed that in the OT rats the expression of p-AQP2 and AQP3 in the inner medulla increased significantly compared with controls (p-AQP2: CTR, A and B; AQP3: CTR, C and D). SR treatment decreased the expression levels of p-AQP2 (A) and AQP3 (C) in the inner medulla compared with OT and CTR rats. GW did not affect OT-induced up-regulation of p-AQP2 (B) and AQP3 (D) in the inner medulla.
Immunochemistry of OT-Induced Alteration of Renal Water Channels in Brattleboro Rats
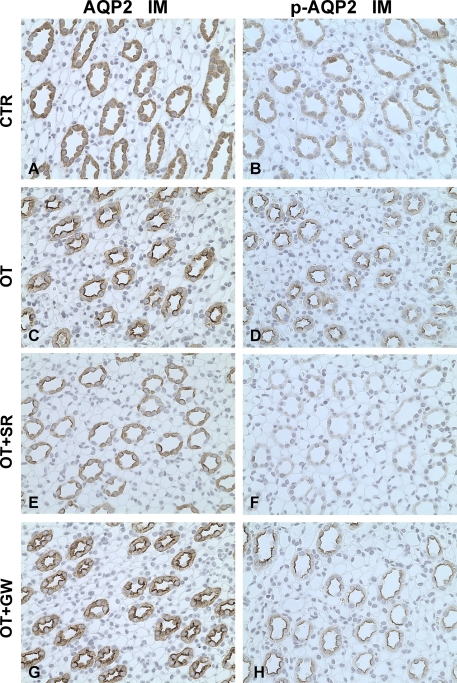
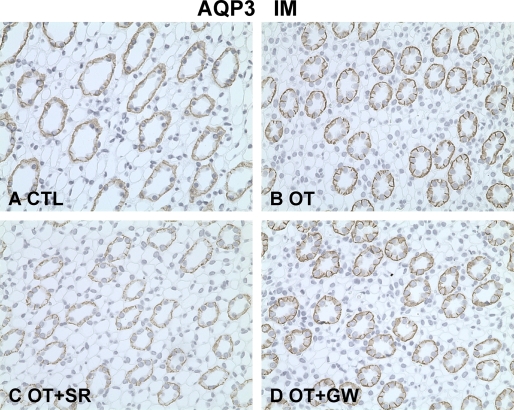
Immunohistochemistry was performed in the different kidney zones. Compared with controls, OT increased the apical plasma membrane labeling density of AQP2 (Figure 6A and C) and p-AQP2 (Figure 6B and D) in the principal cells of the IMCD. The V2 receptor antagonist SR121463B reversed the AQP2 and p-AQP2 apical membrane trafficking with OT in the IMCD principal cells (Figure 6E and F) but not with the OT receptor antagonist (Figure 6 G and H). The staining intensity of AQP3 in the basolateral membrane of the principal cells in the IMCD was also increased after chronic OT infusion (Figure 7A and B). This effect was blocked by the V2 receptor antagonist (Figure 7C), but the OT receptor antagonist had no effect (Figure 7D). In the cortex, similar labeling changes of AQP2, p-AQP2, and AQP3 were found among CTR, OT, OT+SR, and OT+GW groups (data were not shown). OT and V2 and OT receptor antagonists did not change the expression levels of urea transporter UT-A1 in the inner medulla, AQP4 in the inner medulla, AQP1 in the OM+C, UT-A2 in the OM+C, or sodium-potassium-2 chloride cotransporter in the OM+C in Brattleboro rats (Table 3 and Table 4).
Figure 6.
Immunoperoxidase microscopy of AQP2 (A, C, E, G) and p-AQP2 (B, D, F, H) in the inner medulla in rats from protocol 2. In CTR Brattleboro rats, AQP2 (A) and p-AQP2 (B) labeling was seen at the apical plasma membrane domains and intracellular cytoplasmic vesicles of IMCD. In the IMCD of OT rats, the apical AQP2 (C) and p-AQP2 (D) labeling intensity was much stronger compared with that seen in kidneys from control rats. Compared with OT rats and CTR rats, the labeling of AQP2 (E) and p-AQP2 (F) in the IMCD of OT+SR rats was much weaker at the apical plasma membrane domains and intracellular cytoplasmic vesicles of IMCD. In OT+GW rats, the increased apical AQP2 (G) and p-AQP2 (H) labeling intensity did not differ from that seen in kidneys from OT rats (C and D). Magnification: ×400.
Figure 7.
Immunoperoxidase microscopy of AQP3 in the inner medulla in rats from protocol 2. A, In Brattleboro controls, AQP3 labeling was detected at the basolateral membrane domains of principal cells in the IMCD. The increased labeling density of AQP3 was detected at the basolateral membrane domains of IMCD in the OT rats (B) and OT+GW rats (D) but was much weaker in OT+SR rats (C). Magnification: ×400.
DISCUSSION
OT exhibits diverse effects that are mediated by different receptors. Studies in cultured vascular smooth muscle and glomerular mesangial cells demonstrated that the calcium-mediated contractile effect of OT could be abolished by a peptide vasopressin V1 receptor, but not an OT receptor, antagonist.11 In contrast, the contractile effect of OT on cultured myometrium cells was blocked by an OT receptor, but not V1 receptor, antagonist.11 OT receptors have been identified in the kidney,12 and OT has been shown to exert an antidiuretic effect in vasopressin-deficient Brattleboro rats9,10 and to increase water transport in isolated IMCD.8,9 These effects have been shown to be abolished by the administration of a V2 vasopressin receptor antagonist.8,9 Although not previously studied, these findings would suggest that OT would mimic the molecular effects of vasopressin on water channels and ion transporters in the Brattleboro rats. The present study provides results that address this issue and compare the effects of a V2 receptor antagonist versus an OT receptor antagonist on OT-mediated molecular events in the kidney.
OT infusion caused the expected antidiuresis in vasopressin-deficient Brattleboro rats.9,10 This antidiuresis was associated with an up-regulation of AQP2 protein expression in the inner medulla, as well as in the cortex and outer medulla. The increase in AQP2 protein expression was further supported by increased immunohistochemical staining for AQP2. In addition to this long-term regulation of AQP2 expression by OT, the short-term regulation of OT on AQP2 trafficking to the apical plasma membrane in the inner medulla was also examined. As occurs with vasopressin, OT dramatically increased AQP2 labeling by immunoperoxidase microscopy on the apical plasma membrane domains of the IMCD. Phosphorylation of AQP2 is known to be important in the trafficking of AQP2 water channel, and OT treatment was clearly shown with immunoperoxidase microscopy to increase phosphorylated AQP2 labeling on the apical plasma membrane of the collecting duct. There is evidence that vasopressin also modulates the protein expression of AQP3 on the basolateral plasma membrane of the collecting duct.4 In the OT-treated Brattleboro rats, there was a clear increase in the labeling by immunoperoxidase microscopy of AQP3 on the basolateral membrane of the IMCD. There was no evidence that OT treatment altered other potential modulators of urinary concentration, including AQP1, sodium-potassium-2 chloride cotransporter, UT-A1, or UT-A2. Thus, the molecular basis for the antidiuresis that occurred with OT mimicked that which occurs with vasopressin.
Further studies were therefore undertaken to examine the effects of V2 receptor and OT receptor antagonist on these molecular events. GW796679X is a novel small molecule that has been shown to be a potent and very selective OT antagonist. GW796679X was shown to be >10,000-fold selective for human V1a and human V1b and ≥500-fold selective for human V2.13 GW796679X had similar potency and selectivity for rat OT as compared with vasopressin receptors. This antagonist blocked OT-induced uterine contractions in vivo at doses between 0.1 and 0.5 mg/kg.13
In the present study, the antidiuretic effect of chronic OT infusion was completely blocked by V2 receptor antagonist, whereas administration of OT receptor antagonist did not alter the OT-induced antidiuresis. Moreover, the effects of OT on AQP2 and phosphorylated AQP2 trafficking to the apical plasma membrane were also abolished by the V2 receptor antagonist, but not by the OT receptor antagonist. The up-regulation of AQP3 abundance induced by OT was also reversed by V2 receptor antagonist. These results indicate that the V2 receptor is the major receptor mediating the antidiuretic effect of OT, as well as the up-regulation of AQP2 and -3 expression and apical trafficking of AQP2.
The inability of the OT antagonist to block the effects of OT is compatible with earlier in vitro results in the isolated perfused IMCD. In this study 2 different OT peptide antagonists did not alter the effect of OT on water permeability which was, however, blocked by V2 receptor antagonism.8 We acknowledge, however, that negative results can never be 100% exclusive for a role of the renal OT receptor on water homeostasis.
Of interest was the finding that the V2 receptor antagonist increased urine flow further in the polyuric Brattleboro rats, an observation that has been previously made of Pouzet et al.9 This effect could be due to inhibition of the endogenous circulating OT in the Brattleboro rats. Although the plasma concentration of OT in the Brattleboro rats was shown to be moderately higher than in the Sprague-Dawley rats, these plasma levels of OT may not be adequate to affect urine flow.10 On the other hand, small doses of vasopressin, which are not detected by RIA, have been shown to exert an antidiuretic effect.14 In this regard, the V2 receptor antagonist decreased Na-K-2Cl expression in Brattleboro rats, while exogenous OT did not alter the expression of this cotransporter. Since vasopressin, but not OT, receptors are present on the thick ascending limb, these findings support the role of undetectable amount of circulating vasopressin in Brattleboro rats, as measured by RIA, to explain the further increase in urine flow with V2 receptor antagonist administration.
In conclusion, the antidiuresis of OT is associated with molecular events, including increased AQP2 and p-AQP2 expression and trafficking and increased AQP3 expression, which are primarily mediated via the V2 receptor on the basolateral membrane of the collecting duct. With the emergence of nonpeptide V2 receptor antagonists,15 water retention resulting in acute symptomatic hyponatremia in pregnant women receiving OT for labor induction could be reversed with the V2 receptor antagonist as the OT receptor-mediated uterine contraction persists.
CONCISE METHODS
Animal Model
The study protocol was approved by the University of Colorado Institutional Animal Care and Use Committee. Male Brattleboro rats (di/di; Harlan Sprague Dawley, Indianapolis, IN) weighing between 150 and 175 g were allowed to acclimate to Denver's altitude (1500 m) for 1 wk before any experimental protocols. The animals were housed individually in metabolic cages, exposed to a 12-h light-dark cycle and constant ambient temperature, and maintained on a standard rodent diet (Harlan Teklad Bioproducts, Indianapolis, IN) with free access to water.
Rats were allocated to the two protocols indicated below.
Protocol 1
Eight Brattleboro rats were divided into two groups (four in each group): one group was Brattleboro controls; the second group was given V2 receptor antagonist SR 121463B (1 mg/kg per d) subcutaneously twice a day for 3 d. There were four Sprague-Dawley (SD) rats matched as normal control rats to measure plasma OT levels. Exogenous OT was not administered in this protocol.
(1-[4-N-Tert-butylcarbamoyl)-2-methoxybenzene sulfony]-5-ethoxy-3-spiro-[4-(2-morpholinoethoxy)cyclohexane]indol-2-one, phosphate monohydrate, cis-isomer (SR-121463B) is V2-selective nonpeptide vasopressin receptor antagonist (kindly provided by Sanofi Recherche, Paris, France).16
Protocol 2
There were six Brattleboro rats in each of four groups and each experiment lasted for 5 d. Rats of the first group were selected as sham-operated controls (osmotic minipump with saline implanted in peritoneum) (Alzet, Model 2002, DURECT Corporation, Cupertino, CA, CTR). Rats of the next three groups were implanted with osmotic minipumps placed in the peritoneal cavity and delivering OT at a rate of 3 μg/kg/h for 5 d. This dose was chosen because of its demonstrated antidiuretic effect.10 On the fifth day of chronic OT treatment, one group (OT+SR) was given a subcutaneous injection of SR121463B twice daily at a dose of 1 mg/kg dissolved in 100 μl saline; one group (OT+GW) received GW796679X (powder, 5 mg/kg, dissolved in 6% Encapsin, 1% DMSO and sterile water), by gavage twice daily, 2 ml, in two separate injections 12 h apart; and one group served as OT control group. Twenty-four hours later, rats were decapitated.
(2R)-2-(2,4-Difluorophenyl)-2-[(3R,6R)-3-(2,3-dihydro-1H-inden-2-yl)-6-(2-methylpropyl)-2,5-dioxo-1-piperazinyl]-N,N-dimethylamide (GW796679X), a selective OT receptor antagonist, was synthesized at GlaxoSmithKline (Stevenage, UK).13
The plasma levels of the OT receptor antagonist were sufficient to antagonize approximately 90% to 100% of the response to OT-induced uterine contraction over the entire 24-h dosing period.
Urine was collected for both protocols and urine osmolality and creatinine were measured. Animals were sacrificed by decapitation. Trunk blood was collected for serum osmolality and serum sodium and creatinine concentrations. In protocol 1, 0.5 ml of blood was collected for the plasma OT measurement and drawn into chilled Eppendorf tubes containing 0.5 mg EDTA. Plasma OT levels were analyzed using an enzyme immunoassay (ETA) kit (Assay Designs Inc., Ann Arbor, MI). Serum and urine osmolality were measured by freezing point depression (Advanced Instruments, Inc., Norwood, MA). Serum and urine creatinine were measured by using a Creatinine Analyzer 2 (Beckman Instruments, Inc., Fullerton, CA). Serum sodium concentrations were measured by flame photometry.
Protein Isolation
After decapitation, kidneys were removed and placed in ice-cold isolation solution containing 250 mM sucrose, 25 mM imidazole, 1 mM EDTA, pH 7.2, with 0.1 vol% protease inhibitors (0.7 μg/ml pepstatin, 0.5 μg/ml leupeptin, and 1 μg/ml aprotinin), and 200 μM phenylmethylsulfonyl fluoride. Kidneys were dissected on ice into OM+C and inner medulla regions. Tissue samples were immediately homogenized in a glass homogenizer at 4 °C. This homogenate was centrifuged in a Hermle Labnet Z323K centrifuge (Labnet International Inc., Woodbridge, NJ) at 4000 g for 15 min at 4 °C, and the supernatant was pipetted off and solubilized at 65 °C for 15 min in Laemmli sample buffer containing 2% SDS and then stored at −20 °C. Protein concentration was determined for each sample by the Bradford method (Bio-Rad, Richmond, CA). Tissue protein was utilized for immunoblotting for AQP water channels, and sodium and urea transporters.
Electrophoresis and Immunoblotting
Samples of membrane fractions were run on 10% or 12% acrylamide gels using methods described previously in detail.17 For each gel an identical gel was run in parallel and subjected to Coomassie staining for confirming equal loading of protein. The other gel was subjected to Western blotting analysis. After transfer by electroelution to nitrocellulose membranes, blots were blocked with 5% milk in PBS-T (80 mM Na2HPO4, 20 NaH2PO4, 100 mM NaCl, 0.1% Tween 20, pH 7.5) for 1 h and incubated with primary antibodies (see below) overnight at 4 °C. After washing with PBS-T, the blots were incubated with horseradish peroxidase–conjugated secondary antibody (P448; Dako A/S, Glostrup Denmark; diluted 1:3000). After a final washing as above, antibody binding was visualized using the enhanced chemiluminescence system (Amersham International, UK).
Primary Antibodies
For semiquantitative immunoblotting and immunocytochemistry, antibodies to AQP2 and AQP3 have been previously characterized.4,18 Anti-AQP1 was obtained from Chemicon International, Inc. (Temecula, CA). Anti-aquaporin-2 (p-AQP2) antibody was kindly provided by Dr. Soren Nielsen (Aarhus, Denmark). Anti-Na-K-2Cl antibody was kindly provided by Dr. Mark A. Knepper (Bethesda). Anti-UTA1 and UT-A2 antibody was kindly provided by Dr. Jeff Sands (Atlanta).
Immunocytochemistry
The kidneys from protocol 2 were fixed by retrograde perfusion via the abdominal aorta with 3% paraformaldehyde in 0.1 M cacodylate buffer, pH 7.4. Immunolabeling was performed on sections from paraffin-embedded preparation (2-μm thickness) using methods described previously in detail.19 The microscopy was carried out using a Leica DMRE light microscope.
Statistics
Values are presented as mean ± standard error. Multiple group comparisons were performed using a one-way ANOVA with posttest according to Newman-Keuls. Because unidirectional changes were expected with the intervention, i.e. improvement of the parameter examined, a one-way ANOVA was used. Comparisons between two groups were made by unpaired t test. A P value of <0.05 was considered statistically significant.
DISCLOSURES
None.
Published online ahead of print. Publication date available at www.jasn.org.
See related editorial, “Is Oxytocin a Player in Antidiuresis?” on pages 189–190.
References
- 1.Birnbaumer M, Seibold A, Gilbert S, Ishido M, Barberis C, Antaramian A, Brabet P, Rosenthal W: Molecular cloning of the receptor for human antidiuretic hormone. Nature 357: 333–335, 1992 [DOI] [PubMed] [Google Scholar]
- 2.Denker BM, Smith BL, Kuhajda FP, Agre P: Identification, purification, and partial characterization of a novel Mr 28,000 integral membrane protein from erythrocytes and renal tubules. J Biol Chem 263: 15634–15642, 1988 [PubMed] [Google Scholar]
- 3.Nielsen S, Frokiaer J, Marples D, Kwon TH, Agre P, Knepper MA: Aquaporins in the kidney: from molecules to medicine. Physiol Rev 82: 205–244, 2002 [DOI] [PubMed] [Google Scholar]
- 4.Terris J, Ecelbarger CA, Nielsen S, Knepper MA: Long-term regulation of four renal aquaporins in rats. Am J Physiol 271: F414–F422, 1996 [DOI] [PubMed] [Google Scholar]
- 5.Kim GH, Ecelbarger CA, Mitchell C, Packer RK, Wade JB, Knepper MA: Vasopressin increases Na-K-2Cl cotransporter expression in thick ascending limb of Henle's loop. Am J Physiol 276: F96–F103, 1999 [DOI] [PubMed] [Google Scholar]
- 6.Conrad KP, Gellai M, North WG, Valtin H: Influence of oxytocin on renal hemodynamics and electrolyte and water excretion. Am J Physiol 251: F290–F296, 1986 [DOI] [PubMed] [Google Scholar]
- 7.Potter RR: Water retention due to oxytocin. Obstet Gynecol 23: 699–702, 1964 [PubMed] [Google Scholar]
- 8.Chou CL, DiGiovanni SR, Luther A, Knepper MA: Oxytocin as an antidiuretic hormone: II, role of V2 vasopressin receptor. Am J Physiol 269: F78–F85, 1995 [DOI] [PubMed] [Google Scholar]
- 9.Pouzet B, Serradeil-Le GC, Bouby N, Maffrand JP, Le FG, Bankir L: Selective blockade of vasopressin V2 receptors reveals significant V2-mediated water reabsorption in Brattleboro rats with diabetes insipidus. Nephrol Dial Transplant 16: 725–734, 2001 [DOI] [PubMed] [Google Scholar]
- 10.Lyness J, Robinson AG, Sheridan MN, Gash DM: Antidiuretic effects of oxytocin in the Brattleboro rat. Experientia 41: 1444–1446, 1985 [DOI] [PubMed] [Google Scholar]
- 11.Briner VA, Tsai P, Choong HL, Schrier RW: Comparative effects of arginine vasopressin and oxytocin in cell culture systems. Am J Physiol 263: F222–F227, 1992 [DOI] [PubMed] [Google Scholar]
- 12.Arpin-Bott MP, Waltisperger E, Freund-Mercier MJ, Stoeckel ME: Two oxytocin-binding site subtypes in rat kidney: pharmacological characterization, ontogeny and localization by in vitro and in vivo autoradiography. J Endocrinol 153: 49–59, 1997 [DOI] [PubMed] [Google Scholar]
- 13.Borthwick AD, Davies DE, Exall AM, Hatley RJ, Hughes JA, Irving WR, Livermore DG, Sollis SL, Nerozzi F, Valko KL, Allen MJ, Perren M, Shabbir SS, Woollard PM, Price MA: 2,5-Diketopiperazines as potent, selective, and orally bioavailable oxytocin antagonists, 3: synthesis, pharmacokinetics, and in vivo potency. J Med Chem 49: 4159–4170, 2006 [DOI] [PubMed] [Google Scholar]
- 14.Andersen LJ, Andersen JL, Schutten HJ, Warberg J, Bie P: Antidiuretic effect of subnormal levels of arginine vasopressin in normal humans. Am J Physiol 259: R53–R60, 1990 [DOI] [PubMed] [Google Scholar]
- 15.Schrier RW, Gross P, Gheorghiade M, Berl T, Verbalis JG, Czerwiec FS, Orlandi C: Tolvaptan, a selective oral vasopressin V2-receptor antagonist, for hyponatremia. N Engl J Med 355: 2099–2112, 2006 [DOI] [PubMed] [Google Scholar]
- 16.Serradeil-Le GC, Lacour C, Valette G, Garcia G, Foulon L, Galindo G, Bankir L, Pouzet B, Guillon G, Barberis C, Chicot D, Jard S, Vilain P, Garcia C, Marty E, Raufaste D, Brossard G, Nisato D, Maffrand JP, Le FG: Characterization of SR 121463A, a highly potent and selective, orally active vasopressin V2 receptor antagonist. J Clin Invest 98: 2729–2738, 1996 [DOI] [PMC free article] [PubMed] [Google Scholar]
- 17.Li C, Wang W, Summer SN, Cadnapaphornchai MA, Falk S, Umenishi F, Schrier RW: Hyperosmolality in vivo upregulates aquaporin 2 water channel and Na-K-2Cl co-transporter in Brattleboro rats. J Am Soc Nephrol 17: 1657–1664, 2006 [DOI] [PubMed] [Google Scholar]
- 18.Xu DL, Martin PY, Ohara M, St. John J, Pattison T, Meng X, Morris K, Kim JK, Schrier RW: Upregulation of aquaporin-2 water channel expression in chronic heart failure rat. J Clin Invest 99: 1500–1505, 1997 [DOI] [PMC free article] [PubMed] [Google Scholar]
- 19.Li C, Shi Y, Wang W, Sardeli C, Kwon TH, Thomsen K, Jonassen T, Djurhuus JC, Knepper MA, Nielsen S, Frokiaer J: Alpha-MSH prevents impairment in renal function and dysregulation of AQPs and Na-K-ATPase in rats with bilateral ureteral obstruction. Am J Physiol Renal Physiol 290: F384–F396, 2006 [DOI] [PubMed] [Google Scholar]


