Abstract
Proteinuria is a key factor in the progression of tubulointerstitial injury. Recently, tubular ischemia as a result of loss of peritubular capillaries has been identified as another major contributor to disease progression, but the relative contribution of these insults on tubulointerstitial damage is unknown. Anti–glomerular basement membrane glomerulonephritis was induced in wild-type (WT) and Fc receptor knockout (FcRKO) mice, which have been shown to be relatively protected against glomerular endothelial injury. Despite comparable degrees of proteinuria, WT mice developed significantly worse renal function than FcRKO mice, along with higher expression of both type I collagen and kidney injury molecule-1 (a sensitive marker of acute tubular injury) by real-time PCR and immunohistochemistry. In addition, compared with FcRKO mice, WT mice exhibited a greater decrease in peritubular red blood cell velocity by intravital videomicroscopy and a marked increase of tissue hypoxia. In vitro, kidney injury molecule-1 expression increased in cultured mouse proximal tubular epithelial cells in response to cellular stresses, including hypoxia, starvation, and exposure to excessive protein; therefore, it is suggested that hypoxic insults more strongly influence tubulointerstitial damage than proteinuria alone in models of subacute renal disease.
It is accepted that proteinuria is a hallmark of glomerular disease, and the magnitude of proteinuria is an adverse prognostic factor in varied nephropathies. There is evidence that proteinuria is both a marker for and a mechanism of kidney disease progression.1–3 Consistent with this hypothesis are clinical studies showing that a reduction in proteinuria is associated with a slower decline in GFR.4–6 Ischemia as a result of peritubular capillary loss or hypoperfusion is also considered a major factor for the progression of tubulointerstitial damage, which is closely associated with impairment of renal function. Renal tissue hypoxia induces profibrogenic responses and tubulointerstitial injury, which includes degeneration, dedifferentiation, and apoptosis of tubular epithelium7–9; however, it is unclear whether proteinuria or hypoxia has more impact on tubulointerstitial damage and renal prognosis in glomerulonephritis.
Kidney injury molecule-1 (Kim-1) gene belongs to the T cell Ig mucin (TIM) gene family.10 Previous reports showed that Kim-1 expression is markedly upregulated in the proximal tubular epithelial cell in postischemic and nephrotoxin-induced renal failure.11,12 Indeed, the Kim-1 ectodomain can be detected in the urine of patients with acute tubular necrosis and rodent nephrotoxin-induced renal failure.13 Kim-1–positive tubular epithelial cells show simultaneous expression of vimentin and bromodeoxyuridine, markers of dedifferentiation and proliferation, respectively14,15; therefore, Kim-1 has been suggested as an early, noninvasive general urinary biomarker for tubular injury. This study aimed to determine the relative effects of proteinuria and tissue ischemia on Kim-1 expression as a marker of tubular injury. We previously demonstrated that in Fc receptor–deficient (FcRKO) mice, the induction of anti–glomerular basement membrane antibody–induced glomerulonephritis (anti-GBM GN) leads to less severe renal injury as compared with wild-type (WT) mice, even if higher dosages of the antibodies are used, which result in a comparable degree of proteinuria.16 This is partly due to a grossly different glomerular injury. WT mice showed severe endothelial damage in glomerular capillaries, and FcRKO mice showed mesangioproliferative glomerulonephritis with less endothelial injury.16 These differences may affect postglomerular flow, leading to reduced peritubular flow. Using this experimental model, we further assessed the tubulointerstitial injury in relation to proteinuria and tubular ischemia, using Kim-1 as a sensitive marker of acute tubular injury. Intravital videomicroscopy was used to assess peritubular blood flow and pimonidazole expression as an indicator of tissue hypoxia.
RESULTS
WT Mice with Anti-GBM GN Showed a Higher Degree of Proteinuria and More Glomerular and Tubulointerstitial Damage
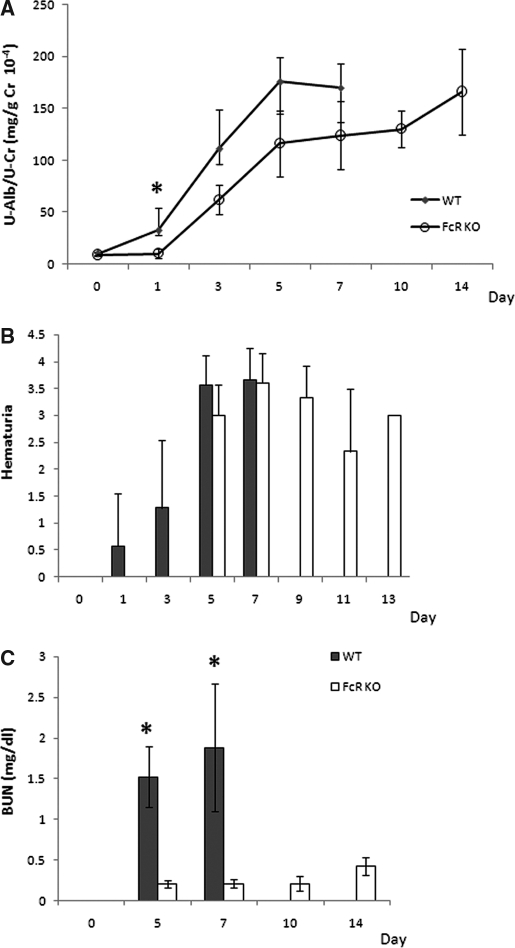
WT mice with anti-GBM GN showed higher levels of albuminuria from day 1. FcRKO mice that were administered an injection of three times the amount of nephrotoxic serum showed comparable albuminuria to WT mice at day 5, reaching a peak of 180 mg/g creatinine at days 11 through 14 (Figure 1A). Hematuria could be detected in the WT group from day 1 and progressively increased (Figure 1B). Hematuria appeared later in FcRKO mice but reached comparable levels at days 5 through 7. After day 7 following the injection of nephrotoxic serum, all WT mice had died with renal failure, whereas FcRKO mice survived to day 14. Blood urea nitrogen (BUN) was markedly elevated in the WT mice, whereas there was only mild elevation in FcRKO mice (Figure 1C).
Figure 1.
Urinary protein, hematuria, and BUN in anti-GBM GN in WT and FcRKO mice. (A) WT mice demonstrated significantly greater proteinuria at day 1. FcRKO mice showed a comparable degree of proteinuria to that of WT mice at days 5 through 7. (B) FcRKO mice also showed hematuria after day 5. (C) Although there was no difference in baseline BUN in both mouse strains, WT mice showed a significant increased in BUN as compared with FcRKO mice from day 5 onward (*P < 0.05).
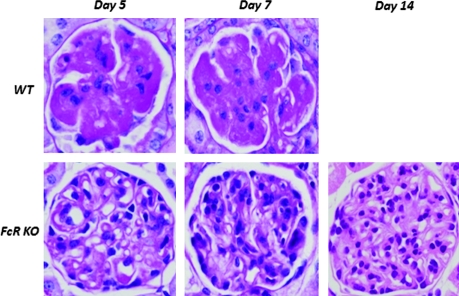
All WT mice developed severe glomerular endothelial swelling, vascular thrombosis with fibrin deposition, fluffy irregularity of the GBM, and infiltration of polymorphonuclear cells. Conversely, FcRKO mice showed a distinct morphology characterized by mesangial proliferation and mononuclear cell infiltration occurring only after day 5 (Figure 2). As shown in Table 1, day 7 WT mice had significantly worse glomerulosclerosis and tubulointerstitial injury score than that of FcRKO mice at days 7 and 14.
Figure 2.
Glomerular lesions in anti-GBM GN in WT and FcRKO mice. Using periodic acid-Schiff staining, severe glomerular capillary space obliteration by endothelial swelling and thrombosis with fibrin deposition was seen in WT mice as early as day 5 (top). FcRKO mouse glomerular lesion was characterized by mesangial proliferation, increased matrix deposition, and mononuclear cell infiltration with lesser degree of glomerular sclerosis. Most capillary spaces were patent even at the day 14 (bottom).
Table 1.
Semiquantitative analysis of day 14 FcRKO versus day 7 WT mice
| Score | Day | Wild Type (WT) | FcR Knock-Out Mice (FcRKO) |
|---|---|---|---|
| Glomerulosclerosis score | 7 | 1.82 ± 0.56 (n = 8) | 0.17 ± 0.72 (n = 9) |
| 14 | 0.61 ± 0.19 (n = 4) | ||
| Tubulointerstitial score | 7 | 2.36 ± 0.69 | 0.47 ± 0.33 |
| 14 | 0.65 ± 0.33 |
Marked Reduction in Patent Glomerular Capillary Area Associated with Significant Reduction in Peritubular Capillary Blood Flow and More Severe Local Tissue Hypoxia
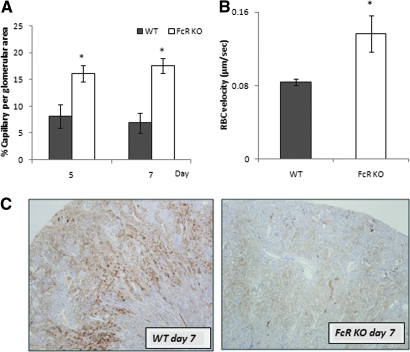
The percentage of capillary area per glomerular unit of FcRKO mice was significantly more preserved than that of the WT mice at days 5 and 7 (Figure 3A). There was no difference in red blood cell (RBC) velocity in the control group of both mouse strains (data not shown); however, day 7 WT mice showed significant reduction in the RBC velocity flow as compared with day 7 FcRKO mice (Figure 3B).
Figure 3.
Marked reduction in patent capillary spaces and after capillary RBC velocity associated with an increase in number of tubules positive for pimonidazole in WT mice. (A) Percentage of patent glomerular capillary luminal area per unit was significantly more well preserved in FcRKO mice when compared with WT mice at both day 5 and day 7 (*P < 0.001). There were no difference between each mouse strain at baseline (data not shown). (B) Peritubular RBC velocity of day 7 FcRKO mice was significantly higher than that of WT mice of the same day (*P < 0.001; n = 3 each group). (C) At day 7, WT mice showed extensive pimonidazole positive tubules involving almost the entire cortex (left), whereas in FcRKO mice, the tubules expressing pimonidazole were few in number (right)
At day 7, WT mice showed increased pimonidazole staining in tubules that was widely distributed from the medulla to the outer cortex. In FcRKO mice, few pimonidazole-positive tubules were observed (Figure 3C).
Increased Tubular Kim-1 Expression in WT Mice than FcRKO Mice Despite Comparable Degree of Proteinuria
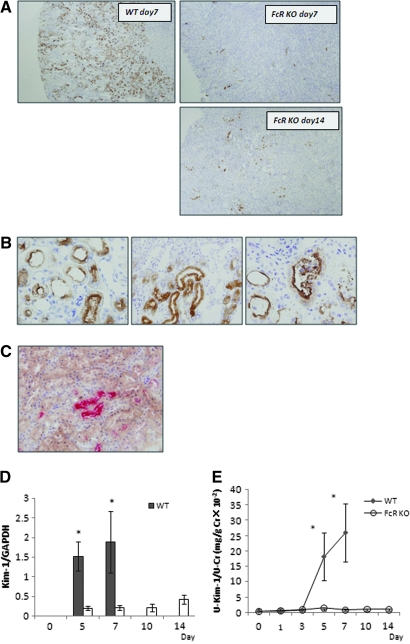
There was no detectable Kim-1 protein in control WT and FcRKO mice. At day 7, WT mice with anti-GBM GN showed extensive tubular Kim-1 expression involving almost the entire cortex, predominantly at the corticomedullary junction (Figure 4A, top left). Three patterns of Kim-1 distribution were observed. Most of the cells expressed Kim-1 in the apical region (Figure 4B, left), but some demonstrated dense cytoplasmic staining for Kim-1 (Figure 4B, middle). Occasionally, there were positive stained epithelial cells with intact nuclei in the dilated tubular lumen, indicating denuded epithelium (Figure 4B, right). It is interesting that in FcRKO mice, despite severe proteinuria and hematuria at day 7, Kim-1–positive tubules were markedly reduced in number and distributed in a scattered and irregular manner as compared with the WT mice (Figure 4A, top right). Even at the peak of proteinuria at day 14, the numbers of Kim-1–positive tubules in FcRKO mice were still less than those of day 7 WT mice (Figure 4A, bottom right). Double immunostaining showed that pimonidazole-positive tubules were co-localized with tubules expressing Kim-1 (Figure 4C).
Figure 4.
Kim-1 expression in renal tissues of WT and FcRKO mice as a sensitive marker of tubular injury. (A) Extensive Kim-1–positive tubules were seen involving almost the entire cortex of day 7 WT mice. They were predominantly found in the corticomedullary junction corresponding to S3 segment of the proximal tubules (top left). In contrast, the FcRKO mice showed minimal positive tubules at day 7 and even at day 14, despite demonstrating the comparable amount of proteinuria (top and bottom right). (B) Most tubules showed apical staining for Kim-1 staining (left). Some demonstrated dense intracytoplasmic staining of Kim-1 (middle). Occasionally, intraluminal nucleated epithelial cells were also positive for Kim-1. (right). (C) Double immunostaining showed pimonidazole-positive tubules (brown) located close to Kim-1–positive tubules (pink). Some tubules were positive for both Kim-1 and pimonidazole staining. (D) Real-time PCR revealed that Kim-1 mRNA expression in renal tissues was consistent with immunohistochemical findings (*P < 0.05, WT versus FcRKO mice on day 5 and day 7). (E) Urinary Kim-1 was elevated in WT mice correlating with protein and mRNA expression (*P < 0.05, WT versus FcRKO mice on day 5 and day 7).
Real-time PCR of Kim-1 mRNA expression confirmed the immunostaining findings of the day 7 WT mice (Figure 4D). Kim-1 mRNA expression was also detected in FcRKO mice but to a much lesser extent.
Urinary Kim-1 was not detected in control animals; however, significant increases in urinary Kim-1 were seen in WT mice at day 5, which further increased at day 7. FcRKO mice showed lesser amounts of urinary Kim-1 (Figure 4E). This observation is consistent with tissue Kim-1 mRNA and immunohistochemical findings.
Increased Interstitial Type I Collagen Protein and mRNA Expression Indicating More Severe Tubulointerstitial Damage
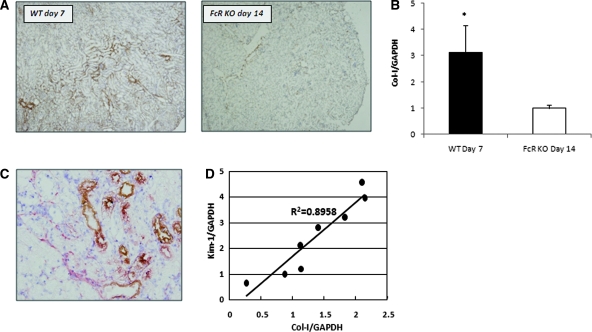
The expression of type I collagen (Col-I) was used to evaluate acute tubulointerstitial damage. When WT mice at day 7 were compared with day 14 FcRKO mice, as shown in Figure 5, A and B, the WT mice had higher tubulointerstitial Col-I protein and mRNA expression. Kim-1–positive tubules were co-located with Col-I–positive regions (Figure 5C). Furthermore, mRNA expression of Kim-1 in WT mice was positively correlated to that of Col-I (Figure 5D).
Figure 5.
Higher Col-I mRNA and protein expression in day 7 WT anti-GBM mice than day 14 FcRKO mice with comparable amount of proteinuria. (A) Immunostaining of Col-I revealed that day 7 WT mice showed an increase of Col-I expression when compared with day 14 FcRKO mice, despite a comparable amount of proteinuria. (B) Real-time PCR confirmed that there was statistically significant increase in Col-I mRNA expression in WT mice (*P < 0.01). (C) Double immunostaining demonstrated increased interstitial Col-I (red) detected around Kim-1–positive tubular cells (brown) in the day 7 WT mice. (D) Kim-1 mRNA expression was well correlated with that of Col-I in WT mice at day 7.
Cellular Stress Induces Kim-1 Expression in Murine Proximal Tubular Epithelial Cells
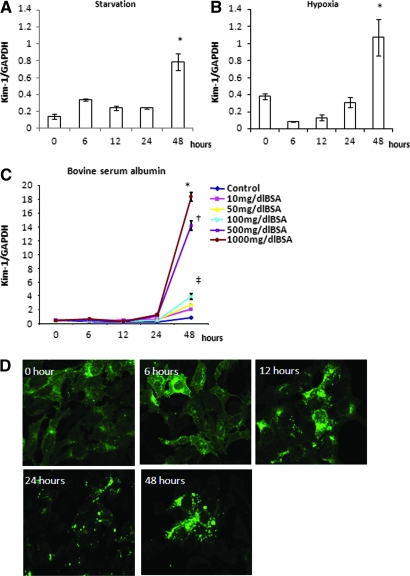
Removal of FCS from culture medium transiently increased Kim-1 mRNA expression by 6 h (Figure 6A). With subsequent FCS starvation, Kim-1 mRNA expression peaked at 48 h. FCS was reduced in the medium to 0.5% to induce cell-cycle arrest; hence, basal Kim-1 mRNA expression in hypoxic conditions was slightly elevated. Subsequently, Kim-1 expression was downregulated at 6 h and then progressively increased, peaking at 48 h (Figure 6B). Exposure to BSA increased Kim-1 mRNA expression in a dosage-dependent manner, peaking at 48 h (Figure 6C).
Figure 6.
Various cellular stresses increased Kim-1 expression in mProx. (A) Removal of FCS resulted in increased Kim-1 expression at 6 h and with peak expression at 48 h (*P < 0.05 versus baseline). (B) Basal Kim-1 mRNA expression at 0 h in hypoxic condition was slightly elevated (considered due to 24-h preincubation with 0.5% FCS medium to induce cell-cycle arrest). Subsequent hypoxic condition downregulated Kim-1 expression at 6 h but then increased with a peak level at 48 h (*P < 0.05 versus baseline). (C) BSA increased Kim-1 mRNA expression in a dosage-dependent manner (*P < 0.05, †P < 0.05, ‡P < 0.05 versus 48-h control). (D) Kim-1 protein was diffusely expressed in the cytoplasm at 0 and 6 h in hypoxic condition. Small cytoplasmic vesicles of Kim-1 protein gradually increased in number and size after 6 h, forming larger granules at 48 h.
Figure 6D illustrates cellular Kim-1 expression in hypoxic conditions. Kim-1 protein was diffusely expressed in cytoplasm at 0 and 6 h. Cytoplasmic vesicles of Kim-1 protein increased in numbers and size after 6 h. At 48 h, larger granular vesicles localized predominantly at the cell membrane. At this point, only viable cells showed strong Kim-1 expression. Similar observations were seen in FCS-starved and BSA-treated cells.
DISCUSSION
Clinical and experimental studies have demonstrated that tubulointerstitial damage rather than glomerular damage correlates more predictably with progressive deterioration of renal function.17–20 Recent reports highlighted that chronic hypoxia in the interstitium plays a crucial role in progressive renal diseases. Various experimental animal models have shown that hypoxia promotes tubulointerstitial fibrosis.21,22
This study took advantage of the similar degree of proteinuria but differential glomerular damage seen in the model of anti-GBM GN in WT and FcRKO mice. It has been shown that significant loss of glomerular capillary space in WT mice is associated with marked reduction of peritubular capillary blood flow followed by a more severe degree of tubular hypoxia and thus more tubulointerstitial damage. FcRKO mice, which are protected from glomerular endothelial injury as a result of the absence of acute injury through strong activation of FcR on polymorphonuclear cells, preserved their glomerular endothelial space23 and subsequently had a lesser degree of hypoxic insult and thus a slower decline in renal function. The intravital videomicroscopy provided real-time evidence of a markedly diminished RBC velocity that closely reflects the postglomerular blood flow. More profound peritubular hypoxia is confirmed by the marked difference in pimonidazole staining. The sensitivity of detecting hypoxia with pimonidazole is relatively low, detecting hypoxic cells with oxygen levels not higher than 10 mmHg24; therefore, we infer that the clear difference in the pimonidazole expression between day 7 WT and day 14 FcRKO mice was highly significant.
Although the exact function of Kim-1 is still unclear, it was recently reported to be a sensitive and quantitative biomarker for tubular damage.25,26 This study demonstrated a marked difference in tubular Kim-1 mRNA and protein expression in WT and FcRKO mice with anti-GBM GN that paralleled the difference in renal function. It would be tempting to think the gross reduction is due to the absence of FcR common γ chain in FcRKO mice; however, when both mouse strains were subjected to ischemic reperfusion insults, both strains demonstrated similar degrees of Kim-1 protein and mRNA expression (data not shown). Therefore, the gross difference in tubular Kim-1 expression is unlikely to be mediated by the common γ chain or FcR function.
WT mice showed significantly higher mRNA and protein expression of Col-I, co-locating with Kim-1 compared with FcRKO mice, indicating a greater degree of not only tubular damage but also progression of interstitial damage in this early phase of renal injury.
Hypoxia may not be solely responsible for the worse outcome in WT mice. Other possible mechanisms associated with initial FcR activation by anti-GBM antibody, such as acute cytokine activation or production of reactive oxygen species in glomeruli and subsequent tubular damage,27,28 could play an additional role.
In vitro data showed that tubular damage is potentially induced by a variety of cellular stresses. Even though the data do not specifically demonstrate the direct effects of hypoxia on Kim-1 induction, potentially as a result of the cell line or experimental conditions, the in vivo findings suggest that increased tubulointerstitial damage in the WT mice with anti-GBM GN is strongly associated with more severe peritubular ischemia; therefore, alleviating hypoxia should be a therapeutic target to preserve the long-term renal outcome. Our studies correlate well with emerging evidence that tubular hypoxia is critical in the progression of tubulointerstitial damage.
CONCISE METHODS
Anti-GBM GN in WT and FcRKO Mice
Experiments were conducted in accordance with guidelines for animal experimentation at Juntendo University School of Medicine (Tokyo, Japan). Anti-GBM GN was induced in C57BL/6 (CLEA, Tokyo, Japan) and FcRKO female mice weighing 25 to 30 g at 12 to 14 wk (n = 15 in each group). Mice were preimmunized with an intraperitoneal injection of rabbit IgG and complete Freund's adjuvant. After 5 d, a nephrotoxic serum (rabbit anti-mouse GBM antiserum) was administered via the tail vein at a dosage of 0.15 or 0.45 ml/20 g to WT and FcRKO, respectively. Mice were fed standard food, and blood samples were collected via the tail vein or when they were killed.
Urinary and Serologic Analyses
Urine samples were collected in a metabolic cage. Urinary albumin and creatinine were measured by immunoassay (DCA 2000 system; Bayer Diagnostics, Elkhart, IN). Hematuria was determined by urostick (Bayer, Tokyo, Japan). Urinary Kim-1 was detected by sandwich ELISA using two rat anti-mouse Kim-1 mAb, which recognize different Kim-1 epitopes. Urinary Kim-1 was expressed relative to creatinine excretion in milligrams per gram of creatinine. BUN was measured using a commercial kit (Fujifilm BUN-PII, Saitama, Japan).
Immunohistochemical Analysis in Anti-GBM GN
Mice were killed at days 5, 7, and 14 with ether inhalation. For detection of tubular hypoxia, 60 mg/kg hypoxic probe pimonidazole (Chemicon, Temucula, CA) was injected via the tail vein 2 h before the mice were killed.29 Kidneys were perfused with ice-cold normal saline. One kidney was fixed with 4% paraformaldehyde overnight, then 70% ethanol. Another kidney was snap-frozen with liquid nitrogen. Five-micrometer-thick paraffin sections were stained by periodic acid-Schiff and Masson Trichrome reagent. Frozen sections at 3 μm thickness were obtained. Endogenous peroxidase was quenched with 3% hydrogen peroxide in methanol for 15 min. Anti–Kim-1 mAb at 1:25 dilution was applied after three PBS washes, and after overnight incubation, horseradish peroxidase–labeled goat anti-rat IgG (MP Biomedicals, Eschwege, Germany). Color was developed with 3,3′diaminobenzidine tetrahydrochloride (Dako Cytochemistry, Tokyo, Japan). Purified goat anti–Col-I antibody, 1:50 dilution (Southern Biotech, Birmingham, AL) was used to stain Col-I. The secondary antibody was Histofine Simple Stain MAX PO (goat; Nichirei Bioscience, Tokyo, Japan). Other secondary antibodies used were FITC-labeled chicken anti-rat IgG (Molecular Probes, Eugene, OR), alkaline phosphatase rabbit anti-goat IgG (Zymed Laboratories, San Francisco, CA) for double immunostaining for Kim-1 and Col-I or anti-pimonidazole secondary antibodies (Chemicon, Temecula, CA). Positive controls with nonspecific IgG and negative controls were prepared for each antibody.
Semiquantitative Analysis of Glomerulosclerosis and Tubulointerstitial Injury
Quantification was performed in a blinded manner using 30 randomly selected glomeruli and 15 randomly selected nonoverlapping fields of cortex per cross-section. Glomerulosclerosis was graded 0 to 4+ and tubulointerstitial injury was graded 0 to 5+ as described previously.30
Semiquantitative Analysis of Glomerular Capillary Loop Area
Twenty glomeruli were selected in each mouse. Glomeruli were captured by an imaging analyzer (Olympus, Tokyo, Japan). The glomerular area was calculated. Functioning endothelial capillaries were interpreted as luminal areas that were not stained. The percentage of the luminal area to that of the whole glomerular area was obtained and compared between the WT and the FcRKO mice at days 5 and 7 in a blinded manner.
Real-Time Quantitative PCR
Real-time quantitative PCR was performed on the Applied Biosystems 7500 PCR System (Tokyo, Japan) using power SYBR Green PCR Master Mix. Denatured RNA from kidney tissue and cell lysates were transcribed to cDNA. The sequences of primers used were as follows: Kim-1 forward AAA CCA GAG ATT CCC ACA CG and reverse GTC GTG GGT CTT CCT GTA GC and Col-I forward GGC CAT TGG TGG TGC TGA C and reverse TAA AGG AGG AAA CGG CAA AG. Glyceraldehyde-3 phosphate dehydrogenase was used as an internal control. One microliter of synthesized cDNA of each sample was subjected to PCR amplification. Samples were preheated at 95°C for 10 min followed by 40 cycles of 95°C for 15 s and 60°C for 1 min.
Intravital Videomicroscopy and Analysis of Peritubular Blood Flow
Mice were anesthetized with intraperitoneal phenobarbitone. One kidney was dissected, decapsulated, and intermittently irrigated with normal saline to prevent dehydration. Peritubular capillary RBC were visualized with a videomicroscope device.31 At least 3 min of consecutive images of RBC flow was recorded at a rate of 30 fps at four different locations. Images were analyzed using freeze-frame mode. The velocity of the red cell flow was calculated and expressed in millimeters per second. Untreated mice were used as controls.
In Vitro Assays with Murine Proximal Tubular Epithelial Cells
A total of 2 × 10⁷ murine proximal tubular cell line (mProx; CLEA, Tokyo, Japan)32,33 were plated in DMEM with 10% FCS, 25 μg/ml penicillin, and streptomycin for 24 to 36 h to achieve 80 to 90% confluence. Cellular stress was assessed initially by serum starvation. mProx were cultured in FCS-free DMEM for 6, 12, 24, and 48 h. The effect of hypoxia was determined by 24 h of preincubation with 0.5% FCS medium and then incubation in a hypoxic chamber with 5% CO2, 1% O2, and 94% nitrogen for 6, 12, 24, and 48 h. Protein-overload conditions were simulated by incubation with fatty acid–free BSA (Sigma, St. Louis, MO) at 0.1, 0.5, 1.0, and 5.0 mg/ml for 6, 12, and 24 h. Cells were harvested on collagen-coated coverslips (Iwaki, Tokyo, Japan) at 75 to 80% confluence for Kim-1 immunofluorescence staining in the respective conditions and at the times specified.
Statistical Analyses
All numerical data are presented as means ± SEM of mean. Statistical analyses were performed using the t test. Statistical comparisons between groups were made by ANOVA. The significance level was P < 0.05 for all tests (SPSS 11.5 for Window; SPSS, Chicago, IL).
DISCLOSURES
None.
Acknowledgments
We thank Miss Terumi Shibata and Miss Mariko Tamano for excellent technical support.
Published online ahead of print. Publication date available at www.jasn.org.
REFERENCES
- 1.Keane WF: Proteinuria: Its clinical importance and role in progressive renal disease. Am J Kidney Dis 35: S97–S105, 2000 [DOI] [PubMed] [Google Scholar]
- 2.Zoja C, Morigi M, Remuzzi G: Proteinuria and phenotypic change of proximal tubular cells. J Am Soc Nephrol 14[Suppl 1]: S36–S41, 2003 [DOI] [PubMed] [Google Scholar]
- 3.D'Amico G, Bazzi C: Pathophysiology of proteinuria. Kidney Int 63: 809–825, 2003 [DOI] [PubMed] [Google Scholar]
- 4.Hebert LA, Wilmer WA, Falkenhain ME, Ladson-Wofford SE, Nahman NS Jr, Rovin BH: Renoprotection: One or many therapies? Kidney Int 59: 1211–1226, 2001 [DOI] [PubMed] [Google Scholar]
- 5.Taal MW, Brenner BM: Renoprotective benefits of RAS inhibition: From ACEI to angiotensin II antagonists. Kidney Int 57: 1803–1817, 2000 [DOI] [PubMed] [Google Scholar]
- 6.Navis G, de Zeeuw D: Titrating for antiproteinuric effect: The clue to renoprotection? J Hum Hypertens 10: 669–673, 1996 [PubMed] [Google Scholar]
- 7.Fine LG, Bandyopadhay D, Norman JT: Is there a common mechanism for the progression of different types of renal diseases other than proteinuria? Towards the unifying theme of chronic hypoxia. Kidney Int Suppl 75: S22–S26, 2000 [PubMed] [Google Scholar]
- 8.Eckardt KU, Rosenberger C, Jurgensen JS, Wiesener MS: Role of hypoxia in the pathogenesis of renal disease. Blood Purif 21: 253–257, 2003 [DOI] [PubMed] [Google Scholar]
- 9.Nangaku M: Hypoxia and tubulointerstitial injury: A final common pathway to end-stage renal failure. Nephron Exp Nephrol 98: e8–e12, 2004 [DOI] [PubMed] [Google Scholar]
- 10.Kuchroo VK, Umetsu DT, DeKruyff RH, Freeman GJ: The TIM gene family: Emerging roles in immunity and disease. Nat Rev Immunol 3: 454–462, 2003 [DOI] [PubMed] [Google Scholar]
- 11.Ichimura T, Hung CC, Yang SA, Stevens JL, Bonventre JV: Kidney injury molecule-1: A tissue and urinary biomarker for nephrotoxicant-induced renal injury. Am J Physiol Renal Physiol 286: F552–F563, 2004 [DOI] [PubMed] [Google Scholar]
- 12.Ichimura T, Bonventre JV, Bailly V, Wei H, Hession CA, Cate RL, Sanicola M: Kidney injury molecule-1 (KIM-1), a putative epithelial cell adhesion molecule containing a novel immunoglobulin domain, is up-regulated in renal cells after injury. J Biol Chem 273: 4135–4142, 1998 [DOI] [PubMed] [Google Scholar]
- 13.Han WK, Bailly V, Abichandani R, Thadhani R, Bonventre JV: Kidney injury molecule-1 (KIM-1): A novel biomarker for human renal proximal tubule injury. Kidney Int 62: 237–244, 2002 [DOI] [PubMed] [Google Scholar]
- 14.Ichimura T, Maier JA, Maciag T, Zhang G, Stevens JL: FGF-1 in normal and regenerating kidney: Expression in mononuclear, interstitial, and regenerating epithelial cells. Am J Physiol 269: F653–F662, 1995 [DOI] [PubMed] [Google Scholar]
- 15.Hayden PJ, Ichimura T, McCann DJ, Pohl LR, Stevens JL: Detection of cysteine conjugate metabolite adduct formation with specific mitochondrial proteins using antibodies raised against halothane metabolite adducts. J Biol Chem 266: 18415–18418, 1991 [PubMed] [Google Scholar]
- 16.Suzuki Y, Shirato I, Okumura K, Ravetch JV, Takai T, Tomino Y, Ra C: Distinct contribution of Fc receptors and angiotensin II-dependent pathways in anti-GBM glomerulonephritis. Kidney Int 54: 1166–1174, 1998 [DOI] [PubMed] [Google Scholar]
- 17.Nath KA: Tubulointerstitial changes as a major determinant in the progression of renal damage. Am J Kidney Dis 20: 1–17, 1992 [DOI] [PubMed] [Google Scholar]
- 18.Striker GE, Schainuck LI, Cutler RE, Benditt EP: Structural-functional correlations in renal disease. I. A method for assaying and classifying histopathologic changes in renal disease. Hum Pathol 1: 615–630, 1970 [DOI] [PubMed] [Google Scholar]
- 19.Risdon RA, Sloper JC, De Wardener HE: Relationship between renal function and histological changes found in renal-biopsy specimens from patients with persistent glomerular nephritis. Lancet 2: 363–366, 1968 [DOI] [PubMed] [Google Scholar]
- 20.Mackensen-Haen S, Bader R, Grund KE, Bohle A: Correlations between renal cortical interstitial fibrosis, atrophy of the proximal tubules and impairment of the glomerular filtration rate. Clin Nephrol 15: 167–171, 1981 [PubMed] [Google Scholar]
- 21.Manotham K, Tanaka T, Matsumoto M, Ohse T, Miyata T, Inagi R, Kurokawa K, Fujita T, Nangaku M: Evidence of tubular hypoxia in the early phase in the remnant kidney model. J Am Soc Nephrol 15: 1277–1288, 2004 [DOI] [PubMed] [Google Scholar]
- 22.Ohashi R, Kitamura H, Yamanaka N: Peritubular capillary injury during the progression of experimental glomerulonephritis in rats. J Am Soc Nephrol 11: 47–56, 2000 [DOI] [PubMed] [Google Scholar]
- 23.Suzuki Y, Gomez-Guerrero C, Shirato I, Lopez-Franco O, Gallego-Delgado J, Sanjuan G, Lazaro A, Hernandez-Vargas P, Okumura K, Tomino Y, Ra C, Egido J: Pre-existing glomerular immune complexes induce polymorphonuclear cell recruitment through an Fc receptor-dependent respiratory burst: Potential role in the perpetuation of immune nephritis. J Immunol 170: 3243–3253, 2003 [DOI] [PubMed] [Google Scholar]
- 24.Nangaku M: Chronic hypoxia and tubulointerstitial injury: A final common pathway to end-stage renal failure. J Am Soc Nephrol 17: 17–25, 2006 [DOI] [PubMed] [Google Scholar]
- 25.Vaidya VS, Ramirez V, Ichimura T, Bobadilla NA, Bonventre JV: Urinary kidney injury molecule-1: A sensitive quantitative biomarker for early detection of kidney tubular injury. Am J Physiol Renal Physiol 290: F517–F529, 2006 [DOI] [PubMed] [Google Scholar]
- 26.van Timmeren MM, Bakker SJ, Vaidya VS, Bailly V, Schuurs TA, Damman J, Stegeman CA, Bonventre JV, van Goor H: Tubular kidney injury molecule-1 in protein-overload nephropathy. Am J Physiol Renal Physiol 291: F456–F464, 2006 [DOI] [PubMed] [Google Scholar]
- 27.Zheng J, Devalaraja-Narashimha K, Singaravelu K, Padanilam BJ: Poly(ADP-ribose) polymerase-1 gene ablation protects mice from ischemic renal injury. Am J Physiol Renal Physiol 288: F387–F398, 2005 [DOI] [PubMed] [Google Scholar]
- 28.Tanda S, Mori Y, Kimura T, Sonomura K, Kusaba T, Kishimoto N, Kameyama H, Tamagaki K, Okigaki M, Hatta T, Sasaki S, Takeda K, Sado Y, Adachi N, Matsubara H: Histamine ameliorates anti-glomerular basement membrane antibody-induced glomerulonephritis in rats. Kidney Int 72: 608–613, 2007 [DOI] [PubMed] [Google Scholar]
- 29.Arteel GE, Thurman RG, Raleigh JA: Reductive metabolism of the hypoxia marker pimonidazole is regulated by oxygen tension independent of the pyridine nucleotide redox state. Eur J Biochem 253: 743–750, 1998 [DOI] [PubMed] [Google Scholar]
- 30.Matsumoto M, Tanaka T, Yamamoto T, Noiri E, Miyata T, Inagi R, Fujita T, Nangaku M: Hypoperfusion of peritubular capillaries induces chronic hypoxia before progression of tubulointerstitial injury in a progressive model of rat glomerulonephritis. J Am Soc Nephrol 15: 1574–1581, 2004 [DOI] [PubMed] [Google Scholar]
- 31.Yamamoto T, Tada T, Brodsky SV, Tanaka H, Noiri E, Kajiya F, Goligorsky MS: Intravital videomicroscopy of peritubular capillaries in renal ischemia. Am J Physiol Renal Physiol 282: F1150–F1155, 2002 [DOI] [PubMed] [Google Scholar]
- 32.Takaya K, Koya D, Isono M, Sugimoto T, Sugaya T, Kashiwagi A, Haneda M: Involvement of ERK pathway in albumin-induced MCP-1 expression in mouse proximal tubular cells. Am J Physiol Renal Physiol 284: F1037–F1045, 2003 [DOI] [PubMed] [Google Scholar]
- 33.Suda T, Osajima A, Tamura M, Kato H, Iwamoto M, Ota T, Kanegae K, Tanaka H, Anai H, Kabashima N, Okazaki M, Nakashima Y: Pressure-induced expression of monocyte chemoattractant protein-1 through activation of MAP kinase. Kidney Int 60: 1705–1715, 2001 [DOI] [PubMed] [Google Scholar]


