Abstract
Plasminogen activator inhibitor-1 (PAI-1) has been implicated in renal fibrosis. In vitro, PAI-1 inhibits plasmin generation, and this decreases mesangial extracellular matrix turnover. PAI-1R, a mutant PAI-1, increases glomerular plasmin generation, reverses PAI-1 inhibition of matrix degradation, and reduces disease in experimental glomerulonephritis. This study sought to determine whether short-term administration of PAI-1R could slow the progression of glomerulosclerosis in the db/db mouse, a model of type 2 diabetes in which mesangial matrix accumulation is evident by 20 wk of age. Untreated uninephrectomized db/db mice developed progressive albuminuria and mesangial matrix expansion between weeks 20 and 22, associated with increased renal mRNA encoding α1(I) and (IV) collagens and fibronectin. Treatment with PAI-1R prevented these changes without affecting body weight, blood glucose, glycosylated hemoglobin, creatinine, or creatinine clearance; therefore, PAI-1R may prevent progression of glomerulosclerosis in type 2 diabetes.
Accumulation of extracellular matrix (ECM) in the glomerulus ultimately spreading to the interstitium is a characteristic feature of diabetic nephropathy.1,2 Increased matrix production, deposition, and decreased degradation all seem to contribute to matrix accumulation.3 Plasmin and metalloproteinases are considered to play crucial roles in matrix degradation.3–5 Analysis of all components of the plasminogen cascade in diabetes revealed that glycation of plasminogen may result in its impaired activation by plasminogen activators.6,7 Tissue plasminogen activator is present in increased amounts in diabetic plasma but is biologically inactive because it is bound in a complex with plasminogen activator inhibitor type 1 (PAI-1).8 This binding occurs in individuals both with type 1 and with type 2 diabetes,9,10 which is presumably similar in kidney tissue because tissue plasminogen activator levels are increased by cultured mesangial cells in the presence of high glucose.11 In addition, mesangial cells under high glucose conditions had significantly decreased urokinase plasminogen activator (uPA) levels and plasmin activity but elevated PAI-1 levels compared with control.11,12 The net effect of these changes in diabetes is a reduced capacity to generate plasmin activity, thereby resulting in accumulated matrix. The importance of these interactions became evident in an innovative study on the pathogenesis of diabetic microangiopathy. Miskin et al.13 generated a transgenic mouse line with selective organ-specific expression of human uPA using a fusion gene of the human uPA cDNA and a 5′ fragment of the murine ocular lens protein α-crystalline. The presence of the lens α-crystalline gene resulted in enhanced expression of uPA in the retina, brain, and bone marrow but not in other organs, such as the kidney.13 When experimental diabetes was induced in these mice, microvascular changes of basement membrane thickening took place in the renal glomerular capillaries but not in the retinal vessels, presumably because high local uPA levels protected the retinal vessels but not the renal capillaries.14 PAI-1 deficiency has been shown to protect against diabetic nephropathy in the streptozotocin-induced type 1 model of diabetes15 and in the db/db type 2 model of diabetes.16 Such key findings support the concept that high glucose can alter the plasminogen/plasmin cascade in mesangial cells and contribute to the accumulation of mesangial matrix of diabetic nephropathy. Therapeutic strategies to decrease PAI-1 and/or increase uPA or plasmin activities locally may be effective.
Recently, we developed a new human mutant PAI-1R that does not bind any protease but effectively competes with native PAI-1 for vitronectin (Vn) binding sites, thereby enhancing plasmin generation locally and resulting in significant plasmin-dependent reductions in pathologic matrix accumulation in anti–Thy-1 nephritis.17,18 We now ask whether PAI-1R therapy also enhances degradation of the pathologic matrix accumulation in diabetic nephropathy and whether this therapy may be useful for diabetic nephropathy.
The db/db mouse is a hyperinsulinemic model of genetic diabetes with obesity that develops abnormalities in renal morphology and function that parallel those in human nephropathy of type 2 diabetes.19 We found that performing uninephrectomy at 8 wk of age greatly accelerated development and progression of diabetic nephropathy. Uninephrectomized diabetic db/db mice developed overt nephropathy by 20 wk of age, and the disease progression was remarkable between 20 and 22 wk of age, determined by expansion of the mesangium and significant albuminuria. In this experiment, therapeutic efficacy of PAI-1R therefore was determined in established diabetic nephropathy in uninephrectomized db/db mice.
RESULTS
Effect of Uninephrectomy on the Progression of Glomerular Injury in db/db Mice
We compared uninephrectomized db/db and db/m mice with intact db/m mice at 20 wk of age. Marked obesity and hyperglycemia were observed in db/db mice by 20 wk of age. Uninephrectomy had no effect on body weight and blood glucose levels either in db/db or in db/m mice (data not shown). Urinary albumin excretion, a good clinical predictor of renal lesions in diabetic nephropathy,20 was elevated 2.4-fold without and 10-fold with uninephrectomy at 20 wk (P < 0.01). Mesangial matrix expansion is another hallmark of established diabetic nephropathy in humans.21 The sclerotic index in ECM accumulation calculated as the percentage area of the periodic acid Schiff (PAS)-positive area in the glomerulus was mildly increased by 1.3-fold in db/db mice compared with db/m mice at week 20 (P < 0.01). Uninephrectomy significantly increased diabetic ECM accumulation in the glomerulus to 1.9-fold at week 20 (P < 0.05) in db/db but not in db/m mice. Consistently, the diabetic db/db mice demonstrated 1.3-fold (P < 0.05) increases in both glomerular deposition of fibronectin (FN) and type I collagen. Uninephrectomy further increased matrix deposition in diabetic glomeruli by 3.3-fold for FN (P < 0.05) and 1.6-fold for type I collagen (P < 0.05). No effect of uninephrectomy was seen in db/m mice (FN 1.1 ± 0.32 versus 1.0 ± 0.4 [P > 0.05]; type I collagen 1.0 ± 0.2 versus 1.0 ± 0.2 [P > 0.05]). Renal FN protein level in cortex tissue determined by ELISA was also increased by 1.5-fold (P < 0.05) in db/db mice, which was further increased by 2.5-fold (P < 0.05) with uninephrectomy. Uninephrectomy had no effect on renal TGF-β1 protein level either in db/db or in db/m mice. These results indicate that uninephrectomy markedly exacerbated renal injury in diabetic db/db mice. In further experiments, all mice received uninephrectomy at 8 wk of age.
Time Course of Endogenous Vn and PAI-1
PAI-1 is synthesized and released in an active conformation with an inherently brief half-life in vivo of approximately 30 min.22 Binding to Vn stabilizes active PAI-1 and localizes it to its site of action.23,24 Thus, Vn acts as a protein co-factor that determines the protease inhibitory capacity of native PAI-1. To determine whether native Vn and mouse PAI-1 are present in diabetic mouse kidney, we conducted a time-course study. As shown in Figure 1, both Vn and mouse PAI-1 were significantly increased in glomeruli from db/db mice at 18 wk compared with normal control mice (P < 0.05). A further significant increase was seen between 18 and 22 wk. Thus, as diabetic nephropathy progresses, increased Vn with which the increased PAI-1 can bind is present, and endogenous, inhibitory PAI-1 with which the mutant, noninhibitory PAI-1 can compete is present.
Figure 1.
Time course of glomerular Vn and endogenous PAI-1 staining in diabetic db/db mice. Representative photomicrographs of glomeruli were from three mice at different ages. Polyclonal rabbit anti-mouse Vn antibody (1:300 dilution; provided by Emile de Heer, Department of Nephrology and Pathology, Leiden University Medical Center, Leiden, Netherlands) and rabbit anti-rat PAI-1 antibody (400 μg/ml dilution; American Diagnostica, Greenwich, CT) were used as the primary antibodies. FITC-conjugated swine anti-rabbit IgG (Dako Corp., Carpinteria, CA) was used as secondary antibody. Control slides treated with PBS instead of primary antibodies showed no staining. Data are from three mice at each group. *P < 0.05 versus uninephrectomized nondiabetic db/m control at 22 wk of age; **P < 0.05 versus uninephrectomized diabetic db/db mice at 18 wk of age. Magnification, ×400.
Dosing Regimen: Time Course of Disappearance of Injected PAI-1R
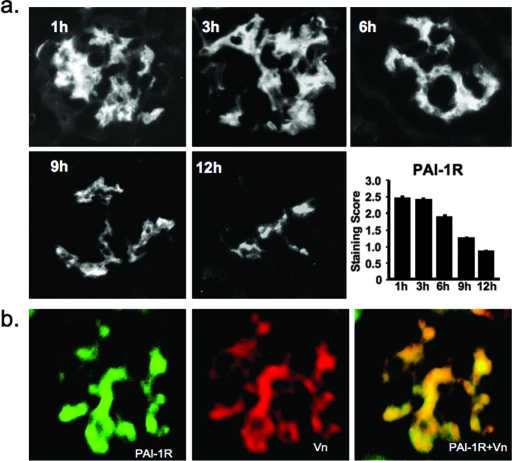
To determine whether intraperitoneally administered human PAI-1R targets to diabetic mouse kidney and how long it remains, we observed over time the disappearance of human PAI-1R from 20-wk diabetic glomeruli after one-time intraperitoneal injection. PAI-1R targets to diabetic glomeruli and is present there for at least 12 h (Figure 2A). Approximately half of the PAI-1R present at 1 h persists at 9 h. In the final protocol, mice were given twice-daily intraperitoneal injections of PAI-1R.
Figure 2.
(A) Time course of disappearance of injected PAI-1R from diabetic glomeruli in db/db mice at week 20. Representative photomicrographs of glomeruli from three mice at each time point that were administered an injection of PAI-1R at 100 μg/mouse intraperitoneally. A goat anti-human PAI-1 antibody (1:100; American Diagnostica) was used as the primary antibody, which was specific for human PAI-1 and did not stain mouse PAI-1. FITC-conjugated donkey anti-goat IgG (1:200 dilution; Jackson ImmunoResearch Laboratories, West Grove, PA) was applied as secondary antibody. (B) Co-localization of PAI-1R and Vn in diabetic glomeruli. A glomerulus from a db/db mouse at week 20 that was killed 3 h after PAI-1R injection. Staining for human PAI-1R (green) and mouse Vn (red). Double staining for PAI-1R and Vn (yellow). Injected PAI-1R co-localized with endogenous mouse Vn in the mesangium. Without PAI-1R injection, no staining for human PAI-1 was seen in the kidney. Magnification, ×400.
Dual immunostaining for PAI-1R (green) and Vn (red; Figure 2B) produced strong yellow staining when viewed with a double filter, indicating that injected PAI-1R was co-localized with mouse Vn in the db/db mouse diabetic glomerulus. These results are similar to those seen when PAI-1R was injected intravenously to nephritic rats after induction of anti–Thy-1 nephritis.17
Dose-Response Pilot Study
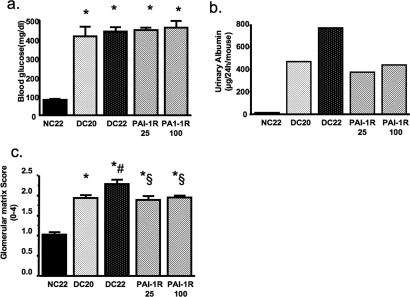
PAI-1R dosages of 25 and 100 μg/mouse had similar effects on blood glucose, urinary albumin, and glomerular matrix score (Figure 3). The low dosage of PAI-1R (equivalent to 0.5 mg/kg body wt) gave slightly better disease reduction than high-dosage PAI-1R. On the basis of these results, PAI-1R was administered at a dosage of 0.5 mg/kg body wt from week 20 to week 22.
Figure 3.
Dosage effect of PAI-1R on glucose levels (A), albuminuria (B), and glomerular histology (C) in diabetic db/db mice. *P < 0.05 versus uninephrectomized nondiabetic control db/m mice at 22 wk of age (NC; n = 9); #P < 0.05 versus uninephrectomized diabetic db/db mice at 20 wk of age (DC20; n = 5); §P < 0.05 versus uninephrectomized diabetic db/db mice at 22 wk of age, treated with PBS for 2 wk (DC22; n = 5). PAI-1R25, 22-wk diabetic mice treated with PAI-1R at 25 μg/mouse from weeks 20 to 22 (n = 7); PAI-1R100, 22-wk diabetic mice treated with PAI-1R at 100 μg/mouse from weeks 20 to 22 (n = 7).
Therapeutic Efficacy of PAI-1R
Systemic Parameters.
The baseline and final characteristics of the four groups of mice are presented in Table 1. All mice survived. Twenty- and 22-wk body weights of db/db mice were significantly greater than those of db/m controls. There was no significant gain in weight from weeks 20 to 22 in db/db mice. Diabetic mice remained hyperglycemic throughout the experimental period. The plasma glucose concentration and glycosylated hemoglobin levels were not changed by PAI-1R treatment (P > 0.05). Because of glucosuria, urine volumes were markedly increased in both db/db groups. Kidney weights were significantly greater in db/db mice. PAI-1R treatment had no effect on kidney weights in the db/db mice. Renal function measured as serum creatinine concentration and the creatinine clearance (Ccr) of the diabetic groups was identical to those of the nondiabetic group.
Table 1.
Parameters of the experimental groups of micea
| Parameter | db/m 22 Wk(n = 6) | db/db 20 Wk(n = 8) | db/db 22 Wk(n = 7) | db/db–PAI-1R 22 Wk(n = 8) |
|---|---|---|---|---|
| Body wt, initial (g) | 26.3 ± 1.08 | 60.07 ± 4.75b | 61.05 ± 4.75b | 62.30 ± 2.34b |
| Body wt. final (g) | 26.6 ± 0.93 | 62.70 ± 7.01b | 62.53 ± 3.12b | |
| Plasma glucose, initial (mg/dl) | 130.0 ± 11.1 | 422.25 ± 148.3b | 428.0 ± 106.7b | 431.0 ± 136.0b |
| Plasma glucose, final (mg/dl) | 123.1 ± 43.1 | 429.5 ± 109.0b | 437.3 ± 79.0b | |
| HbA1c (%) | 3.36 ± 0.32 | 9.02 ± 2.37b | 9.81 ± 2.12b | 8.73 ± 1.45b |
| Urine volume, initial (ml/d) | 1.55 ± 0.088 | 3.50 ± 0.763b | 4.71 ± 2.289b | 5.32 ± 3.038b |
| Urine volume, final (ml/d) | 1.66 ± 0.367 | 6.50 ± 1.74b | 6.33 ± 1.525b | |
| Kidney wt (mg) | 283.8 ± 20.2 | 358.6 ± 78.6b | 351.1 ± 31.2b | 324.6 ± 25.5b |
| Plasma creatinine (mg/dl) | 1.015 ± 0.30 | 0.854 ± 0.273 | 0.974 ± 0.315 | 1.045 ± 0.313 |
| Creatinine clearance (ml/min) | 0.225 ± 0.094 | 0.237 ± 0.129 | 0.181 ± 0.082 | 0.205 ± 0.081 |
Mice (nondiabetic db/m or diabetic db/db) were treated for 2 wk with either PBS or PAI-1R between 20 and 22 wk of age. Unless specified, parameters were recorded at the end of the experimental period (22 wk of age). HbA1c, glycosylated hemoglobin.
P < 0.05 versus db/m.
Proteinuria.
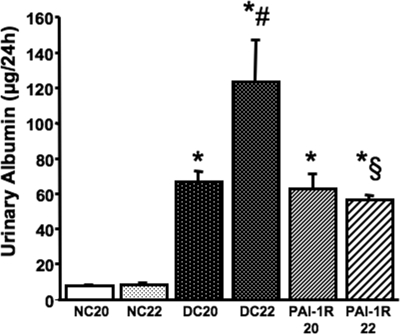
At the onset of intervention (20 wk of age), albumin excretion of db/db mice was identical and was significantly higher compared with db/m mice (Figure 4). Albumin excretion increased 196% between weeks 20 and 22 in PBS-treated db/db mice. This increase was totally prevented by PAI-1R treatment (Figure 4).
Figure 4.
Effect of PAI-1R on albuminuria in diabetic db/db mice from weeks 20 to 22. *P < 0.05 versus NC22; #P < 0.05 versus DC20; §P < 0.05 versus DC22. PAI-1R22, 22-wk diabetic mice treated with PAI-1R at 0.5 mg/kg body wt, intraperitoneally, twice daily from weeks 20 to 22.
Glomerular Histology.
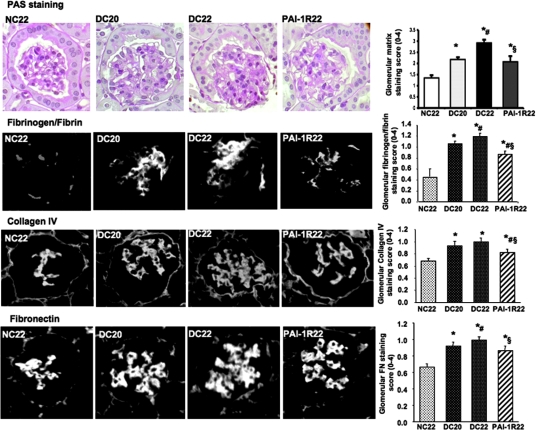
At the end of the study, the glomeruli of db/db mice demonstrated increased accumulation of PAS-positive matrix quantified by a computer-assisted color image analyzer, collagen IV, FN, and fibrinogen/fibrin in the mesangium compared with glomeruli of db/m mice (Figure 5). Increases in glomerular matrix staining between 20 and 22 wk were largely prevented by PAI-1R treatment.
Figure 5.
Effect of PAI-1R on glomerular matrix protein accumulation in diabetic db/db mice from weeks 20 to 22. For immunofluorescence staining, rabbit anti–type IV collagen (Rockland Immunochemicals, Gilbertsville, PA) and rabbit anti-rat FN (Chemicon, CA) were used as the primary antibodies. FITC-conjugated donkey anti-rabbit IgG (Jackson ImmunoResearch Laboratories) was used as the secondary antibody. FITC-conjugated rabbit anti-human fibrinogen/fibrin (Dako Corp.) was used directly to detect fibrinogen/fibrin. *P < 0.05 versus NC22; #P < 0.05 versus DC20; §P < 0.05 versus DC22. Magnification, ×400.
Collagen and FN Levels in Renal Cortex.
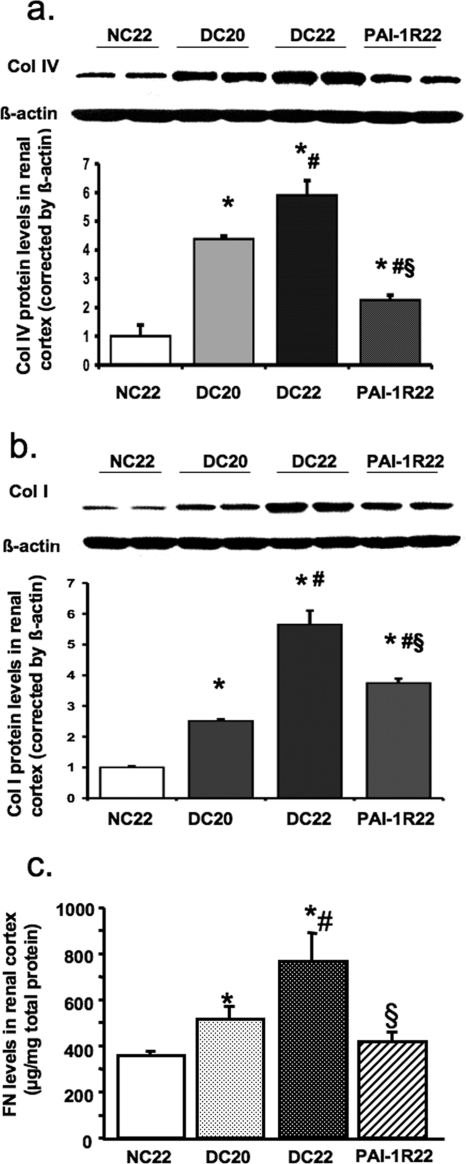
Levels of collagen IV, collagen I, and FN in renal cortex were significantly increased in db/db mice at week 20 and were further increased at week 22. Surprising, PAI-1R treatment reduced collagen IV and FN levels to below week-20 values (Figure 6, A and C). PAI-1R treatment retarded the increase of collagen I seen from 20 to 22 wk by 60% (Figure 6B).
Figure 6.
Effect of PAI-1R on collagens and FN production in renal cortex tissue in diabetic db/db mice from weeks 20 to 22. (A and B) Representative Western blots illustrate type IV collagen (Col IV; A) and type I collagen (Col I; B) protein expression. The immunostaining band was visualized by enhanced chemiluminescence (ECL) Western blotting detection reagents (Amersham Pharmacia Biotech, Little Chalfont, Buckinghamshire, UK). The densitometric intensity of β-actin staining detected by monoclonal mouse anti–β-actin IgG was adjusted for the protein loading equality. For comparison, this ratio was set at unity for normal control samples, and other lanes on the same gel were expressed as fold increase over this value. The respective graphs summarize the results of band density measurements. (C) FN content in renal cortex was detected by ELISA. *P < 0.05 versus NC22; #P < 0.05 versus DC20; §P < 0.05 versus DC22.
Renal mRNA Expression of TGF-β1, PAI-1, and Matrix Proteins.
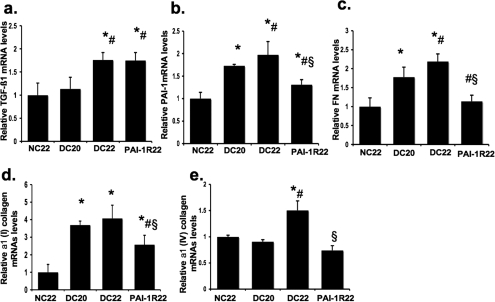
Renal TGF-β1 mRNA expression was mildly increased in db/db mice at week 20 but was significantly increased by 1.8-fold at week 22 compared with the nondiabetic group (Figure 7A). Treatment of PAI-1R had no effect on TGF-β1 mRNA levels. Renal PAI-1, FN, and α1(I) collagen mRNA levels were significantly increased in db/db mice at week 20 and were further increased at week 22 (Figure 7, B through D). PAI-1R treatment completely halted these increases (Figure 7, B through D), and the expression of FN and α1(I) collagen in the PAI-1R treated group was actually lower than that of the 20-wk diabetic control group. α1(IV) collagen mRNA expression in renal cortex tissue became significantly elevated at week 22 (Figure 7E). Treatment with PAI-1R virtually prevented the 1.6-fold increase in α1(IV) collagen gene expression in the db/db mice to levels lower than those seen in db/m mice (Figure 7E).
Figure 7.
Effect of PAI-1R on TGF-β1, PAI-1, and matrix proteins mRNA expression in renal cortex tissue in diabetic db/db mice from weeks 20 to 22. Expression of mRNA was determined by real-time reverse transcriptase–PCR. Changes in mRNA levels were determined by first correcting the amplification of β-actin for each sample. For comparison, this ratio was set at unity for normal control samples, and other groups were expressed as fold increase over this value. (A) Expression of TGF-β1 mRNA. (B) Expression of PAI-1 mRNA. (C) Expression of FN mRNA. (D) Expression of α1(I) collagen mRNA. (E) Expression of type α1(IV) collagen mRNA. *P < 0.05 versus NC22; #P < 0.05 versus DC20; §P < 0.05 versus DC22.
Plasmin Activity of Renal Cortex Was Decreased in db/db Mice.
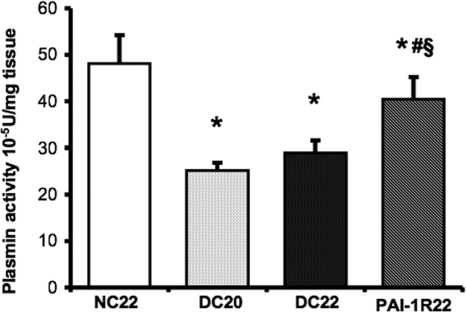
Diabetic renal cortex tissue exhibited a significant decrease in plasmin activity compared with nondiabetic mice at week 20 (25.14 ± 1.62 × 10⁻⁵ U/mg tissue versus 48.15 ± 6.05 × 10⁻⁵ U/mg tissue; P < 0.001; Figure 8), and no further reduction was seen at week 22. PAI-1R treatment significantly reversed the diabetes-induced decrease in renal plasmin activity (treated diabetes 40.46 ± 4.78 × 10⁻⁵ U/mg tissue versus untreated diabetes at week 22, 28.29 ± 2.70 × 10⁻⁵ U/mg tissue; P < 0.001).
Figure 8.
Effects of PAI-1R on plasmin activity in renal cortex tissue in diabetic db/db mice. Results were expressed as 10−5 U/mg tissue. *P < 0.05 versus NC22; #P < 0.05 versus DC20; §P < 0.05 versus DC22.
TGF-β1 Upregulation and Its Signaling in Renal Cortex of db/db Mice Were Reversed by PAI-1R.
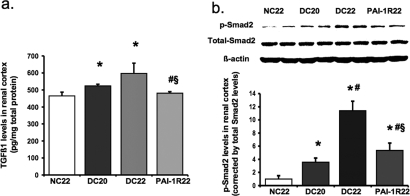
Consistent with the levels of TGF-β1 mRNA expression, the protein levels of TGF-β1 detected by ELISA in renal cortex were increased by 13% in db/db mice at week 20 and 16% at week 22 compared with db/m mice (P < 0.05; Figure 9A). PAI-1R administration decreased levels to below those seen in 20-wk diabetic control mice (P < 0.01; Figure 9A). Smad proteins are important intracellular transducers of TGF-β1 signaling.25 We asked whether the Smad pathway is activated in the diabetic kidney. Smad2 activation was significantly increased in db/db mice at week 20 (Figure 9B). A dramatic further increase, which was reduced 77% by PAI-1R treatment, was seen between week 20 and week 22. Blots for total Smad2 or β-actin signals confirmed that gels were equally loaded.
Figure 9.
Effect of PAI-1R on TGF-β1 protein levels and Smad2 signaling in renal cortex tissue in diabetic db/db mice. (A) Total TGF-β1 protein levels were measured by ELISA. (B) Representative Western blots illustrate phosphorylated Smad2 (p-Smad2), total Smad2, and β-actin protein expression. The immunostaining band was visualized by ECL Western blotting detection reagents. The densitometric intensity of total Smad2 staining was adjusted for the protein loading equality. For comparison, this ratio was set at unity for normal control samples, and other lanes on the same gel were expressed as fold increase over this value. The respective graph summarizes the results of band density measurements. *P < 0.05 versus NC22; #P < 0.05 versus DC20; §P < 0.05 versus DC22.
DISCUSSION
It has been proposed that fewer nephrons increase the propensity for development of progressive loss of renal function after renal injury.26,27 This hypothesis was confirmed by examination of the number of glomeruli in patients with essential hypertension28; therefore, uninephrectomy has been used experimentally to enhance the development of kidney disease in the models of types 1 and 2 diabetes, chronic renal failure, and progressive mesangioproliferative nephropathy.29–34 Data obtained in this study confirmed that uninephrectomy performed at 8 wk of age renders the kidney of db/db mice more susceptible to diabetes-induced damage. The mechanisms through which uninephrectomy exacerbates renal injury in diabetes have not been clarified, but it is likely that enhanced renal hyperfiltration plays an important role. The Ccr levels of db/db mice are usually higher than those of db/m mice.35 With uninephrectomy, the Ccr levels in either db/m or db/db mice are significantly increased as compared with those of db/m mice with two kidneys.35 After 20 wk of sustained hyperglycemia and renal hyperfiltration, kidneys from untreated uninephrectomized diabetic db/db mice exhibit a significant increase in PAI-1 in glomeruli, diffuse glomerulosclerosis as determined by accumulation of mesangial matrix encroaching the normal network, increased expression of mRNA encoding TGF-β1, α1 (I) collagen, α1(IV) collagen, and FN and progressive worsening of albuminuria. All injuries in glomeruli are further increased at the age of 22 wk. Consistent with previous observations in the db/db mouse, there were only slight pathologic changes in the tubulointerstitial compartment (data not shown). Our data clearly show a remarkable 2-wk window of progression in uninephrectomized diabetic db/db mice. In contrast to the obvious outcomes on urinary albumin and histologic changes in db/db mice, significant changes were not observed in serum creatinine levels, which are generally considered to be markers of renal function. Similarly, the Ccr data were inconclusive, although these levels in uninephrectomized db/db or db/m mice were significantly higher than those in db/m mice without uninephrectomy. These results are consistent with reports by other groups35,36 and may still reflect hyperfiltration, an early symptom of diabetic nephropathy.
This study evaluated the role of the renal plasminogen/plasmin/PAI-1 system in the progression of the structural and functional changes of diabetic nephropathy established previously by assessing the response of db/db mice to a short time treatment with a noninhibitory mutant PAI-1 (PAI-1R). As expected, the diabetic renal cortex tissue exhibited significant decreases in plasmin activity. In addition, the gradual increases in glomerular PAI-1 and fibrinogen/fibrin deposition suggested that the net effect of the plasminogen/plasmin/PAI-1 system in diabetes is a reduced capacity to generate plasmin activity. Administration of the mutant PAI-1R that binds Vn deposited in diabetic glomeruli significantly reversed the diabetes-induced decrease in plasmin activity and resulted in marked beneficial effects on renal structure. Despite persistent hyperglycemia, the progression of mesangial matrix expansion was prevented, and the increase in albuminuria was halted. These findings strongly suggest that progression to overt nephropathy was prevented by PAI-1R. Because the renal function determined by serum creatinine levels in all groups remained within normal range, it is difficult to draw a conclusion regarding the effect of PAI-1R on these parameters in db/db mice.
Several mechanisms are likely involved in the therapeutic effects of PAI-1R in this study. Although not proved here, it is likely that much of the therapeutic effect is due to the increased plasmin leading to enhanced degradation of the pathologic ECM; however, PAI-1R also effectively prevented the increases seen between weeks 20 and 22 in PAI-1, FN, and types I and IV collagen but not the increase in TGF-β1 mRNA expression. Although it is possible that PAI-1R–induced increases in plasmin somehow feed back on expression of PAI-1, FN, and types I and IV collagen mRNA expression, it is also possible that PAI-1R has plasmin-independent effects on disease severity, as seems to be the case in experimental glomerulonephritis.17,18
Of these plasmin-independent effects are reports suggesting that PAI-1, like other fibrotic players, may signal directly to regulate TGF-β expression. Supporting this idea are findings that PAI-1–deficient mice had decreased renal TGF-β mRNA expression and protein levels after unilateral ureteral obstruction or diabetes induction compared with wild-type mice.15,37 Nicholas et al.15 first reported that recombinant PAI-1 increased TGF-β protein production by mesangial cells. That PAI-1 rapidly and significantly stimulates TGF-β seems unrelated to its inhibitory effects on matrix turnover. This raises the possibility that PAI-1R binding to Vn at site of diabetic kidney may manipulate the activity of endogenous PAI-1 by effectively competing for Vn binding sites and lead to native PAI-1 inactivation, thereby decreasing renal TGF-β1 concentration and signaling. Because TGF-β induces PAI-1, FN, and collagen, a decrease in TGF-β protein and subsequent signaling might lead to decrease in PAI-1, FN, and collagen mRNA, as we observed.
It is important to emphasize the magnitude of the therapeutic effect seen here with a short, 2-wk course of PAI-1R administration. A number of disease measures were actually lower than in the 20-wk diabetic control group. This raises the question of whether treating established disease for longer or treating animals before overt diabetic nephropathy is present may, in fact, reverse or prevent renal disease.
In conclusion, this human mutant PAI-1 aimed at reducing endogenous PAI-1 activity may have promise in slowing the progression of glomerulosclerosis resulting from type 2 diabetes.
CONCISE METHODS
Reagents
Unless otherwise indicated, materials and chemicals were purchased from Sigma (St. Louis, MO).
Animals
Diabetic db/db mice and their lean nondiabetic db/m littermates were purchased from the Jackson Laboratory (Bar Harbor, ME) and were housed in accordance with the National Institutes of Health Guide for the Care and Use of Laboratory Animals. The animal experiments were approved by the Animal Care Committee of University of Utah. The db/db mice were determined to be diabetic by the vendor on the basis of appearance of obesity at approximately 5 wk of age and were hyperglycemic when tested after arrival in our laboratory at week 7. Mice were subjected to right nephrectomy under anesthesia at week 8 to hasten the development of diabetic nephropathy.
Experimental Design
Four pilot experiments were carried out to perfect this model for therapeutic testing. First, for determination of the effect of uninephrectomy on the progression of glomerular injury in db/db diabetic mice, db/db and db/m mice underwent uninephrectomy or sham operation at the age of 8 wk, and markers of fibrosis were used as measures of disease progression at week 20. Second, three mice in each group of uninephrectomized nondiabetic control db/m and diabetic db/db mice were killed at weeks 18, 20, and 22. Cortical tissue was stained for endogenous Vn and PAI-1 as described previously.17 Third, for determination of whether intraperitoneal PAI-1R administration targets to diabetic mouse kidney by binding to Vn and how long it remains there, five groups of three db/db mice received intraperitoneal PAI-1R injection (100 μg/per mouse) at week 20. Groups were killed at each of five time points from 1 to 12 h after administration. Cortical tissue was used for immunostaining of PAI-1R and dual immunostaining for PAI-1R and Vn as described previously.17 Fourth, for determination of the effective dosage range of PAI-1R in db/db diabetic mice, dosages of human PAI-1R from 25 to 100 μg per mouse were administered twice daily to five groups of five to nine diabetic db/db mice from weeks 20 to 22. On the basis of these pilot results, a further experiment was conducted.
Groups of six to eight uninephrectomized mice were assigned and treated as db/m normal mice at 22 wk of age (n = 6), untreated 20-wk db/db mice (n = 8), 22-wk db/db mice treated with PBS for 2 wk (n = 7), and 22-wk db/db mice treated with PAI-1R for 2 wk (n = 8). The tail blood glucose level was determined by a blood glucose meter (Glucometer Elite XL; Bayer HealthCare, Elkhart, IN). Twenty-four-hour urine collections for measurements of albumin and creatinine were obtained from each mouse after placement in metabolic cages. Urine albumin was measured in a competitive ELISA (Bethyl Laboratories, Montgomery, TX). Urinary creatinine was measured by DC 2000+ microalbumin/creatinine reagent kit (Bayer HealthCare).
Mice were killed under isoflurane anesthesia. Blood samples were taken by heart puncture for glycosylated hemoglobin, and plasma creatinine measurement was detected by DC 2000+ Hemoglobin A1c reagent kit (Bayer HealthCare) and a colorimetric assay. Kidneys were perfused through the heart with 30 ml of cold PBS and then excised. Renal cortex was harvested by dissection and either snap-frozen in 2-methylbutane at −80°C or fixed in 10% neutralized formalin for immunohistologic examination. In addition, pieces of cortex were stored in liquid nitrogen for Western blot and plasmin activity measurement or treated with TRIzol Reagent (GibcoBRL, Gaithersburg, MD) for simultaneous isolation of RNA or treated with 100 mM NaCl and 20 mM HEPES to be sonicated for 30 s three times on ice and centrifuged at a high speed for 15 min at 4°C. The supernatant was then collected and stored at −80°C for FN and TGF-β1 ELISA and protein measurement by a BCA protein assay kit (Pierce, Rockford, IL). FN and TGF-β1 were measured as described previously.38,39
Histologic Analyses
All microscopic examinations were performed in a blinded manner. Three-micrometer sections of paraffin-embedded tissues were stained with PAS. Glomerular matrix expansion was evaluated in 20 glomeruli from each mouse; the percentage of mesangial matrix occupying each glomerulus was rated on a scale from 0 to 4, as described previously40: 0, 0%; 1, 25%; 2, 50%; 3, 75%; and 4, 100%. For comparison of this analysis with a computer-assisted method, the images (×400 magnification) of 20 random glomeruli per slide were captured using a Nikon D50 digital camera (Inkley's-Ritz Camera, www.ritzcamera.com, Salt Lake City, UT; Nikon Capture 4 Ver. 4.3, Nikon Inc., Melville, NY), and the PAS-positive area in each glomerulus was quantified using a computer-assisted color image analysis system (ImageJ 1.38 for Windows; National Institutes of Health http://rsb.info.nigh.gov).41 The PAS-positive material area in the mesangium was divided by the glomerular tuft area to obtain the rates of mesangial matrix as indicated previously. Although both methods yield similar results, those obtained with the computer are slightly higher (Figure 5). Immunofluorescent staining for matrix proteins was performed on frozen sections as described previously.17 Intraglomerular deposition of fibrinogen/fibrin, FN, and type IV collagen was quantified by scoring 20 randomly selected glomeruli on a scale from 0 to 4 as already described.
Western Blot Analysis
Equal amounts of renal cortex tissue (15 mg) from each mouse of each group were pooled and homogenized in lysis buffer (Cell Signaling Technology, Beverly, MA) with 1% NP40, 1 mM PMSF, and 1 tablet/5 ml protease inhibitor mix (Complete, Mini; Roche Diagnostics Corp., Indianapolis, IN). Protein samples (20 μg, determined by the BCA protein assay) were separated by electrophoresis in 10% Tris-glycine gel (Invitrogen, Carlsbad, CA) and transferred to the Immobilon-P transfer membrane (Millipore Corp., Bedford, MA). The protein levels of types I and IV collagen and phosphorated or total Smad2 in renal cortex tissue were measured using rabbit anti-collagen α type IV IgG, goat anti-collagen type I IgG (Santa Cruz Biotechnology, Santa Cruz, CA), rabbit anti–phospho-specific Smad2 IgG (Calbiochem-Novabiochem Corp., San Diego, CA), and goat anti–total Smad2 IgG (Santa Cruz Biotechnology). The immunostaining band was visualized and quantified as described previously.42
RNA Preparation and Real-Time Reverse Transcriptase–PCR
Total RNA was extracted immediately from renal cortex tissue using TRIzol Reagent (GibcoBRL, Gaithersburg, MD) according to the manufacturer's instructions. Two micrograms of total RNA was reverse-transcribed using the superscript III first-strand synthesis system for reverse transcriptase–PCR kit (Invitrogen). Real-time reverse transcriptase–PCR was performed using a SYBR green dye I (Applied Biosystems, Foster City, CA) with the ABI 7900 Sequence Detection System (PE Applied Biosystems). cDNA was first denatured at 95°C for 15 min and then amplified through 40 amplification cycles according to the manufacturer's protocol as follows: denatured at 95°C for 15 s and annealed/extended at 60°C for 30 s. Fluorescence signals were recorded in each cycle. Relative quantification of gene expression was carried out using the standard curve method and analyzed with RQ-manager 1.2. (ABI 7900 Sequence Detection System; Applied Biosystems). Samples were run in triplicate in separate tubes to permit quantification of the target gene normalized to β-actin used for equal loading. Sequences of primers used are listed in Table 2. The specificity of the PCR products was confirmed on a 1.5% agarose gel by showing a specific single band with the expected size.
Table 2.
Primers used for real time reverse transcriptase–PCR
| Gene | Primer | Location (Complementary to Nucleotides) | Sequence 5′-3′ |
|---|---|---|---|
| Mouse TGF-β 1 (NM_011577.1) | Forward | 1446 to 1467 | TGA GTG GCT GTC TTT TGA CG |
| Reverse | 1719 to 1738 | TCT CTG TGG AGC TGA AGC AA | |
| Mouse PAI-1 (NM_008871.1) | Forward | 1122 to 1141 | AGT CTT TCC GAC CAA GAG CA |
| Reverse | 1313 to 1330 | ATC ACT TGC CCC ATG AAG AG | |
| Mouse FN (NM_010233.1) | Forward | 7790 to 7807 | CCG TGG GAT GTT TGA GAC |
| Reverse | 7998 to 8015 | GGC AAA AGA AAG CAG AGG | |
| Mouse α 1(I) collagen (NM_007742.3) | Forward | 3765 to 3784 | CAC CCT CAA GAG CCT GAG TC |
| Reverse | 4014 to 4033 | GCT TCT TTT CCT TGG GGT TC | |
| Mouse α 1(IV) collagen (NM_009931.1) | Forward | 4629 to 4648 | ATG CCC TTT CTC TTC TGC AA |
| Reverse | 4861 to 4880 | GAA GGA ATA GCC GAT CCA CA | |
| Mouse β-actin (NM_009606.1) | Forward | 857 to 876 | GCT CTT TTC CAG CCT TCC TT |
| Reverse | 1132 to 1151 | TGA TCC ACA TCT GCT GGA AG |
Plasmin Activity of Renal Cortex Tissue
Ten micrograms of each renal cortex tissue was homogenized in 0.5 ml of 50 mM Tris buffer with 1 M NaCl and 0.1% Triton X-100 (pH 8.2) two times on ice by sonication. The supernatant was applied for plasmin activity measurement immediately as described previously.17
Statistical Analyses
Data are expressed as means ± SD. Groups were analyzed by one-way ANOVA, and the Student-Newman-Keuls multiple comparisons test was used to compare difference among the groups. P < 0.05 was considered statistically significant.
DISCLOSURES
None.
Acknowledgments
This work was supported by National Institutes of Health grant DK 60508 (N.A.N.).
These data were presented in part at the annual meeting of American Society of Nephrology; November 14 through 19, 2003; San Diego, CA.
We thank Linda Hoge for excellent technical assistance with these studies.
Published online ahead of print. Publication date available at www.jasn.org.
REFERENCES
- 1.Steffes MW, Osterby R, Chavers B, Mauer SM: Mesangial expansion as a central mechanism for loss of kidney function in diabetic patients. Diabetes 38: 1077–1081, 1989 [DOI] [PubMed] [Google Scholar]
- 2.Osterby R, Parving HH, Hommel E, Jorgensen HE, Lokkegaard H: Glomerular structure and function in diabetic nephropathy: Early to advanced stages. Diabetes 39: 1057–1063, 1990 [DOI] [PubMed] [Google Scholar]
- 3.Schnaper HW: Balance between matrix synthesis and degradation: A determinant of glomerulosclerosis. Pediatr Nephrol 9: 104–111, 1995 [DOI] [PubMed] [Google Scholar]
- 4.Stetler-Stevenson WG: Dynamics of matrix turnover during pathologic remodeling of the extracellular matrix. Am J Pathol 148: 1345–1350, 1996 [PMC free article] [PubMed] [Google Scholar]
- 5.Mignatti P: Extracellular matrix remodeling by metalloproteinases and plasminogen activators. Kidney Int 47: S12–S14, 1995 [PubMed] [Google Scholar]
- 6.Geiger M, Binder BR: Plasminogen activation in diabetes mellitus: Kinetics of plasmin formation with tissue plasminogen activator and plasminogen from individual diabetic donors and with in vitro glucosylated plasminogen. Enzyme 40: 149–157, 1988 [PubMed] [Google Scholar]
- 7.Fisher EJ, Mclennan SV, Yue DK, Turtle JR: Displacement of tissue bound plasminogen by glucose: A possible mechanism in the pathogenesis of diabetic nephropathy. Endocrinol Metab 4: 371–376, 1997 [Google Scholar]
- 8.Auwerx J, Bouillon R, Collen D, Geboers J: Tissue-type plasminogen activator antigen and plasminogen activator inhibitor in diabetes mellitus. Arteriosclerosis 8: 68–72, 1988 [DOI] [PubMed] [Google Scholar]
- 9.Bosnyak Z, Forrest KY, Maser RE, Becker D, Orchard TJ: Do plasminogen activator inhibitor (PAI-1) or tissue plasminogen activator PAI-1 complexes predict complications in type 1 diabetes: The Pittsburgh Epidemiology of Diabetes Complications Study. Diabet Med 20: 147–151, 2003 [DOI] [PubMed] [Google Scholar]
- 10.Eliasson MC, Jansson JH, Lindahl B, Stegmayr B: High levels of tPA antigen precede the development of type 2 diabetes in a longitudinal population study: The Northern Sweden MONICA Study. Cardiovasc Diabetol 2: 19, 2003 [DOI] [PMC free article] [PubMed] [Google Scholar]
- 11.Fisher EJ, McLennan SV, Yue DK, Turtle JR: High glucose reduces generation of plasmin activity by mesangial cells. Microvasc Res 53: 173–178, 1997 [DOI] [PubMed] [Google Scholar]
- 12.McLennan SV, Fisher E, Martell SY, Death AK, Williams P, Lyons JG, Yue DK: Effects of glucose on matrix metalloproteinase and plasmin activities in mesangial cells: Possible role in diabetic nephropathy. Kidney Int 77[Suppl]: S81–S87, 2000 [DOI] [PubMed] [Google Scholar]
- 13.Miskin R, Axelrod JH, Griep AE, Lee E, Belin D, Vassalli JD, Westphal H: Human and murine urokinase cDNAs linked to the murine alpha A-crystallin promoter exhibit lens and non-lens expression in transgenic mice. Eur J Biochem 190: 31–38, 1990 [DOI] [PubMed] [Google Scholar]
- 14.Miskin R, Levinger S: Diabetic mice expressing transgenic urokinase in the retina: Limited thickening if retinal capillary basement membrane. In: Proceedings of 3rd International Workshop on Molecular and Cellular Biology of Plasminogen Activation, p 71, Elisnore, Denmark, May 8–13, 1991
- 15.Nicholas SB, Aguiniga E, Ren Y, Kim J, Wong J, Govindarajan N, Noda M, Wang W, Kawano Y, Collins A, Hsueh WA: Plasminogen activator inhibitor-1 deficiency retards diabetic nephropathy. Kidney Int 67: 1297–1307, 2005 [DOI] [PubMed] [Google Scholar]
- 16.Collins SJ, Alexander SL, Lopez-Guisa JM, Cai X, Maruvada R, Chua SC, Zhang G, Okamura DM, Matsuo S, Eddy AA: Plasminogen activator inhibitor-1 deficiency has renal benefits but some adverse systemic consequences in diabetic mice. Nephron Exp Nephrol 104: e23–e34, 2006 [DOI] [PubMed] [Google Scholar]
- 17.Huang Y, Haraguchi M, Lawrence DA, Border WA, Yu L, Noble NA: A mutant, noninhibitory plasminogen activator inhibitor type 1 decreases matrix accumulation in experimental glomerulonephritis. J Clin Invest 112: 379–388, 2003 [DOI] [PMC free article] [PubMed] [Google Scholar]
- 18.Huang Y, Border WA, Lawrence DA, Noble NA: Noninhibitory PAI-1 enhances plasmin-mediated matrix degradation both in vitro and in experimental nephritis. Kidney Int 70: 515–522, 2006 [DOI] [PubMed] [Google Scholar]
- 19.Sharma K, McCue P, Dunn SR: Diabetic kidney disease in the db/db mouse. Am J Physiol Renal Physiol 284: F1138–F1144, 2003 [DOI] [PubMed] [Google Scholar]
- 20.Parving HH, Lehnert H, Brochner-Mortensen J, Gomis R, Andersen S, Arner P: The effect of irbesartan on the development of diabetic nephropathy in patients with type 2 diabetes. N Engl J Med 345: 870–878, 2001 [DOI] [PubMed] [Google Scholar]
- 21.Gilbert RE, Cox A, Dziadek M, Cooper ME, Jerums G: Extracellular matrix and its interactions in the diabetic kidney: A molecular biological approach. J Diabetes Complications 9: 252–254, 1995 [DOI] [PubMed] [Google Scholar]
- 22.Hekman CM, Loskutoff DJ: Endothelial cells produce a latent inhibitor of plasminogen activators that can be activated by denaturants. J Biol Chem 260: 11581–11887, 1985 [PubMed] [Google Scholar]
- 23.Lawrence DA, Palaniappan S, Stefansson S, Olson ST, Francis-Chmura AM, Shore JD, Ginsburg D: Characterization of the binding of different conformational forms of plasminogen activator inhibitor-1 to vitronectin. J Biol Chem 272: 7676–7680, 1997 [DOI] [PubMed] [Google Scholar]
- 24.Zhou A, Huntington JA, Pannu NS, Carrell RW, Read RJ: How vitronectin binds PAI-1 to modulate fibrinolysis and cell migration. Nat Struct Biol 10: 541–544, 2003 [DOI] [PubMed] [Google Scholar]
- 25.Huang Y, Border WA, Noble NA: Perspectives on blockade of TGFbeta overexpression. Kidney Int 69: 1713–1714, 2006 [DOI] [PubMed] [Google Scholar]
- 26.Brenner BM, Garcia DL, Anderson S: Glomeruli and blood pressure: Less of one, more the other? Am J Hypertens 1: 335–347, 1988 [DOI] [PubMed] [Google Scholar]
- 27.Gross ML, Amann K, Ritz E: Nephron number and renal risk in hypertension and diabetes. J Am Soc Nephrol 16[Suppl 1]: S27–S29, 2005 [DOI] [PubMed] [Google Scholar]
- 28.Keller G, Zimmer G, Mall G, Ritz E, Amann K: Nephron number in patients with primary hypertension. N Engl J Med 348: 101–108, 2003 [DOI] [PubMed] [Google Scholar]
- 29.Benigni A, Zoja C, Corna D, Zatelli C, Conti S, Campana M, Gagliardini E, Rottoli D, Zanchi C, Abbate M, Ledbetter S, Remuzzi G: Add-on anti-TGF-beta antibody to ACE inhibitor arrests progressive diabetic nephropathy in the rat. J Am Soc Nephrol 14: 1816–1824, 2003 [DOI] [PubMed] [Google Scholar]
- 30.Bower G, Brown DM, Steffes MW, Vernier RL, Mauer SM: Studies of the glomerular mesangium and the juxtaglomerular apparatus in the genetically diabetic mouse. Lab Invest 43: 333–341, 1980 [PubMed] [Google Scholar]
- 31.Sato Y, Iwase M, Wakisaka M, Yoshizumi H, Nunoi K, Yoshinari M, Fujishima M: Renoprotective effect of enalapril in uninephrectomized spontaneously hypertensive rats with neonatal streptozotocin-induced diabetes. Diabetes Res Clin Pract 29: 153–161, 1995 [DOI] [PubMed] [Google Scholar]
- 32.Woods LL, Weeks DA, Rasch R: Hypertension after neonatal uninephrectomy in rats precedes glomerular damage. Hypertension 38: 337–342, 2001 [DOI] [PubMed] [Google Scholar]
- 33.Hamar P, Kokeny G, Liptak P, Krtil J, Adamczak M, Amann K, Ritz E, Gross ML: The combination of ACE inhibition plus sympathetic denervation is superior to ACE inhibitor monotherapy in the rat renal ablation model. Nephron Exp Nephrol 105: e124–e136, 2007 [DOI] [PubMed] [Google Scholar]
- 34.Cheng QL, Orikasa M, Morioka T, Kawachi H, Chen XM, Oite T: Progressive renal lesions induced by administration of monoclonal antibody 1-22-3 to unilaterally nephrectomized rats. Clin Exp Immunol 102: 181–185, 1995 [DOI] [PMC free article] [PubMed] [Google Scholar]
- 35.Sugaru E, Nakagawa T, Ono-Kishino M, Nagamine J, Tokunaga T, Kitoh M, Hume WE, Nagata R, Taiji M: SMP-534 ameliorates progression of glomerular fibrosis and urinary albumin in diabetic db/db mice. Am J Physiol Renal Physiol 290: F813–F820, 2006 [DOI] [PubMed] [Google Scholar]
- 36.Park CW, Zhang Y, Zhang X, Wu J, Chen L, Cha DR, Su D, Hwang MT, Fan X, Davis L, Striker G, Zheng F, Breyer M, Guan Y: PPARalpha agonist fenofibrate improves diabetic nephropathy in db/db mice. Kidney Int 69: 1511–1517, 2006 [DOI] [PubMed] [Google Scholar]
- 37.Oda T, Jung YO, Kim HS, Cai X, Lopez-Guisa JM, Ikeda Y, Eddy AA: PAI-1 deficiency attenuates the fibrogenic response to ureteral obstruction. Kidney Int 60: 587–596, 2001 [DOI] [PubMed] [Google Scholar]
- 38.Rennard SI, Berg R, Martin GR, Foidart JM, Robey PG: Enzyme-linked immunoassay (ELISA) for connective tissue components. Anal Biochem 104: 205–214, 1980 [DOI] [PubMed] [Google Scholar]
- 39.Yu L, Border WA, Anderson I, McCourt M, Huang Y, Noble NA: Combining TGF-β inhibition and angiotensin II blockade results in enhanced anti-fibrotic effect. Kidney Int 66: 1774–1784, 2004 [DOI] [PubMed] [Google Scholar]
- 40.Yamamoto T, Noble NA, Miller DE, Border WA: Sustained expression of TGF-b1 underlies development of progressive kidney fibrosis. Kidney Int 45: 916–927, 1994 [DOI] [PubMed] [Google Scholar]
- 41.Abramoff WS, Magelhaes PJ, Ram SJ: Image processing with ImageJ. Biophotonics International 11: 36–42, 2004 [Google Scholar]
- 42.Huang Y, Wongamorntham S, Kasting J, McQuillan D, Owens RT, Yu L, Noble NA, Border W: Renin increases mesangial cell transforming growth factor-beta1 and matrix proteins through receptor-mediated, angiotensin II-independent mechanisms. Kidney Int 69: 105–113, 2006 [DOI] [PubMed] [Google Scholar]


