Abstract
Chronic hypoxia in the renal parenchyma is thought to induce epithelial-to-mesenchymal transition (EMT), leading to fibrogenesis and ultimately end-stage renal failure. Biliverdin reductase, recently identified as a serine/threonine/tyrosine kinase that may activate phosphatidylinositol 3-kinase (PI3K) and Akt, is upregulated in response to reactive oxygen species that may accompany hypoxia. We investigated this potential role of biliverdin reductase in hypoxia-induced renal tubular EMT. Expression of biliverdin reductase was upregulated in a human proximal tubule cell line (HK-2) cultured in hypoxic conditions (1% O2), and this was accompanied by reduced expression of E-cadherin and increased expression of the mesenchymal marker vimentin. Inhibiting PI3K reversed these changes, consistent with EMT. In normoxic conditions, overexpression of biliverdin reductase promoted similar characteristics of EMT, which were also reversed by inhibiting PI3K. Furthermore, using small interfering RNA (siRNA) to knockdown biliverdin reductase, we demonstrated that the enzyme associates with phosphorylated Akt and mediates the hypoxia-induced EMT phenotype. In vivo, expression of biliverdin reductase increased in the tubular epithelia of 5/6-nephrectomized rats, and immunohistochemistry of serial sections demonstrated similar localization of phosphorylated Akt and biliverdin reductase. In conclusion, biliverdin reductase mediates hypoxia-induced EMT through a PI3K/Akt-dependent pathway.
Biliverdin reductase (BVR) is an evolutionarily conserved soluble enzyme found in various species.1,2 Initially, BVR was solely considered a reductase that converts biliverdin to bilirubin in the heme degradation pathway.3,4 However, recently, BVR was identified as a serine/threonine/tyrosine kinase5,6 that modulates signal transduction pathways2 and regulates gene expression.7–10 Through analysis of the primary and secondary structures of BVR, Maines et al. determined that it has two potential Src homology2 (SH2) protein docking sites that could interact with the SH2 domain-containing protein PI3K.2,6,11 These features suggest that BVR is a potential activator of PI3K, which may bind PI3K like a Src family member. The downstream effector of PI3K is the oncogenic serine/threonine kinase Akt, which represses transcription of the cell adhesion molecule E-cadherin.12 This transcriptional repression initiates the conversion of epithelial cells to mesenchymal cells.12,13 Thus, it is intriguing to speculate that BVR may cause epithelial-to-mesenchymal transition via the PI3K/Akt pathway.
BVR is also an oxidative stress protein that is activated in response to free radicals.5,7,14 Reactive oxygen species, especially hydroxyl radicals, elicit increases in the expression of BVR protein in vivo and in vitro.7,15 Accumulating evidence indicates that the formation of hydroxyl radicals is stimulated by hypoxia,16–18 suggesting that hypoxia can upregulate the expression of BVR. Recent studies demonstrate that chronic hypoxia-induced EMT is a final common pathway to end-stage renal failure.19,20 However, the mechanisms underlying hypoxia-induced renal fibrogenesis are not fully clear. Considering the known features of BVR, we hypothesized that BVR plays an important role in hypoxia-induced renal tubular EMT. In the study presented here, we characterized the effect of BVR on the hypoxia-induced tubular EMT and investigated the BVR pathways that are involved.
Results
Hypoxia Increases the Expression of BVR In Vitro
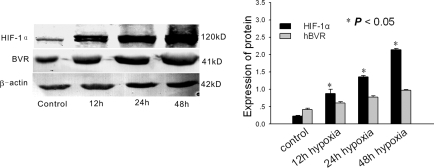
We induced hypoxia in vitro by incubating HK-2 cells in 1% O2 and 5% CO2 from 12 to 48 h. Twelve hours after hypoxic stimulation human BVR (hBVR) was markedly upregulated (Figure 1). hBVR remained upregulated for more than 48 h and was consistent with the increase in hypoxia-inducible factor 1α (HIF-1α; Figure 1). In normoxic control cells there was little expression of hBVR and HIF-1α (Figure 1).
Figure 1.
Western blot analysis of hypoxia-inducible factor 1α (HIF-1α) and human biliverdin reductase (hBVR) in HK-2 cells after 12, 24, and 48 h of hypoxia. A representative blot from four independent experiments is shown. The histogram shows the average volume density corrected for the loading control, β-actin (n = 4). *P < 0.05 compared with normoxic controls.
hBVR Induces EMT in hBVR-Transfected HK-2 Cells
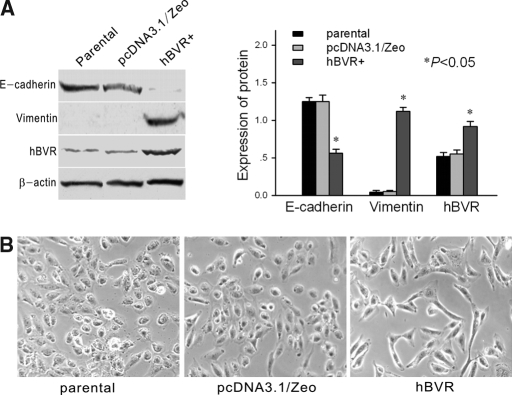
There was no difference in protein expression between parental cells and cells transfected with pcDNA3.1/Zeo empty vector–controls for hBVR-transfected cells (Figure 2A). Expression of the hBVR protein was 1.6-fold greater in cells transfected with the hBVR gene compared with control cells (Figure 2A). Light-inverted microscopic examination revealed that parental cells and empty vector-transfected cells formed a cobblestone-like monolayer, a typical epithelial shape. hBVR-transfected cells also formed an epithelial monolayer, but there were larger spaces between cells, and the cells were elongated in shape and larger than control cells (Figure 2B). E-cadherin, an epithelial marker, was downregulated in hBVR-transfected cells compared with parental cells and empty vector-transfected cells (Figure 2A). In contrast, the protein vimentin, a mesenchymal marker, was upregulated in hBVR-transfected cells as compared with control cells (Figure 2A). Confocal laser microscopy demonstrated that E-cadherin was linearly localized at cell borders in parental cells and empty vector-transfected cells (Figure 3C (I and V)). In hBVR-transfected cells, E-cadherin formed a zipper-like pattern instead of a linear pattern (Figure 3 C (II)).
Figure 2.
(A) Western blot analysis of E-cadherin, vimentin, and hBVR in parental cells, pcDNA3.1/Zeo empty vector-transfected cells, and hBVR-transfected cells. A representative blot from four independent experiments is shown. The histogram shows the average volume density corrected for the loading control, β-actin (n = 4). *P < 0.05 compared with normoxic controls. (B) Morphologic changes in cells. Both parental and pcDNA3.1/Zeo empty vector-transfected cells showed a typical cuboidal epithelial shape, whereas hBVR-transfected cells were elongated in shape and larger than control cells, consistent with the morphology of myofibroblasts. Magnification, ×200.
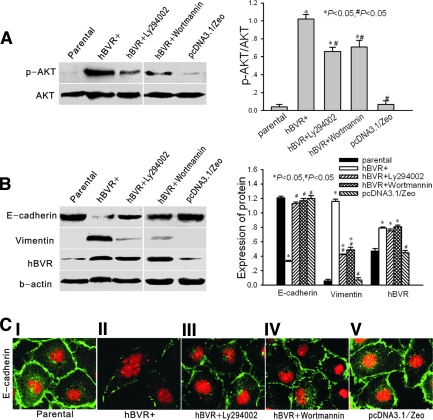
Figure 3.
(A) Western blot analysis of the phosphorylation status of Akt in parental cells, hBVR-transfected cells, Ly294002-treated hBVR-transfected cells, wortmannin-treated hBVR-transfected cells, and pcDNA3.1/Zeo empty vector-transfected cells. (B) Western blot analysis of E-cadherin, vimentin, and hBVR in the same groups shown in (A). In both panels, a representative blot of four independent experiments is shown in A and B. The histogram shows the average volume density corrected for the loading control, β-actin (phosphorylated Akt was corrected for the loading control, total Akt) (n = 4). *P < 0.05 compared with control cells. #P < 0.05 compared with hBVR-transfected cells. (C) Confocal microscopic images of E-cadherin in monolayer cells (I, parental cells; II, hBVR-transfected cells; III, hBVR-transfected cells treated with Ly294002 for 48 h; IV, hBVR-transfected cells treated with wortmannin for 48 h; V, pcDNA3.1/Zeo empty vector-transfected cells). Cell nuclei were enhanced by staining with propidium iodine (PI). Magnification, ×400.
In clones of BVR-transfected cells in which hBVR levels were increased more than 1.6-fold, we found more profound effects on EMT (data not shown). However, as shown in Figure 1, in hypoxic HK-2 cells, the expression of hBVR increased together with the duration of hypoxia, but remained approximately 1.5-fold greater at hypoxic time points (12, 24, and 48 h of hypoxia). Hence, we choose the 1.6-fold clone for the following experiment.
PI3K Inhibitors Block the EMT Caused by Transfection with hBVR
Recently, hBVR was determined to have tyrosine kinase activity and there are 2 potential SH2 protein docking sites for PI3K in hBVR,2,6 which suggests that hBVR is a potential agonist of PI3K. Hence, we detected the phosphorylation status and kinase activity of Akt in hBVR-transfected cells. As shown in Figure 3A, hBVR transfection significantly increased the phosphorylation of Akt. Treatment with Ly294002 and wortmannin, inhibitors of PI3K,21 decreased phosphorylation of AKT by 36% (Ly294002) and 32% (wortmannin) (Figure 3A). In the treated cells, E-cadherin protein was increased and vimentin protein was decreased (Figure 3B), and the morphologic transition was blocked. After treatment, E-cadherin relocalized to cell junctions (Figure 3C (III and IV)). Neither Ly294002 nor wortmannin changed the hBVR values in hBVR-transfected cells (Figure 3B). Collectively, these results suggest that increased phosphorylation of Akt in hBVR- transfected cells promotes phenotypic changes associated with EMT.
BVR Contributes to Hypoxia-Induced EMT via the PI3K/Akt Pathway
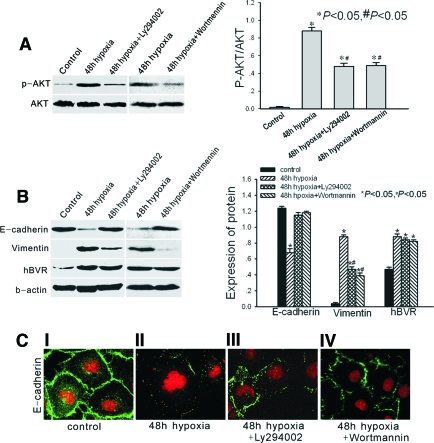
As shown in Figure 4A, phosphorylation of Akt was increased after 48-h hypoxia, whereas it was inhibited by Ly294002 and wortmannin. After 48-h hypoxia, the level of hBVR was also increased (Figure 4A). The protein E-cadherin was significantly reduced compared with levels in normoxic cells, whereas the protein vimentin was upregulated in hypoxic cells (Figure 4B). Confocal microscopy demonstrated that E-cadherin changed from a linear pattern in normoxic cells to a zipper-like pattern at the junctions between hypoxic cells (Figure 4C (I and II)). These changes are all characteristic of myofibroblasts. Treatment with Ly294002 or wortmannin reversed the increase in E-cadherin to the level present in normoxic cells (Figure 4B). After treatment, E-cadherin also reappeared at cell borders and E-cadherin distribution changed from a zipper-like pattern to a linear pattern (Figure 4C (III and IV)). Expression of vimentin was correspondingly reduced in hypoxic cells after treatment with Ly294002 and wortmannin (Figure 4B). However, neither Ly294002 nor wortmannin affected the hBVR values in hypoxic cells (Figure 4B).
Figure 4.
(A) Western blot analysis of phosphorylation status of Akt in normoxic control cells, 48-h hypoxic cells, 48-h hypoxic cells treated with Ly294002, and 48-h hypoxic cells treated with wortmannin. (B) Western blot analysis of E-cadherin, vimentin, and hBVR in the same groups shown in (A). Both panels show a representative blot from four independent experiments. The histogram shows the average volume density corrected for the loading control, β-actin (phosphorylated Akt was corrected for the loading control, total Akt) (n = 4). *P < 0.05 compared with control cells. #P < 0.05 compared with hBVR-transfected cells. (C) Confocal microscopic images of E-cadherin in monolayer cells (I, normoxic control cells; II, 48-h hypoxic cells; III, Ly294002-treated 48-h hypoxic cells; IV, wortmannin-treated 48-h hypoxic cells). Cell nuclei were enhanced by staining of cell nuclei with PI. Magnification, ×400.
BVR Depletion Results in Decreased Phosphorylation of Akt and Inhibition of Hypoxia-Induced EMT
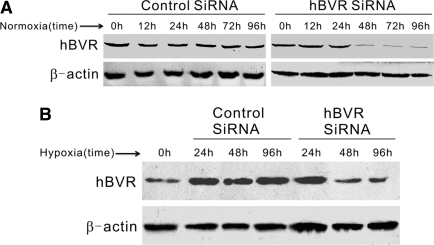
siRNA experiments were performed to decrease the activity of hBVR in cultured HK-2 cells. As shown in Figure 5A, in normoxic cells, silencing of hBVR was evident from 48 to 96 h after transfection and reached 60 to 80% reduction. Similar results were obtained in hypoxic HK-2 cells (Figure 5B). After 48 or 96 h transfection, the amount of hBVR in hypoxic cells was almost below the normal level. To assess the effect of hBVR knockdown on hypoxia-induced renal EMT, 48 h after siRNA transfection the cells were moved to a hypoxic incubator (1% O2, 5% CO2, 37°C) for another 48 h-incubation. The mock-transfected HK-2 cells and the cells transfected with control siRNA at 48 h served as negative controls and were also shifted to hypoxic incubation.
Figure 5.
(A) Time-dependence of hBVR silencing in normoxic HK-2 cells. HK-2 cells were transfected with small interfering RNA (siRNA), and Western blot analysis was performed 12, 24, 48, 72, or 96 h later. A representative blot from three independent experiments is shown. (B) Western blot analysis of siRNA-transfected HK-2 cells under hypoxic conditions. The cells were transfected with siRNA and incubated in a hypoxic incubator for 24, 48, or 96 h. A representative blot from three independent experiments is shown.
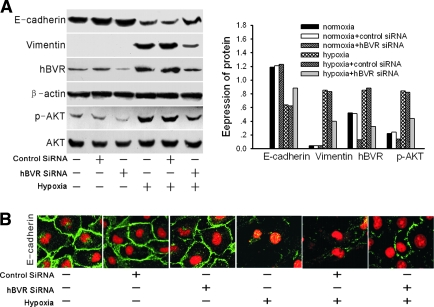
As shown in Figure 6, the negative control cells developed similar renal EMT after 48-h hypoxia and demonstrated downregulated E-cadherin levels and upregulated vimentin protein levels. The HK-2 cells transfected with hBVR-specific siRNA demonstrated resistance to hypoxia-induced EMT. This was evident because increased levels of E-cadherin protein (Figure 6A), a relocalization of E-cadherin protein at cell borders (Figure 6B), and reduced vimentin expression compared with negative controls (Figure 6A). Phosphorylated Akt was decreased after hBVR siRNA, with or without hypoxia, relative to levels in control cells with unsilenced hBVR, whereas the total amount of Akt protein remained unchanged (Figure 6A). This result further confirms that BVR is an upstream activator of Akt. In normoxic HK-2 cells, although hBVR-specific siRNA inhibited the phosphorylation of Akt, the mock transfected, control siRNA transfected, and hBVR siRNA knockdown cells all demonstrated similar expression of E-cadherin and absence of expression of vimentin after the full 96-h incubation. This suggests that hBVR inhibition does not affect the physiologic activity of normoxic HK-2 cells. Taken together with the findings from our experiments treating hypoxic cells with PI3K inhibitors, these results suggest that BVR-induced EMT depends on its phosphorylation of Akt.
Figure 6.
(A) Western blot analysis of E-cadherin, vimentin, hBVR, and phosphorylated Akt in normoxic cells, normoxic control-siRNA cells, normoxic hBVR-siRNA cells, 48-h hypoxic cells, 48-h hypoxic control-siRNA cells, and 48-h hypoxic hBVR-siRNA cells. A representative blot from three independent experiments is shown. The histogram shows the volume density of the representative blot corrected for the loading control, β-actin (phosphorylated Akt was corrected for the loading control, total Akt). (B) Confocal microscopic images of E-cadherin in monolayers of normoxic cells, normoxic control-siRNA cells, normoxic hBVR-siRNA cells, 48-h hypoxic cells, 48-h hypoxic control-siRNA cells, and 48-h hypoxic hBVR-siRNA cells. Cell nuclei were enhanced by staining of cell nuclei with PI. Magnification, ×400.
BVR, through the Akt Pathway, Participates in Hypoxia-Induced Renal Fibrosis In Vivo
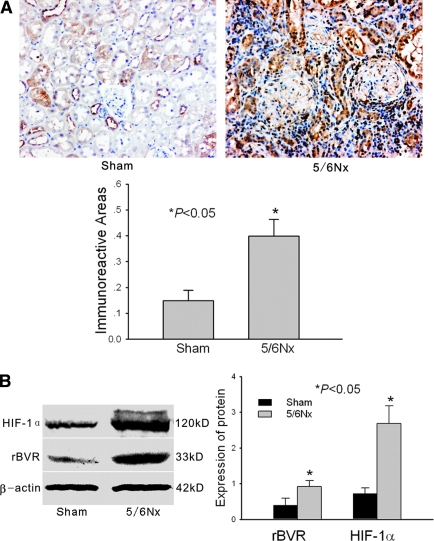
The 5/6 nephrectomy is not considered a standard model of hypoxia, but it is the classic fibrosis model. Hence, we chose to use the 5/6 subtotal nephrectomy model to investigate hypoxia-related renal fibrogenesis. As shown in Table 1, body weight did not differ between sham-operated and 5/6-nephrectomized rats. However, serum urea nitrogen and serum creatinine were significantly elevated in 5/6-nephrectomized rats compared with sham-operated rats. Also, light microscopic examination revealed glomerular sclerosis and interstitial fibrosis in 5/6-nephrectomized rats (data not shown). Immunohistochemical analysis showed that rat BVR (rBVR) was widely expressed in the glomeruli, renal tubules, and interstitial cells in 5/6-nephrectomized rats, whereas there was little staining in sham-operated rats (Figure 7A). Western blot demonstrated similar results: rBVR protein was significantly elevated in the kidney of 5/6-nephrectomized rats compared with shams (Figure 7B). As demonstrated by Manotham et al. and Zhang et al.,23,24 HIF-1α was also significantly elevated in 5/6-nephrectomized rats (Figure 7B). This result confirms that chronic hypoxia occurs with 5/6 subtotal nephrectomy of the rat. In our linear regression analysis of Western blot bands of rBVR and HIF-1α in 5/6-nephrectomized rats (n = 7), the Pearson correlation coefficient was 0.879, indicating a positive correlation (P < 0.01) between expression of HIF-1α and rBVR.
Table 1.
Renal function in sham-operated rats and 5/6-nephrectomized rats
| Groups | n | Bun (mmol/L) | Scr (μmol/L) | BW (g) |
|---|---|---|---|---|
| Sham-operated | 6 | 6.31 ± 1.04 | 28.54 ± 5.99 | 412 ± 11 |
| 5/6-nephrectomized | 7 | 35.80 ± 16.55a | 120.11 ± 63.78a | 398 ± 15 |
P < 0.01 compared with sham-operated rats. Bun, serum urea nitrogen; Scr, serum creatinine; BW, bodyweight.
Figure 7.
(A) Immunohistochemistry and immunoreactive area analysis for rat biliverdin reductase (rBVR) in the kidney tissue of sham-operated and 5/6-nephrectomized rats. Representative data from six pairs of rats are shown. The average signals are shown as a histogram (n = 6). Magnification, ×200. The immunoreactive area was assessed as described in the Concise Methods. (B) Western blot analysis of HIF-1α and hBVR in kidney tissue of sham-operated and 5/6-nephrectomized rats. A representative blot from six pairs of rats is shown. The histogram shows the average volume density corrected for the loading control, β-actin (n = 6). *P < 0.05 compared with sham-operated rats.
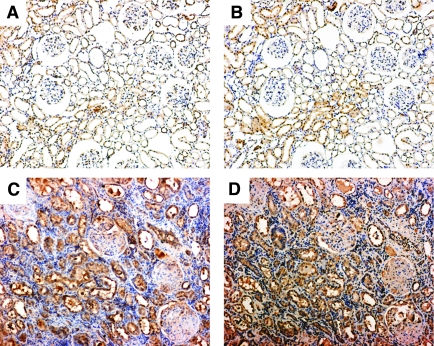
To further confirm the relationship between hypoxia-induced EMT and activation of Akt phosphorylation by BVR, we immunolocalized rBVR and phosphorylated Akt on serial sections in the kidney of both sham and 5/6-nephrectomized rats. In sham rats, although expression of phosphorylated Akt was somewhat weak, its distribution in the renal epithelia most closely corresponded to that of rBVR, which was locally expressed in some renal epithelial tubular cells (Figure 8, A and B). In 5/6-nephrectomized rats, along with an increase in rBVR, staining for phosphorylated Akt was widely distributed in the glomeruli, renal epithelia, and interstitium; and the distribution patterns of phosphorylated Akt and rBVR were highly congruent in the renal tubules (Figure 8, C and D). Taken together with the in vitro findings, this suggests that BVR is involved in hypoxia-induced renal fibrosis via the Akt pathway.
Figure 8.
Immunohistochemistry of rBVR and phosphorylated Akt on serial kidney sections in sham and 5/6-nephrectomized rats. (A) Phosphorylated Akt in the kidney of sham rats. (B) rBVR in the kidney of sham rats. (C) Phosphorylated Akt in the kidney of 5/6-nephrectomized rats. (D) rBVR in the kidney of 5/6-nephrectomized rats. Magnification, ×100.
Discussion
Chronic hypoxia is a crucial process in renal fibrogenesis.22,23 Accumulating data suggest that chronic tubulointerstitial hypoxia induced by peritubular capillary loss aggravates the development of tubulointerstitial fibrosis in remnant kidneys.22–24 Tubular cells exposed to hypoxia undergo EMT and then become myofibroblasts, as indicated by expression of mesenchymal markers, morphologic changes, and acquisition of mobility.19 The myofibroblasts transdifferentiated from tubular cells migrate to the tubular interstitium and sequentially induce renal fibrogenesis.25,26 However, the mechanisms of hypoxia-induced tubular EMT are poorly understood. In this study, we further demonstrated the occurrence of chronic hypoxia in remnant kidneys in vivo and the occurrence of EMT of renal tubular cells after hypoxia in vitro and confirmed that chronic hypoxia can induce the expression of BVR in renal tubular cells and remnant kidneys. Furthermore, we investigated the role of BVR in hypoxia-induced renal tubular EMT.
BVR is a key enzyme in the biliverdin degradation pathway, and it can be induced by endogenous or exogenous stimuli.7,15 Bilirubin, the downstream product of BVR, is a potent physiologic antioxidant;27,28 this action reflects an amplification cycle whereby bilirubin, acting as an antioxidant, is itself oxidized to biliverdin and then physiologically regenerated by BVR.10 Therefore, through BVR, bilirubin can protect cells from a 10,000-fold excess of H2O2.10 In experimental autoimmune encephalomyelitis, a free radical-mediated disease, treatment with BVR ameliorates both clinical and pathologic forms of the disease more efficiently than do treatments with traditional antioxidant enzymes, including superoxidase dismutase, catalase, glutathione reductase, and heme oxygenase-1.15 The increase in BVR in untreated experimental autoimmune encephalomyelitis indicates that it is protectively upregulated to defend against reactive oxygen species.15 The significant increase in BVR in hypoxic HK-2 cells and hypoxic remnant kidneys, as demonstrated here, may also be due to upregulation to protect renal cells or tissue from oxidative injuries.
However, using an hBVR-transfected cell culture system, we found that BVR can directly induce EMT, which was previously demonstrated as a prerequisite for renal interstitial fibrogenesis.29 Transfection of BVR into HK-2 cells caused phenotypic changes associated with EMT. The cobblestone-like epithelial cells were transformed into elongated cells in shape. Levels of E-cadherin, a cell-cell adhesion molecule present in the plasma membrane of most epithelial cells, were reduced and the protein formed zipper-like patterns at cell borders. In addition, vimentin, a cytoskeletal protein in many mesenchymal cells, was induced.
BVR has two potential SH-2 protein-docking sites, the Y198MKM motif and the Y228LSF motif.6 Base on those molecular docking sites, BVR is presumed to bind PI3K and activate of PKB/Akt.6 Our work supports this possibility and establishes that BVR regulates the phosphorylation of Akt. In hBVR-transfected HK-2 cells, there were high levels of phosphorylated Akt. The PI3K/Akt pathway is a major arm in EMT signaling. A critical molecular feature of EMT is downregulation of E-cadherin.13 The active form of Akt induces a transcription factor, snail, that represses expression of the E-cadherin gene.12 Phosphorylation of Akt is associated with a loss of cell-cell adhesion, a decrease in cell-matrix adhesion, a loss of apico-basolateral cell polarization, induction of cell motility, and other characteristics of myofibroblasts.12,13 In PI3K-inhibited BVR-transfected cells, we further confirmed the direct association between Akt and EMT. After treatment of BVR-transfected cells with Ly294002 or wortmannin, phosphorylation of Akt was decreased, the reduction in E-cadherin was reversed, and E-cadherin relocalized at cell borders. These observations convince us that BVR is directly involved in tubular EMT via the PI3K/Akt pathway. In addition, Mainess et al. confirmed that BVR itself has PKB/Akt-like activity,2 which may theoretically be directly involved in BVR-induced EMT.
To clarify the confliction between BVR's antioxidant ability and role in tubular EMT, we furthermore investigated the physiologic reaction of BVR to hypoxia. We observed myofibroblast-like characters in hypoxic HK-2 cells, which is consistent with previous reports.19,30 We also detected the upregulation of BVR after hypoxia. Upon treatment with Ly294002 or wortmannin, BVR remained upregulated, but the hypoxia induced tubular EMT was reversed. In pursuit of more evidence, we used hBVR-specific siRNA to investigate the cellular pathway required for the hypoxia-induced phenotypic effects in our model. BVR siRNA knockdown inhibited the phosphorylation of Akt in both hypoxic or normoxic cells and suppressed the hypoxic mesenchymal phenotype. Furthermore, we demonstrated in vivo that the distribution pattern of phosphorylated Akt is highly congruent with that of rBVR in normal kidney and in hypoxic renal fibrosis, indicating that rBVR exerts its fibrogenic effect through activation of Akt. Thus, it is plausible that Akt activation occurs downstream of BVR in hypoxia-induced EMT. Our results suggest that despite the protective upregulation of BVR as an antioxidant in hypoxic renal tubular epithelial cells, it accelerated hypoxia-induced tubular EMT via the PI3K/Akt pathway. Thus, at least in renal tubular epithelial cells, BVR acts as a two-edged sword in affecting the physiologic behavior of cells.
Our work demonstrates that hypoxia-induced tubular EMT may be at least partially regulated by BVR through a PI3K/Akt-dependent pathway. BVR is not only a powerful antioxidant but also a potential accelerator of renal fibrosis in remnant kidneys.
Concise Methods
Generation of the recombinant hBVR vector
On the basis of the hBVR cDNA sequence in Genebank (X93086), the full-length hBVR was amplified by reverse transcription PCR using 2 primers containing restriction sites (BamHI-sense, 5′-CGGGATCCCAGTGACCGAAGGAAGAGACCAA-3′; XbaI-antisense, 5′- GCTCTAGAGCTGGTGCCATCTTGGAAGTGC-3′). After purification, the amplified cDNA was subcloned into the pcDNA 3.1/Zeo plasmid (Invitrogen, Inc., NY, USA) and verified by sequencing.
Cell Culture and Protocol
Parental cells were HK-2 cells, which were donated by Professor Yu Xueqing from Zhongshan University. HK-2 cells were cultured in DMEM/F12 (Invitrogen, Inc.) supplemented with 10% FBS. The plasmid pcDNA3.1/Zeo/hBVR was transfected into HK-2 cells with Lipofectamine (Invitrogen, Inc.). Zeocin (Invitrogen, Inc.) was added at a concentration of 25 μg/ml for screening. A single resistant clone was picked and separately propagated. The untransfected blank control (parental) and a pcDNA 3.1/Zeo empty vector-transfected control (pcDNA3.1/Zeo) were used for reference. For determinations of PI3K activity, the hBVR-transfected cells were treated with 10 μM Ly294002 or 1 μM wortmannin (Cell Signaling Tech, Danvers, MA) for 48 h. For hypoxic culture, cells were placed in a hypoxic (1% O2, 5% CO2, 37°C) incubator (Galaxy oxygen control incubator, RS Biotech, Irvine, UK) for 12, 24, or 48 h. Some 48-h hypoxic cells were treated with Ly294002 or wortmannin simultaneously with the incubation; control cells (normoxic cells) were incubated for equivalent periods under normoxic conditions (21% O2, 5% CO2, 37°C).
siRNA for hBVR
For silencing, RNA primers complementary to nucleotides 446 to 471 of hBVR were used (sense, GCACGAGGAGCAUGUUGAACUCUUG; antisense, CAAGAGUUCAACAUGCUCCUCGUGC). HK-2 cells in 25-cm2 flasks were transfected with 400 pmol of the annealed RNA primer pair and 10 μl Lipofectamine 2000 (Invitrogen Inc.). Cells were analyzed 12 to 96 h after transfection. Preliminary results (n = 3) showed that silencing was evident at 48, 72, and 96 h after transfection. Therefore, 48 h after transfection, cells were placed into a hypoxic incubator for another 48 h to observe the effect of hBVR silencing on the hypoxic cells. The HK-2 cells transfected with Lipofectamine 2000 (mock transfection) or the cells transfected with control siRNA (Stealth RNAi Negative Control Duplexes, Invitrogen Inc.) were cultured in hypoxic conditions and used as negative controls.
Animal Model
Male Sprague–Dawley rats weighing 150 to 200 g were obtained from the Tongji laboratory animal center (Wuhan, China). The chronic renal hypoxia disease model was induced by 5/6 subtotal nephrectomy.22,23 All rats were euthanized at 12 wk after nephrectomy, and serum was collected for determination of creatinine and urea nitrogen. Kidneys were immediately excised; some were fixed with 4% paraformaldehyde, and others were frozen in liquid nitrogen until use. Kidney sections were stained by the periodic acid–Schiff method and examined by light microscopy. All procedures were performed in accordance with our university's guidelines for animal care.
Western Blotting
Kidney tissues and cells were extracted with lysis buffer containing 1% Triton-100, 0.5% Nonidet P-40, 20 mM Tris-HCl, 15 mM NaCl, 1 mmol/L EDTA, 1 mmol/L egtazic acid, 1 mM Na3VO4·10H2O, 2 mM NaF, 2 mM Na2P2O4·10H2O, 10 mM β-glycerophosphate disodium salt (pH 8.0), and cocktail inhibitor (5 mM phenylmethanesulfonyl fluoride, 5 μg/ml leupeptin, 5 μg/ml pepstatin, and 5 μg/ml aprotinin) for 30 min on ice. Cell debris was removed by centrifugation at 13,000 g for 20 min at 4°C. Protein concentration was determined using the Bradford method. Total protein (80 μg) was subjected to SDS-PAGE. The proteins were then transferred to nitrocellulose membranes. After transfer, the membranes were blocked with 5% nonfat milk in TBS with 0.1% Tween-20 for 1 h at 37°C, and blotted routinely with BVR (Stressgen Bioreagents Corp., Victoria, British Columbia, Canada), HIF-1α (Santa Cruz Biotechnology, Inc., Santa Cruz, CA), E-cadherin (Santa Cruz Biotechnology), vimentin (Santa Cruz Biotechnology), β-actin (Santa Cruz Biotechnology), phosphorylated Akt, and Akt primary antibodies (Cell Signaling Technology, Danvers, MA) at 4 °C overnight. The bound antibody complexes were visualized by enhanced chemiluminescence reaction, and x-ray film was scanned using a ChemiImager 5500 image analysis system (Alpha Innotech, San Leandro, CA, USA). Quantity One software (BioRad) was used to quantify the density of bands.
Immunohistochemistry and Immunocytochemistry
For immunohistochemical analysis, paraffin sections were incubated with primary anti-BVR antibody (Stressgen Bioreagents Corp.) at 4°C overnight. The sections were incubated with biotinylated goat anti-rabbit Ig antibody as the secondary antibody, and the antibody reactions were visualized using diamino benzidine (DAKO, Tokyo, Japan). An irrelevant isotype rabbit Ig was used for the negative control. Images from the microscope were captured with a Nikon DXM 1200 digital camera using Automatic Camera Tamer (ACT-1) software, version 2.63, and analyzed with HPIAs-1000 image analysis software (Qianping Image Engineering Co. of Tongji Medical School, China). The software enables the operator to set the optical threshold and filter combination to value positive stains. The positive stains were automatically discriminated by the computer and measured for optical intensity and total area. The staining index of the immunoreactive areas was calculated by multiplying the optical intensity and total area. Four to five sections per rat were assessed for immunoreactive areas (n = 6). Immunohistochemistry of BVR and phosphorylated AKT was performed using serial sections to clarify their colocalization in the kidneys.
For immunocytochemical analysis, HK-2 cells were cultured on sterile glass coverslips in six-well plates. The slides were incubated overnight at 4°C with anti-E-cadherin antibody, followed by incubation with FITC-conjugated goat anti-mouse Ig at room temperature for 1 h. Finally, slides were counterstained with propidium iodide and analyzed by confocal laser scanning microscopy.
Statistical Analyses
Data were analyzed by standard statistical methods, including linear regression, the t test, and one-way ANOVA using SPSS (version 12.0). Data are expressed as the mean ± SEM. Significance was assessed at P < 0.05.
Disclosures
None.
Supplementary Material
Acknowledgments
Grant supports: National Science Foundation of China (No. 30370657); New century excellent Talents grant (NCET004–0712), and the “973” Program of China (No. 2002CB513100).
Published online ahead of print. Publication date available at www.jasn.org.
R.Z. and Y.Y. contributed equally to this work.
REFERENCES
- 1.Beale SI, Cornejo J: Enzymatic heme oxygenase activity in soluble extracts of the unicellular red alga, Cynidium caldarium. Arch Biochem Biophys 235: 371–384, 1984 [DOI] [PubMed] [Google Scholar]
- 2.Maines MD: New insights into biliverdin reductase functions: Linking heme metabolism to cell signaling. Physiology 20: 382–389, 2005 [DOI] [PubMed] [Google Scholar]
- 3.Fakhrai H, Maines MD: Expression and characterization of a cDNA for rat kidney biliverdin reductase. Evidence suggesting the liver and kidney enzymes are the same transcript product. J Biol Chem 267: 4023–4029, 1992 [PubMed] [Google Scholar]
- 4.Maines MD, Polevoda BV, Huang TJ, McCoubrey WK, Jr: Human biliverdin IX alpha reductase is a zinc-metalloprotein. Characterization of purified and Escherichia coli expressed enzymes. Eur J Biochem 235: 372–381, 1996 [DOI] [PubMed] [Google Scholar]
- 5.Salim M, Brown-Kipphut BA, Maines MD: Human biliverdin reductase is autophosphorylated, and phosphorylation is required for bilirubin formation. J Biol Chem 276: 10929–10934, 2001 [DOI] [PubMed] [Google Scholar]
- 6.Lerner-Marmarosh N, Shen J, Torno MD, Kravets A, Hu Z, Maines MD: Human biliverdin reductase: A member of the insulin receptor substrate family with serine/threonine/tyrosine kinase activity. Proc Natl Acad Sci USA 17; 102: 7109–7114, 2005 [DOI] [PMC free article] [PubMed] [Google Scholar]
- 7.Maines MD, Ewing JF, Huang TJ, Panahian N: Nuclear localization of biliverdin reductase in the rat kidney: response to nephrotoxins that induce heme oxygenase-1. J Pharmacol Exp Ther 296: 1091–1097, 2001 [PubMed] [Google Scholar]
- 8.Ahmad Z, Salim M, Maines, MD: Human biliverdin reductase is a leucine zipper-like DNA-binding protein and functions in transcriptional activation of heme oxygenase-1 by oxidative stress. J Biol Chem 277: 9226–9232, 2002 [DOI] [PubMed] [Google Scholar]
- 9.Kravets A, Hu Z, Miralem T, Torno MD, Maines, MD: Biliverdin reductase, a novel regulator for induction of activating transcription factor-2 and heme oxygenase-1. J Biol Chem, 279: 19916–19923, 2004 [DOI] [PubMed] [Google Scholar]
- 10.Kravets A, Hu Z, Miralem T, Torno MD, Maines MD: Biliverdin reductase: a major physiologic cytoprotectant. Proc Natl Acad Sci USA 99: 16093–16098, 2002 [DOI] [PMC free article] [PubMed] [Google Scholar]
- 11.Backer JM, Myers MG, Jr., Shoelson SE, Chin DJ, Sun XJ, Miralpeix M, Hu P, Margolis B, Skolnik EY, Schlessinger J: Phosphatidylinositol 3′-kinase is activated by association with IRS-1 during insulin stimulation. EMBO J 11: 3469–3479, 1992 [DOI] [PMC free article] [PubMed] [Google Scholar]
- 12.Grille SJ, Bellacosa A, Upson J, Klein-Szanto AJ, van Roy F, Lee-Kwon W, Donowitz M, Tsichlis PN, Larue L: The protein kinase Akt induces epithelial mesenchymal transition and promotes enhanced motility and invasiveness of squamous cell carcinoma lines. Cancer Res 63: 2172–2178, 2003 [PubMed] [Google Scholar]
- 13.Larue L, Bellacosa A: Epithelial-mesenchymal transition in development and cancer: role of phosphatidylinositol 3′ kinase/AKT pathways. Oncogene 24: 7443–7454, 2005 [DOI] [PubMed] [Google Scholar]
- 14.Miralem T, Hu ZB, Torno MD, Lelli KM, Maines MD: Small interference RNA-mediated gene silencing of human biliverdin reductase, but not that of heme oxygenase-1, attenuates arsenite-mediated induction of the oxygenase and increases apoptosis in 293A kidney cells. J Biol Chem 280: 17084–17092, 2005 [DOI] [PubMed] [Google Scholar]
- 15.Liu Y, Liu J, Tetzlaff W, Paty DW, Cynader MS: Biliverdin reductase, a major physiologic cytoprotectant, suppresses experimental autoimmune encephalomyelitis. Free Radic Biol Med 40: 960–967, 2005 [DOI] [PubMed] [Google Scholar]
- 16.Juurlink BH: Response of glial cells to ischemia: roles of reactive oxygen species and glutathione. Neurosci Biobehav Rev 21: 151–166, 1997 [DOI] [PubMed] [Google Scholar]
- 17.Vanden Hoek TL, Li C, Shao Z, Schumacker PT, Becker LB: Significant levels of oxidants are generated by isolated cardiomyocytes during ischemia prior to reperfusion. J Mol Cell Cardiol 29: 2571–2583, 1997 [DOI] [PubMed] [Google Scholar]
- 18.Blokhina O, Virolainen E, Fagerstedt KV: Antioxidants, oxidative damage and oxygen deprivation stress: A review. Ann Bot (Lond) 91: 179–194, 2003 [DOI] [PMC free article] [PubMed] [Google Scholar]
- 19.Manotham K, Tanaka T, Matsumoto M, Ohse T, Inagi R, Miyata T, Kurokawa K, Fujita T, Ingelfinger JR, Nangaku M: Transdifferentiation of cultured tubular cells induced by hypoxia. Kidney Int 65: 871–880, 2004 [DOI] [PubMed] [Google Scholar]
- 20.Nangaku M: Chronic hypoxia and tubulointerstitial injury: A final common pathway to end-stage renal failure. J Am Soc Nephrol 17: 17–25, 2006 [DOI] [PubMed] [Google Scholar]
- 21.Walker EH, Pacold ME, Perisic O, Stephens L, Hawkins PT, Wymann MP, Williams RL: Structural determinants of phosphoinositide 3-kinase inhibition by wortmannin, LY294002, quercetin, myricetin, and staurosporine. Mol Cell 6: 909–919, 2000 [DOI] [PubMed] [Google Scholar]
- 22.Manotham K, Tanaka T, Matsumoto M, Ohse T, Miyata T, Inagi R, Kurokawa K, Fujita T, Nangaku M: Evidence of tubular hypoxia in the early phase in the remnant kidney model. J Am Soc Nephrol 15: 1277–1288, 2004 [DOI] [PubMed] [Google Scholar]
- 23.Zhang B, Liang X, Shi W, Ye Z, He C, Hu X, Liu S: Role of impaired peritubular capillary and hypoxia in progressive interstitial fibrosis after 5/6 subtotal nephrectomy of rats. Nephrology 10: 351–357, 2005 [DOI] [PubMed] [Google Scholar]
- 24.Kang DH, Joly AH, Oh SW, Hugo C, Kerjaschki D, Gordon KL, Mazzali M, Jefferson JA, Hughes J, Madsen KM, Schreiner GF, Johnson RJ: Impaired angiogenesis in the remnant kidney model: I. Potential role of vascular endothelial growth factor and thrombospondin-1. J Am Soc Nephrol 12: 1434–1447, 2001 [DOI] [PubMed] [Google Scholar]
- 25.Stutz F, Muller Ga: Transdifferentiation comes of age. Nephrol Dial Transplant 15: 1729–1731, 2000 [DOI] [PubMed] [Google Scholar]
- 26.Ng YY, Huang TP, Yang WC, Chen ZP, Yang AH, Mu W, Nikolic-Paterson DJ, Atkins RC, Lan HY: Tubular epithelial myofibroblast transdifferentiation in progressive tubulointerstitial fibrosis in 5/6 nephrectomized rats. Kidney Int 54: 864–876, 1998 [DOI] [PubMed] [Google Scholar]
- 27.Farrera JA, Jauma A, Ribo JM, Peire MA, Parellada PP, Roques-Choua S, Bienvenue E, Seta P: The antioxidant role of bile pigments evaluated by chemical tests. Bioorg Med Chem 2: 181–185, 1994 [DOI] [PubMed] [Google Scholar]
- 28.Neuzil J, Stocker R: Free and albumin-bound bilirubin are efficient co-antioxidants for alpha-tocopherol, inhibiting plasma and low density lipoprotein lipid peroxidation. J Biol Chem 269: 16712–16719, 1994 [PubMed] [Google Scholar]
- 29.Yang J, Liu Y: Dissection of key events in tubular epithelial to myofibroblast transition and its implications in renal interstitial fibrosis. Am J Pathol 159: 1465–1475, 2001 [DOI] [PMC free article] [PubMed] [Google Scholar]
- 30.Fan JM, Ng YY, Hill PA, Nikolic-Paterson DJ, Mu W, Atkins RC, Lan HY: Transforming growth factor β regulates tubular epithelial-myofibroblast transdifferentiation in vitro. Kidney Int 56: 1455–1467, 1999 [DOI] [PubMed] [Google Scholar]
Associated Data
This section collects any data citations, data availability statements, or supplementary materials included in this article.


