Abstract
Macrophages activate the production of cytokines and chemokines in response to LPS through signaling cascades downstream from TLR4. Lipid mediators such as PGE2, which are produced during inflammatory responses, have been shown to suppress MyD88-dependent gene expression upon TLR4 activation in macrophages. The study reported here investigated the effect of PGE2 on TLR3- and TLR4-dependent, MyD88-independent gene expression in murine J774A.1 macrophages, as well as the molecular mechanism underlying such effect. We demonstrate that PGE2 strongly suppresses LPS-induced IFNβ production at the mRNA and protein levels. Poly I:C-induced IFNβ and LPS-induced CCL5 production were also suppressed by PGE2. The inhibitory effect of PGE2 on LPS-induced IFNβ expression is mediated through PGE2 receptor subtypes EP2 and EP4, and mimicked by the cAMP analogue 8-Br-cAMP as well as by the adenylyl cyclase activator forskolin. The downstream effector molecule responsible for the cAMP-induced suppressive effect is Epac but not PKA. Moreover, data demonstrate that Epac-mediated signaling proceeds through PI3K, Akt, and GSK3β. In contrast, PGE2 inhibits LPS-induced TNFα production in these cells through a distinct pathway requiring PKA activity and independent of Epac/PI3K/Akt. In vivo, administration of a COX inhibitor prior to LPS injection resulted in enhanced serum IFNβ concentration in mice. Collectively, data demonstrate that PGE2 is a negative regulator for IFNβ production in activated macrophages and during endotoxemia.
Keywords: monocytes/macrophages, cytokines, gene regulation, signal transduction, lipid mediators, lipopolysaccharide
Introduction
Prostaglandin E2 (PGE2), produced by macrophages and other cells in response to inflammatory stimuli, has been shown to modulate macrophage activation in part by suppressing the release of cytokines and/or chemokines (1-3). Several lines of evidence suggest that the production of PGE2 during inflammation constitutes a negative-feedback mechanism which limits the production of, among other mediators, TNFα, IL-1, and CCL4 in immune cells (2, 4, 5).
The production of cytokines and chemokines by macrophages can be initiated through the engagement of the pattern recognition receptors (i.e, TLRs) expressed on these cells. The cytoplasmic domain of TLRs transmits signals downstream via interactions with Toll/IL-1 receptor homology (TIR) domain-containing adaptor molecules. Among them, MyD88 plays a central role in TLR signaling as it is shared by almost all TLRs. Further advances in the understanding of TLR signaling have identified genes whose induction is independent of MyD88 (6). In this regard, 71% of the LPS-responsive genes in macrophages were shown to be modulated independently of MyD88 (7).
The purpose of the present study was to characterize the effect of PGE2 on LPS-induced, MyD88-independent gene expression and to elucidate the molecular mechanism responsible for such regulation. Experiments focused on IFNβ, the only type I interferon produced by macrophages upon TLR4 activation, and a prototypical MyD88-independent gene. Results show that PGE2, at concentrations found in acute inflammatory sites in vivo, imposes a strong suppression on LPS-induced IFNβ production. In addition, PGE2 suppresses another MyD88-independent gene upon TLR4 stimulation, namely CCL5, and TLR3-mediated, poly I:C-induced IFNβ production by J774A.1 cells. Furthermore, findings demonstrate the divergent regulation of PGE2-mediated signaling components on MyD88-dependent and -independent cascades downstream from TLR4 activation in macrophages. Finally, blocking COX activity in vivo results in higher post-LPS serum IFNβ concentration.
Materials and Methods
Cell culture
The murine macrophage-like J774A.1 cell line was obtained from the American Type Culture Collection (Manassas, VA). Cells were grown in Dulbecco’s Modified Eagle’s Medium (Invitrogen, Carlsbad, CA), supplemented with 10% fetal bovine serum (HyClone, Logan, UT), penicillin (100 U/mL), and streptomycin (100 U/mL). Cells were cultured at 105 cells/well in 0.2 mL culture media in 96-well plates (Becton Dickinson Labware, Franklin Lakes, NJ) for supernatant harvesting and at 2×10⁶ cells/well in 2 mL culture medium in 6-well plates (Becton Dickinson Labware) for RNA or protein extraction. Specific cell treatments in the different experiments are described in the Figure Legends and in the text. Cell viability was determined using Neutral Red uptake at the end of all experiments. None of the treatments affected cell viability.
Enzyme-linked immunosorbent assay (ELISA)
ELISA was used to measure IFNβ protein accumulation in supernatants harvested from macrophages as described by Weinstein et al. (8). The level of CCL5 was measured with a commercially available ELISA kit, according to manufacturer’s instruction (R&D Systems, Minneapolis, MN). TNFα production was measured by ELISA, with capture and detection antibodies purchased from BD Biosciences (San Jose, CA) and Pierce (Rockford, IL), respectively.
RT-PCR
Total RNA was isolated using the RNeasy Mini extraction kit (Qiagen, Valencia, CA). cDNA was synthesized from 1 μg of total RNA using the First-strand cDNA Synthesis kit (GE Healthcare, Buckinghamshire, UK) according to manufacturer’s instructions. Quantitative PCR was performed with SYBR Green quantitative PCR SuperMix (Stratagene, La Jolla, CA) and the Mx4000P QPCR system (Stratagene). PCR primer pairs (Table 1) were obtained from Invitrogen. The following cycling conditions were used for the amplification of IFNβ and β-actin: 10 min at 95°C as the initial denaturation step; 15 sec at 95°C (1 min for β-actin), 45 sec at 59°C and 30 sec at 72°C as the amplification step; and a final cooling step down to 4°C. The melting point curve for primer specificity was run for 30 sec at 55°C. Primer specificity was confirmed by melting curve analysis and agarose gel electrophoresis. No non-specific products were observed. Serial dilutions of plasmids containing the cloned PCR products were used to generate standard curves. All the gene expression data presented in the Results section were normalized to β-actin.
Table 1.
Sequences of primer pairs used in RT-PCR
| Primer | Sequences (5’-->3’) |
|---|---|
| IFNβ forward | TCCAAGAAAGGACGAACATTCG |
| IFNβ reverse | TGAGGACATCTCCCACGTCAA |
| TNFα forward | CACGCTCTTCTGTCTACTGA |
| TNFα reverse | CACTTGGTGGTTTGCTACGA |
| EP1 forward | CCAACAGGCGATAATGGCAC |
| EP1 reverse | TGGCGACGAACAACAGGAAG |
| EP2 forward | TTCATATTCAAGAAACCAGACCCTGGTGGC |
| EP2 reverse | AGGGAAGAGGTTTCATCCATGTAGGCAAAG |
| EP4 forward | GACTGGACCACCAACGTAACGGCCTACGCC |
| EP4 reverse | ATGTCCTCCGACTCTCTGAGCAGTGCTGGG |
| β-actin forward | TGTGATGGTGGGAATGGGTCAG |
| β-actin reverse | TTTGATGTCACGCACGATTTCC |
The expression of EP subtypes was analyzed by conventional PCR. The cycling conditions included: 3 min at 94°C as the initial denaturation step; 30 sec at 94°C, 45 sec at 55°C for EP1 (58.5°C for EP2 and 65°C for EP4) and 1 min at 72°C as the amplification step; and a final cooling step down to 4°C.
Western blot analysis
Macrophages were harvested in cold lysis RIPA buffer (50 mM Tris-HCl, pH 7.4; 150 mM NaCl, 0.25% deoxycholic acid, 1% NP40, and 1mM EDTA), together with protease inhibitor cocktail (Roche Applied Sciences, Indianapolis, IN). Protein concentrations were determined by BCA assay (Pierce). For Western blot analysis, total protein (20 μg) was fractionated by SDS-polyacrylamide gels and was transferred to nitrocellulose membranes (Bio-Rad, Hercules, CA). The membranes were blocked, washed, and incubated with Akt and phospho-Akt antibodies (1:1000 dilution) followed by horseradish peroxidase-conjugated secondary antibodies (1:3000 dilution). Signals were detected with ECL Western Blotting Detection Reagents (GE Health) according to manufacturer’s instructions.
Measurement of Ca2+ influx in J774A.1 cells
Intracellular Ca2+ flux was assessed in real time with the fluorescent probe fluo-4/AM dye (Invitrogen), monitored with a Nikon TE2000U inverted fluorescent microscope (Nikon Instruments Inc., Japan). Briefly, 300,000 J774A.1 macrophages were loaded with 3 ng/mL fluo-4/AM dye in HBSS (Invitrogen) supplemented with 10 mM HEPES (pH 7.4) for 30 min at 25°C. Just before use, cells were washed with HBSS + 10 mM HEPES to remove excess fluo-4/AM. Fluorescent images (ex 489/em 522 nm) were acquired every 5 sec along with corresponding bright field images every 30 sec, for 40 min at 25°C. Regions were drawn around the cells and total cellular fluorescent intensity was measured and plotted over time.
cAMP measurement
Intracellular cAMP level was assayed using an EIA kit from Cayman Chemical (Ann Arbor, Michigan). In brief, J774A.1 cells were seeded into 12-well plates at 1.5×10⁶cells/well and incubated with the phosphodiesterase inhibitor IBMX (2 mM) for 30min at 37°C. The reaction was started by the addition of PGE2, butaprost, or ONO-AE1-329 for 10min at 37°C. The reaction was terminated by aspirating the supernatant, and cells were immediately harvested in 0.1 N HCl by scraping. The cell-suspension was centrifuged for 10 min at 1,000 × g, 4°C. The supernatants were assayed using the cAMP assay kit according to manufacturer’s instructions.
Animals
Six-to-eight week old Swiss Webster male mice were purchased from Taconic Farms (Hudson, NY). Experimental protocols were approved by the Institutional Animal Care and Use Committee at Rhode Island Hospital.
In vivo experiments
Mice were injected with ketorolac (Cayman Chemical; 20 mg/kg) or saline i.p. (n = 6 per group). One hour later, animals were challenged with LPS (1 mg/kg; i.p.). Blood was harvested 2 h later by cardiac puncture and used for the measurement of IFNβ. Preliminary experiments demonstrated peak serum IFNβ occurred 2 h after LPS exposure.
Materials
LPS, PGE2, butaprost, forskolin, 8-bromo-cAMP, LiCl, SB216763, IBMX and HEPES were obtained from Sigma-Aldrich. Poly I:C was from In VivoGen (San Diego, CA). Protein kinase A inhibitors H-89 and KT5720, 8-CPT-2’-O-Me-cAMP, and wortmannin were from Calbiochem (San Diego, CA). The protein molecular mass markers, as well as penicillin and streptomycin were from Invitrogen. Anti-phospho-Akt and anti-Akt Abs were purchased from Upstate Signaling (Lake Placid, NY). The HRP-conjugated anti-rabbit Ab was from Cell Signaling (Danvers, MA). EP1 agonist 17-phenyl trinor PGE2 was purchased from Cayman Chemical and EP4 agonist ONO-AE1-329 was provided by Ono Pharmaceuticals (Osaka, Japan). H2SO4 was from Fisher Scientific.
Statistical analysis
All experiments were performed at least three times. Cell culture data are means ± SD from quadruplicate samples in a representative experiment. Statistical analysis was by ANOVA, with Dunnett’s or Student-Newman-Keuls post-hoc tests (cell culture experiments) or Mann-Whitney U test (in vivo experiments). A value of p < 0.05 was considered statistically significant.
Results
Effect of PGE2 on LPS-induced IFNβ production in J774A.1 cells
PGE2 dose-dependently suppressed LPS (100 ng/mL)-induced IFNβ production (Fig. 1). Endogenous PGE2 did not contribute to the suppressive effect since the addition of the COX inhibitor indomethacin (10 μM) did not alter IFNβ release (data not shown).
Figure 1. PGE2 inhibits LPS-induced IFNβ production in murine J774A.1 cells.
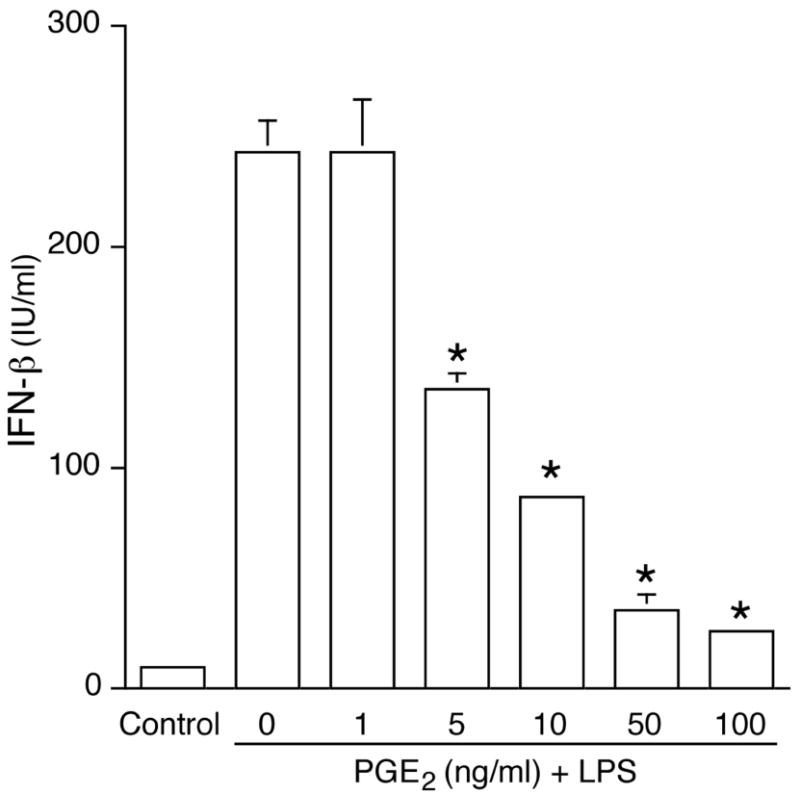
Murine J774A.1 macrophages were incubated with PGE2 for 1 h, followed by LPS (100 ng/mL) for 16h. Supernatants were harvested and IFNβ production was measured by ELISA. Unstimulated J774A.1 cells were used as a negative control and not included in the statistical analysis. *, p < 0.05 vs. LPS alone, ANOVA/Dunnett’s.
To determine whether the suppressive effect of PGE2 was unique to IFNβ among MyD88-independent genes induced by LPS, the production of chemokine CCL5 was measured in the presence or absence of PGE2. PGE2 was found to dose-dependently reduce LPS-induced CCL5 production (Fig. 2A).
Figure 2. PGE2 dose-dependently inhibits LPS-induced CCL5 secretion as well as poly I:C-induced IFNβ production.
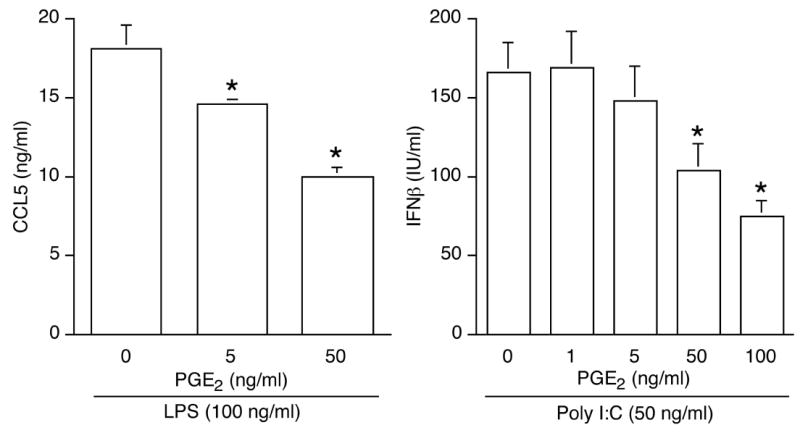
(A). Cells stimulated with LPS (100 ng/mL) were pretreated or not for 1 h with PGE2. Secreted CCL5 was measured by ELISA after 16 h. *, p < 0.05 vs. LPS alone, ANOVA/Dunnett’s. (B). Cells stimulated with the TLR3 ligand poly IC (50 ng/mL) were pretreated or not for 1 h with PGE2. IFNβ production was measured by ELISA after 16 h. *, p < 0.05 vs. poly I:C alone, ANOVA/Dunnett’s.
Activation of TLR3 can also trigger IFNβ release via a MyD88-independent pathway. A robust IFNβ production was detected by ELISA in cells stimulated with the TLR3 synthetic ligand poly I:C (Fig. 2B) and PGE2 treatment prior to poly I:C stimulation suppressed IFNβ production.
The suppressive effect of PGE2 on LPS-induced IFNβ production occurs at the mRNA level
The regulation of IFNβ gene expression occurs mainly at the transcriptional level (9, 10). As shown in Fig. 3, LPS stimulation led to a rapid increase in IFNβ mRNA, with maximum level detected at 4 h. PGE2 pretreatment reduced LPS-induced IFNβ mRNA by four and six fold at 2 h and 4 h, respectively (Fig. 3). Moreover, the suppressive effect of PGE2 on LPS-induced IFNβ mRNA expression was maintained when PGE2 was added simultaneously with or 30 min after LPS (data not shown).
Figure 3. PGE2 suppresses LPS-induced IFNβ gene expression.
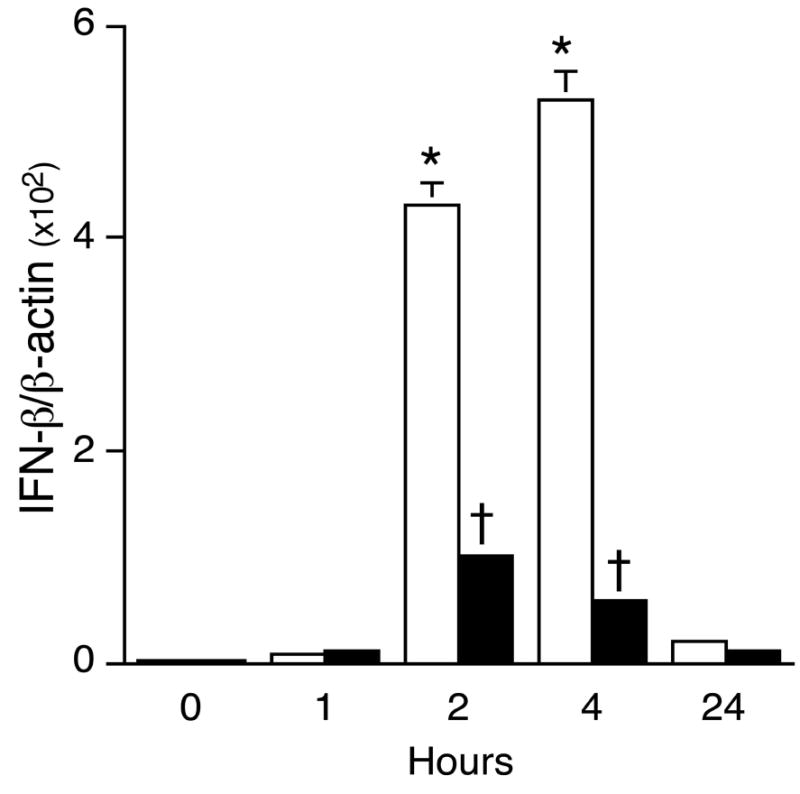
Total RNA was isolated from J774A.1 macrophages treated or not with 50 ng/mL PGE2 for 1 h, followed by LPS (100 ng/mL) for the times indicated (LPS only; v, PGE2+LPS). Real-time quantitative PCR was used to analyze IFNβ and β-actin using primers described in Table 1. In LPS-stimulated groups, * indicates p < 0.05 vs. 0 hour, ANOVA/Dunnett’s. In LPS + PGE2-treated groups, † indicates p < 0.05 vs. LPS-alone, ANOVA/Student-Newman-Keuls.
Expression and function of prostaglandin receptor subtypes in J774A.1 cells
Conventional RT-PCR was conducted to characterize the PGE2 receptor expression patterns in J774A.1 cells. As shown in Fig. 4, EP1, EP2 and EP4 mRNAs were detected in un-stimulated cells. As reported by Sugimoto et al. (11), LPS stimulation resulted in increased EP2 mRNA expression (Fig. 4). EP3 mRNA was not detected in the cells (data not shown).
Figure 4. Prostaglandin receptor subtypes EP1, EP2 and EP4 mRNA expression in J774A.1 cells.
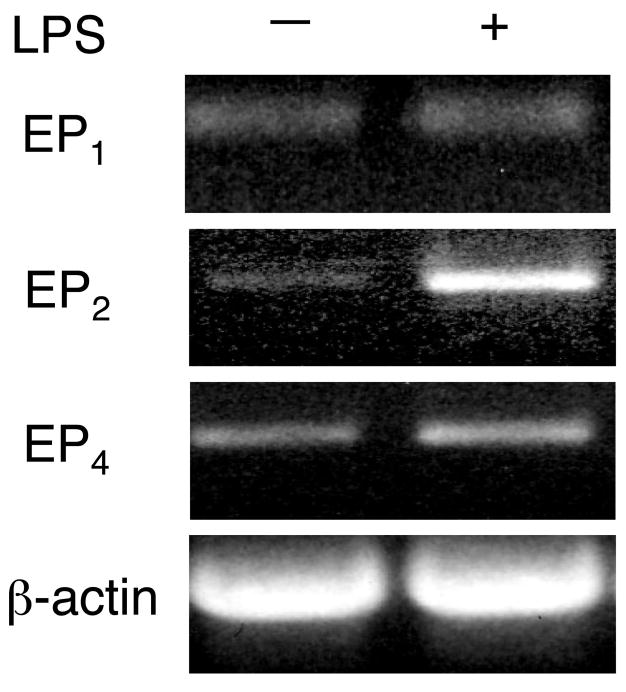
Total RNA was extracted from J774A.1 cells treated or not with 100 ng/mL LPS for 2 h. Conventional RT-PCR was performed to analyze the expression of EP1, EP2 and EP4 using the primers described in Table 1. β-Actin was included as a loading control.
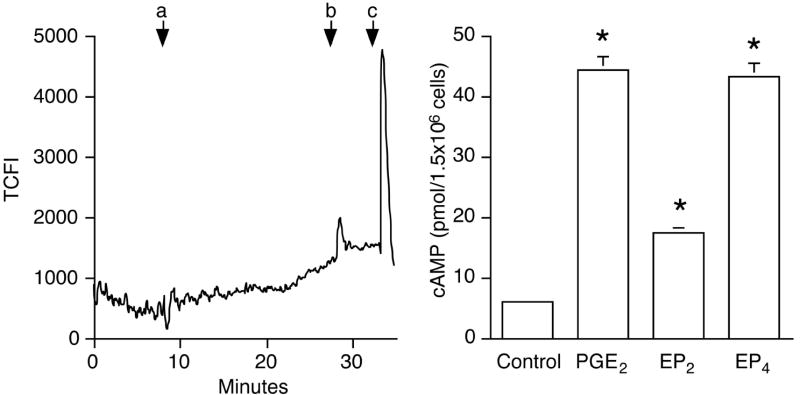
To test whether EP mRNA expression correlated with receptor function, cells were treated with specific EP agonists. EP1 is known to activate Ca2+ signaling (reviewed in (12)). Treatment of macrophages with the EP1 agonist 17-phenyl trinor PGE2 did not result in significant intracellular Ca2+ influx (Fig. 5A).
Figure 5. EP2 and EP4, but not EP1, are functional in J774A.1 cells.
(A). Macrophages were loaded with fluo-4/AM as described in the text. The effect of EP1 agonist 17-phenyl trinor PGE2 (100 nM, a) was assessed as changes in cytosolic Ca2+ levels, measured over 20 min. Ionomycin (20 μM, b) and KCl (100 μM, c) were given at the end of experiment to produce a Ca2+ spike (positive control). The y-axis represents total cellular fluorescence intensity (TCFL).
(B). Macrophages (1.5×10⁶) were pre-incubated with phosphodiesterase inhibitor IBMX for 30 min, followed by 10 min treatment with PGE2 (50 ng/mL), butaprost (100 nM; designated as “EP2” in the graph), or ONO-AE1-329 (100 nM; designated as “EP4” in the graph). Untreated cells were included as a negative control and are shown in the first column. cAMP level was measured using an enzyme immunoassay as described in Materials and Methods. *, p < 0.05 vs. untreated group, ANOVA/Dunnett’s.
In contrast to EP1, EP2 and EP4 receptors stimulate adenylyl cyclase activity. There was an 8-fold increase in the intracellular cAMP level when macrophages were treated with PGE2 (50 ng/mL) as compared to untreated cells for 10 min (6.1 ± 0.6 vs. 44 ± 4.3 pmol/1.5 × 106 cells; Fig. 5B). Both butaprost, an EP2 agonist, and ONO-AE1-329, an EP4 agonist (at 100 nM for 10 min) elevated intracellular cAMP, demonstrating the functionality of the receptors.
EP2- and EP4-specific agonists suppress LPS-induced IFNβ production
The EP2- and EP4-specific agonists mentioned above were utilized to examine the roles of these receptors in mediating the inhibition of LPS-induced IFNβ production by PGE2. Similar to the effect of PGE2, either agonist dose-dependently suppressed LPS-induced IFNβ production (Fig. 6). Furthermore, the relative magnitude of the inhibition of LPS-induced IFNβ production imposed by EP2- and EP4-specific agonists correlated with the levels of intracellular cAMP produced (Fig. 5). In contrast, EP1-specific agonist 17-phenyl trinor PGE2 (100 nM) failed to alter LPS-induced IFNβ mRNA expression when added alone or together with EP2- or EP4-specific agonists (data not shown).
Figure 6. The inhibitory effect of PGE2 on LPS-induced IFNβ production is mediated by prostaglandin receptor subtypes EP2 and EP4.
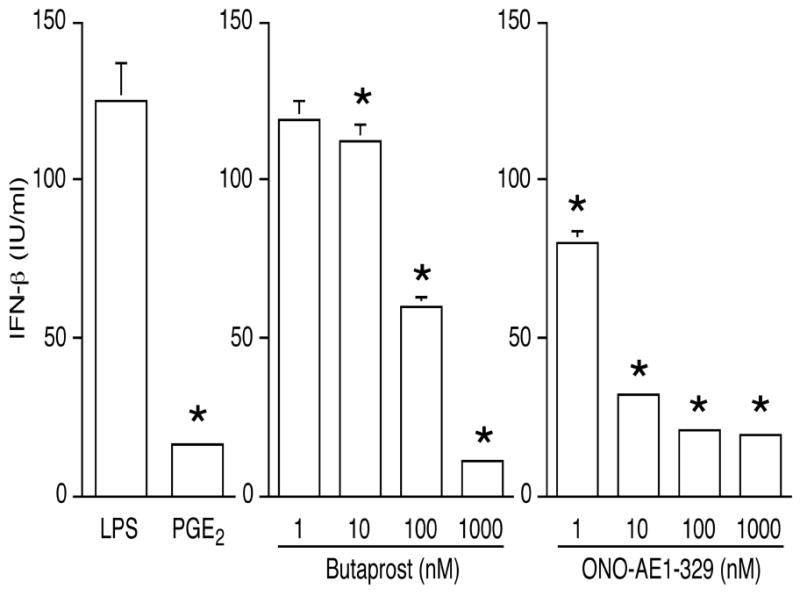
Cells were treated with LPS, or with PGE2 (50 ng/mL), the EP2-specific agonist butaprost, or the EP4-specific agonist ONO-AE1-329 for 1 h, followed by LPS. IFNβ production was measured by ELISA on supernatants collected after overnight LPS exposure. *, p < 0.05 vs. LPS alone, ANOVA/Dunnett’s.
cAMP and its downstream effector molecule Epac are responsible for the suppressive effect of PGE2
A cell membrane-permeable cAMP analogue, 8-Br-cAMP, was utilized to test the hypothesis that an elevation of intracellular cAMP level is necessary for the effect of PGE2 on IFNβ production. The real-time quantitative RT-PCR data shown in Fig. 7A illustrate that forskolin, an activator of adenylyl cyclase, could mimic the effect of PGE2 by suppressing LPS-induced IFNβ production in a dose-dependent manner. Cyclic AMP analogue 8-Br-cAMP had a similar effect (Fig. 7B).
Figure 7. Both the cAMP analogue 8-bromo-cAMP and forskolin mimic the inhibitory effect of PGE2 on LPS-induced IFNβ gene expression and production.
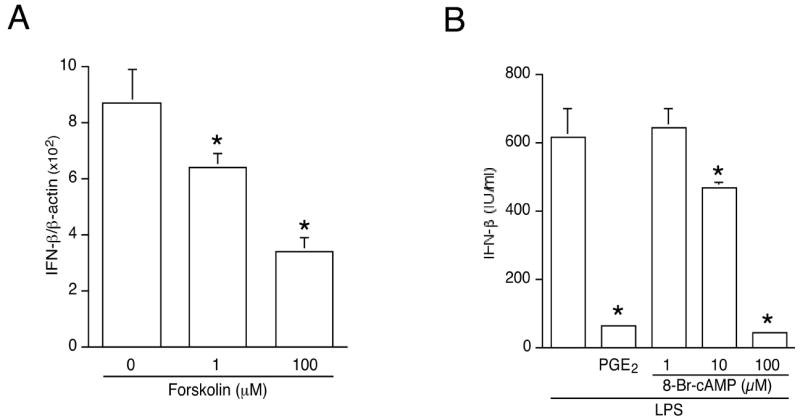
(A). Cells were treated with the adenylyl cyclase activator forskolin for 1 h, followed by LPS (100 ng/mL) for 2 h. Total RNA was isolated and reverse transcribed. IFNβ gene expression was measured by real-time PCR and normalized to β-actin. *, p < 0.05 vs. untreated group, ANOVA/Dunnett’s.
(B). J774A.1 macrophages were incubated with LPS (100 ng/mL) alone, or with PGE2 (50 ng/mL) or cAMP analogue 8-bromo-cAMP at the indicated concentrations, followed by LPS (100 ng/mL). Supernatants were harvested after 16 h and IFNβ was determined by ELISA. *, p < 0.05 vs. untreated group, ANOVA/Dunnett’s.
A well-characterized signaling target downstream from cAMP is cAMP-responsive protein kinase A (PKA). To investigate whether PKA was involved in the PGE2-mediated suppression of LPS-induced IFNβ production, cells were treated with PKA inhibitors H89 or KT-5720 prior to LPS. Neither treatment could reverse the inhibitory effect of PGE2 on LPS-induced IFNβ gene expression or protein release (Fig. 8A; KT-5720 data not shown).
Figure 8. The inhibitory effect of PGE2 on LPS-induced IFNβ gene expression involves Epac but not PKA.
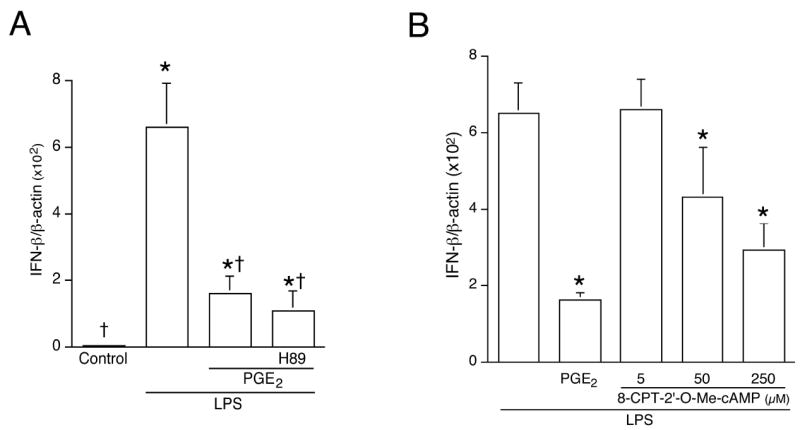
(A). Cells were pretreated or not with the PKA inhibitor H89 (10 μM) for 30 min, followed by PGE2 (50 ng/mL, 1 h), and then LPS for 2 h. Control groups included unstimulated cells, and cells stimulated with LPS alone. Total RNA was isolated and subjected to real-time quantitative RT-PCR using primers targeting IFNβ and β-actin. * indicates p < 0.05 vs. control group and † indicates p < 0.05 vs. LPS-alone group, ANOVA/Student-Newman-Keuls.
(B). Cells were treated with Epac-specific activator 8-CPT-2’-O-Me-cAMP for 1 h followed by 2 h of LPS. Control groups included LPS alone, or 1 h of PGE2 followed by 2 h LPS. Total RNA was isolated, reverse transcribed, and subjected to real-time quantitative PCR using primers targeting IFNβ and β-actin. *, p < 0.05 vs. LPS alone, ANOVA/Dunnett’s.
cAMP-mediated signaling also occurs through exchange protein directly activated by cAMP (Epac) (13). The expression of Epac in murine macrophages has been documented (14). Real-time quantitative RT-PCR demonstrated that the Epac-specific activator 8-CPT-2’-O-Me-cAMP dose-dependently suppressed LPS-induced IFNβ gene expression (Fig. 8B). Since 8-CPT-2’-O-Me-cAMP does not activate PKA, the data indicate that Epac represents the downstream effector molecule mediating the inhibitory effect of PGE2 on LPS-induced IFNβ production.
Role of PI3K-->Akt-->GSK3β in PGE2-mediated suppression of LPS-induced IFNβ production
PI3K is considered a negative regulator of TLR signaling (15). Moreover, there is evidence that activation of Epac by cAMP can signal through the PI3K/Akt pathway (16). The effect of PGE2 on PI3K activation was assessed by Western blot analysis using a phospho-specific antibody against residue Serine 473 of Akt. Results revealed that treatment of macrophages with PGE2 increased phosphorylation of Akt in a time-dependent manner (Fig. 9A). The ability of PGE2 to phosphorylate/activate Akt has been reported elsewhere with similar kinetics to those shown in Fig. 8A (17). To discern the EP receptor responsible for Akt activation, cells were stimulated with either butaprost or ONO-AE1-329, and the two agonists induced Akt activation with similar kinetics (Fig. 9A). While the activation of PI3K by EP4 agonist has been reported (18), results described here show that such response can also be elicited by an EP2 agonist.
Figure 9. The role of PI3K/Akt/GSK3β in the suppression of IFNβ in macrophages.
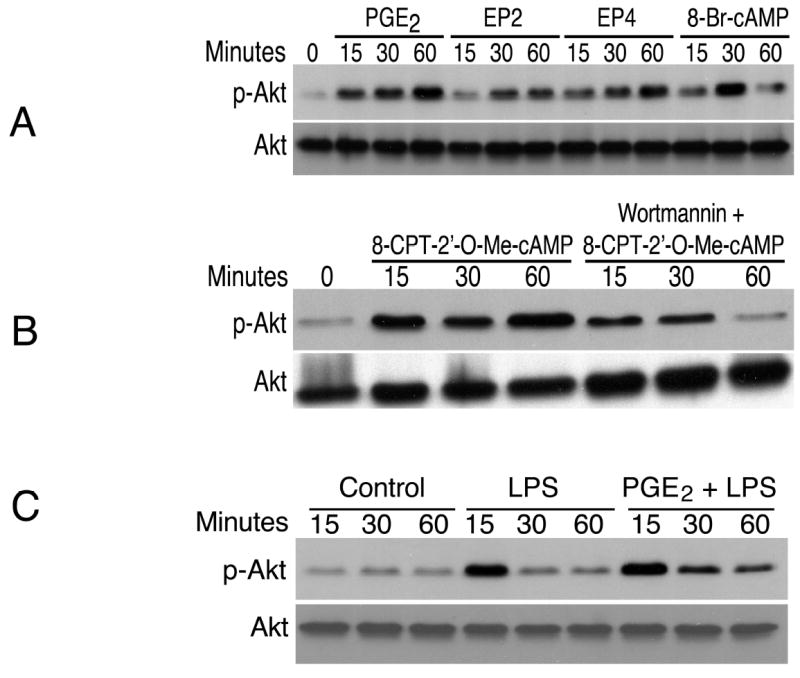
(A). Cells were treated with PGE2 (50 ng/mL), EP2-specific agonist butaprost (100 nM; “EP2” in the graph), EP4-specific agonist ONO-AE1-329 (100 nM; “EP4” in the graph), or 8-Br-cAMP (100 μM) for the indicated times. Whole cell lysates were harvested, separated by SDS-PAGE and subjected to Western blot analysis utilizing an antibody recognizing phospho-Akt (Ser-473). The same blot was stripped and re-blotted with anti-Akt antibody.
(B). Cells were stimulated with the Epac-specific activator 8-CPT-2’-O-Me-cAMP (250 μM) following pretreatment with the PI3K inhibitor wortmannin (1 μM) for 30min. Whole cell lysates were harvested for phospho-Akt Western blot. Loading control was obtained by stripping and re-blotting for total Akt.
(C). Cells were untreated, incubated with LPS, or with PGE2 for 1 h followed by LPS for the indicated time points. Western blot analysis was conducted using phospho-Akt and total Akt antibodies.
To investigate the downstream signaling components responsible for the activation of Akt, the cAMP analogue 8-Br-cAMP as well as the Epac-specific activator 8-CPT-2’-O-Me-cAMP were used to stimulate J774A.1 cells. Akt activation/phosphorylation was induced by both compounds (Fig. 9 A and B). Akt phosphorylation was mediated exclusively through PI3K because wortmannin (a PI3K-specific inhibitor) abolished Akt phosphorylation in response to PGE2, butaprost, ONO-AE1-329, 8-Br-cAMP, or 8-CPT-2’-O-Me-cAMP (data shown for 8-CPT-2’-O-Me-cAMP, Fig. 9B). Fig. 9C shows that LPS triggered maximal level of Akt phosphorylation/activation at 15 min, and that PGE2 prolonged LPS-induced Akt activation in the cells.
To directly test the involvement of PI3K/Akt on LPS-induced IFNβ production, cells were pre-treated with the PI3K inhibitor wortmannin. Real-time quantitative RT-PCR results indicated that wortmannin completely reversed the inhibitory effect of PGE2 on LPS-induced IFNβ gene expression (Fig. 10A). Furthermore, the normalized level of IFNβ mRNA was twice as high in wortmannin-treated cells than in LPS-treated controls (12.2 ± 3.0 vs. 6.6 ± 1.3).
Figure 10. PI3K activity suppresses LPS-induced IFNβ gene expression and GSK3β is an integral component of such suppression.
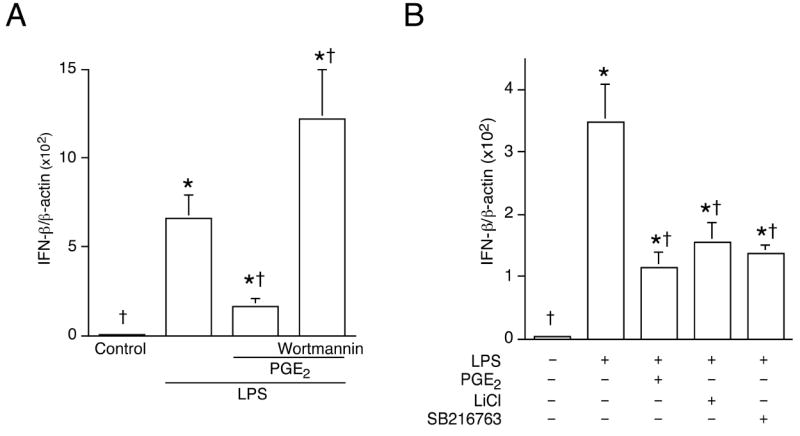
Cells were incubated or not with PGE2 following pre-treatment with the PI3K inhibitor wortmannin (1 μM) (A) or GSK3β inhibitors LiCl or SB216763 (B) for 30min, and then stimulated with LPS (100 ng/mL). Total RNA was harvested 2 h later. Real-time quantitative RT-PCR was used to analyze IFNβ and β-actin as described in Materials and Methods. *, p < 0.05 vs. untreated group; †, p < 0.05 vs. LPS alone, ANOVA/Student-Newman-Keuls.
GSK3β is a constitutively active protein kinase which becomes inactive upon Akt phosphorylation (19). To mimic Akt-induced inactivation, GSK3β inhibitors LiCl or SB216763 was used to pre-treat cells followed by LPS stimulation. Real-time quantitative RT-PCR showed that inactivating GSK3β reduced LPS-induced IFNβ gene expression, an effect similar to that of PGE2 (Fig. 10B).
Differential regulation of the PGE2-mediated signaling components on MyD88-dependent gene TNFα expression
TNFα is a prototypical cytokine induced via the MyD88-dependent signaling pathway downstream from TLR4. PGE2 has been reported to suppress LPS-induced TNFα expression and production (2). Real-time quantitative RT-PCR revealed that, similar to the regulation of IFNβ, both EP2 and EP4 receptors were involved in the PGE2-mediated suppression of TNFα gene expression (Fig. 11A). Moreover, 8-Br-cAMP mimicked the inhibitory effect of PGE2 (Fig. 11B). In contrast with findings on IFNβ, pretreatment with the PKA inhibitor H89 reversed the inhibitory effect of PGE2 on LPS-induced TNFα expression, whereas the Epac activator did not have an effect. Furthermore, treatment with a PI3K inhibitor prior to LPS stimulation did not alter TNFα gene expression (Fig. 11B).
Figure 11. LPS-induced TNFα gene expression is differentially regulated in response to PGE2.
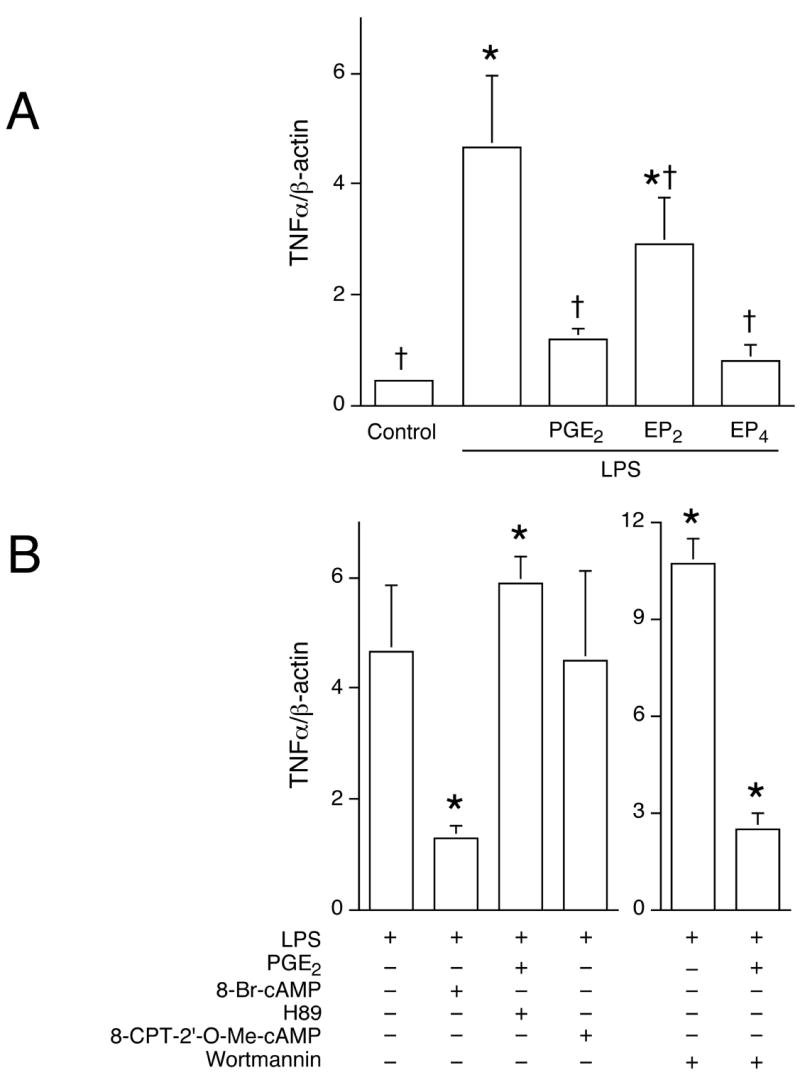
Cells were treated with PGE2 (50 ng/mL), EP2- or EP4-specific agonists (100 nM butaprost and 100 nM ONO-AE1-329) or with 8-Br-cAMP (100 μM), PKA inhibitor H89 (10 μM), Epac activator 8-CPT-2’-O-Me-cAMP (250 μM), or PI3K inhibitor wortmannin (1 μM; B) for 1 h, followed by LPS (100 ng/mL) stimulation for 2 h. Total RNA was extracted, and subjected to reverse transcription. Real-time quantitative PCR was conducted to analyze TNFα gene expression, normalized to β-actin as described in Materials and Methods. In (A), *, p < 0.05 vs. untreated group; †, p < 0.05 vs. LPS alone, ANOVA/Student-Newman-Keuls test. In (B), *, p < 0.05 vs. LPS alone, ANOVA/Student-Newman-Keuls test.
PGE2 regulates post-endotoxin serum IFNβ
The biological relevance of in vitro results was tested in vivo. Animals were given the non-selective COX inhibitor ketorolac (20 mg/kg) prior to LPS challenge (1 mg/kg) and the serum concentration of IFNβ was measured 2 h later. ELISA analysis showed that IFNβ level was higher (184 ± 41 IU/mL) in ketorolac-treated animals than in saline injected controls (104 ± 49 IU/mL) (p < 0.05, Mann-Whitney U test). The serum IFNβ level in naive animals was below 5 IU/mL (data not shown).
Discussion
Lipid mediators such as PGE2 can regulate immune and inflammatory responses by modulating the production of cytokines and chemokines. PGE2 has previously been shown to suppress MyD88-dependent pro-inflammatory gene expression, including TNFα, IL-1, and CCL4, by macrophages (2, 4, 5). In this study, we report that PGE2 modulates TLR3- and TLR4-dependent, MyD88-independent gene expression in these cells.
PGE2 was found to exhibit a strong inhibitory effect on LPS-induced IFNβ mRNA and protein production in cultured murine J774A.1 macrophages (Fig. 1). The suppressive effect of PGE2 was dose-dependent and occurred in a concentration range that is physiologically relevant (fluids collected from sterile wounds in mice contain 54 ± 14 pg/mL of PGE2, unpublished observation). The finding that PGE2 could suppress LPS-induced CCL5 production, as well as TLR3-dependent IFNβ production indicates that the inhibitory effect of PGE2 is not restricted to IFNβ or to TLR4 ligand, but extends to other genes regulated via MyD88-independent signaling cascade, as well as to TLR3 activation (Fig. 2).
PGE2 exerts its biological actions by binding to E prostanoid receptors (EPs) located mainly on the plasma membrane (20). Although EP1 mRNA expression was detected in J774A.1 cells, 17-phenyl trinor PGE2 (EP1 agonist) failed to trigger intracellular Ca2+ influx, suggesting that EP1 may not be a functional receptor in J774A.1 cells. Moreover, 17-phenyl trinor PGE2 cannot duplicate the effect of PGE2 on LPS-induced IFNβ production. EP2 and EP4 receptors are coupled to the stimulation of adenylyl cyclase activity via Gs protein, leading to elevations of intracellular cAMP (21, 22). The presence of PGE2 receptor subtypes 2 and 4 (EP2 and EP4), in J774A.1 macrophages has been reported elsewhere (23) and was confirmed here (Fig. 4). Stimulation with either EP2- or EP4-specific agonists increased intracellular cAMP in the cells and had a suppressive effect on LPS-triggered IFNβ production (Fig. 5). Half-maximal inhibition of LPS-induced IFNβ production was obtained with 100 nM butaprost and with less than 10 nM ONO-AE1-329 (Fig. 6). Both binding affinity (12) and expression level of EP4 mRNA could explain the stronger potency of ONO-AE1-329, a conclusion supported by the higher intracellular cAMP formation after EP4 stimulation.
The activation of EP2 and EP4 receptors leads to increases in intracellular cAMP. That both the adenylyl cyclase activator forskolin and the cAMP analogue 8-Br-cAMP could mimic the inhibitory effect of PGE2 on LPS-induced IFNβ gene expression and protein production (Fig. 7) indicated that cAMP is required for the inhibitory effect of PGE2. Cyclic AMP signals through the recruitment of intracellular protein targets, including at least PKA and Epac (13, 24). The use of H89, a specific inhibitor of PKA, did not lead to reversal of the inhibitory effect of PGE2 on LPS-induced IFNβ expression or protein production (Fig. 8A). The lack of H89 effect was not due to the absence of PKA in these cells because PKA was found to be essential in the regulation of LPS-induced TNFα gene expression by PGE2 (Fig. 11). On the other hand, the Epac activator, 8-CPT-2’-O-Me-cAMP suppressed LPS-induced IFNβ production in a dose-dependent manner (Fig. 8B), similar to the effects brought about by PGE2 itself and by a cAMP analogue. Taken together, the results indicate that cAMP mediates the suppressive effect of PGE2 on IFNβ via an Epac-dependent, PKA-independent pathway in J774A.1 cells.
Cyclic AMP has been reported to mediate PI3K activation through Epac (25). Fig. 9 demonstrates that PGE2, EP2/EP4 agonists, a cAMP analogue, or an Epac-specific activator can induce PI3K/Akt activation. Paradoxically, LPS can also trigger Akt phosphorylation (Fig. 9C). It is, therefore, unclear as how both LPS and PGE2 can activate PI3K/Akt activities, yet the two treatments (LPS vs. PGE2 + LPS) produced opposite effects on IFNβ production. The duration and/or magnitude of Akt activation may be critical in determining the level of IFNβ production. Furthermore, additional regulatory pathway(s) could be activated or suppressed in response to LPS and/or PGE2, leading to different effects on IFNβ production. That blocking PI3K activity with wortmannin resulted in enhanced IFNβ mRNA expression provides direct evidence that PI3K is a negative regulator for IFNβ production in macrophages (Fig. 10A).
GSK3β is a serine/threonine kinase whose activity is inhibited by Akt-dependent phosphorylation. We found that inhibiting GSK3β activity could mimic the effect of PGE2 (Fig. 10B), supporting the hypothesis that PGE2 inhibits LPS-induced IFNβ gene expression through a PI3K/Akt/GSK3β signaling pathway. GSK3β has been implicated in the control of p65/NFκB transcriptional activity in the context of TNFα signaling (26). However, the role of GSK3β in the regulation of IFNβ expression in macrophages is currently undefined.
The regulation of signaling components downstream from PGE2 and EPs on LPS-induced, MyD88-dependent TNFα was also analyzed. Data presented in Fig. 11 showed a pattern of differential regulation of TNFα vs. IFNβ, where the point of divergence occurs downstream from cAMP. In contrast to findings on IFNβ, blocking PKA activity with H89 completely reversed the inhibitory effect of PGE2 on LPS-induced TNFα gene expression, whereas the Epac activator had no effect. Moreover, PI3K and its downstream signaling components Akt and GSK3β were not involved in the suppression of LPS-induced TNFα production by PGE2 (Fig. 11). The divergent regulation of type I IFN and TNFα expression is indicative of the tight regulation under which immune cells function. Although activated by a common upstream second messenger cAMP, differential modulation allows PKA and Epac to exert different effects on their downstream targets. The involvement of distinct intracellular pathways resulting in the regulation of MyD88-dependent and -independent genes by PGE2 provides potential targets for therapies directed towards the regulation of inflammatory responses. In conclusion, the present study demonstrates that PGE2 negatively regulates the production of type I IFN (IFNβ) through EP2 and EP4 in murine macrophages, and in vivo in LPS injected mice. These findings confirm a substantial role for PGE2 in modulating the magnitude of inflammatory responses.
Acknowledgments
The authors thank Ms. Nicole Morin for her assistance in performing Ca2+ influx experiment and Dr. Jean M. Daley for critical review of the manuscript.
This work was supported by grant from the National Institutes of Health (GM-42859 (to J.E.A)).
Footnotes
Disclosures—The authors have no financial conflict of interest.
References
- 1.Kunkel SL, Spengler M, May MA, Spengler R, Larrick J, Remick D. Prostaglandin E2 regulates macrophage derived tumor necrosis factor gene expression. J Biol Chem. 1988;263:5380–5384. [PubMed] [Google Scholar]
- 2.Kunkel SL, Wiggins RC, Chensue SW, Larrick J. Regulation of macrophage tumor necrosis factor production by prostaglandin E2. Biochem Biophys Res Commu. 1986;137:404–410. doi: 10.1016/0006-291x(86)91224-6. [DOI] [PubMed] [Google Scholar]
- 3.Bogdan C, Vodovotz Y, Nathan CF. Macrophage deactivation by interleukin 10. J Exp Med. 1991;174:1549–1555. doi: 10.1084/jem.174.6.1549. [DOI] [PMC free article] [PubMed] [Google Scholar]
- 4.Brandwein SR. Regulation of interleukin 1 production by mouse peritoneal macrophages. J Biol Chem. 1986;261:8624–8632. [PubMed] [Google Scholar]
- 5.Jing H, Vassiliou E, Ganea D. Prostaglandin E2 inhibits production of the inflammatory chemokines CCL3 and CCL4 in dendritic cells. J Leukoc Biol. 2003;74:868–879. doi: 10.1189/jlb.0303116. [DOI] [PubMed] [Google Scholar]
- 6.Kawai T, Adachi O, Ogawa T, Takeda K, Akira S. Unresponsiveness of MyD88-deficient mice to endotoxin. Immunity. 1999;11:115–122. doi: 10.1016/s1074-7613(00)80086-2. [DOI] [PubMed] [Google Scholar]
- 7.Bjorkbacka H, Fitzgerald KA, Huet F, Li X, Gregory JA, Lee MA, Ordija CM, Dowley NE, Golenbock DT, Freeman MW. The induction of macrophage gene expression by LPS predominantly utilizes Myd88-independent signaling cascades. Physiol Genomics. 2004;19:319–330. doi: 10.1152/physiolgenomics.00128.2004. [DOI] [PubMed] [Google Scholar]
- 8.Weinstein SL, Finn AJ, Dave SH, Meng F, Lowell CA, Sanghera JS, DeFranco AL. Phosphatidylinositol 3-kinase and mTOR mediate lipopolysaccharide-stimulated nitric oxide production in macrophages via interferon-beta. J Leukoc Biol. 2000;67:405–414. doi: 10.1002/jlb.67.3.405. [DOI] [PubMed] [Google Scholar]
- 9.Raj NB, Pitha PM. Two levels of regulation of b-interferon gene expression in human cells. Proc Natl Acad Sci USA. 1983;80:3923–3927. doi: 10.1073/pnas.80.13.3923. [DOI] [PMC free article] [PubMed] [Google Scholar]
- 10.Whittemore LM, Maniatis T. Postinduction turnoff of beta-interferon gene expression. Mol Cell Biol. 1990;64:1329–1337. doi: 10.1128/mcb.10.4.1329. [DOI] [PMC free article] [PubMed] [Google Scholar]
- 11.Sugimoto Y, Narumiya S, Ichikawa A. Distribution and function of prostanoid receptors: studies from knockout mice. Progress in Lipid Research. 2000;39:289–314. doi: 10.1016/s0163-7827(00)00008-4. [DOI] [PubMed] [Google Scholar]
- 12.Tsuboi K, Sugimoto Y, Ichikawa A. Prostanoid receptor subtypes. Prostaglandins & other lipid mediators. 2002;68-69:535–556. doi: 10.1016/s0090-6980(02)00054-0. [DOI] [PubMed] [Google Scholar]
- 13.de Rooij J, Zwartkruis FJT, Verheijen MHG, Cool RH, Nijman SMB, Wittinghofer A, Bos JL. Epac is a Rap1 guanine-nucleotide-exchange factor directly activated by cyclic AMP. Nature. 1998;396:474–477. doi: 10.1038/24884. [DOI] [PubMed] [Google Scholar]
- 14.Aronoff DM, Canetti C, Serezani CH, Luo M, Peters-Golden M. Macrophage inhibition by cyclic AMP (cAMP): differential roles of protein kinase A and exhange protein directly activated by cAMP-1. J Immunol. 2005;174:595–599. doi: 10.4049/jimmunol.174.2.595. [DOI] [PubMed] [Google Scholar]
- 15.Fukao TK, Koyasu S. PI3K and negative regulation of TLR signaling. Trends in Immunol. 2003;24:358–363. doi: 10.1016/s1471-4906(03)00139-x. [DOI] [PubMed] [Google Scholar]
- 16.Jing H, Yen J-H, Ganea D. A novel signaling pathway mediates the inhibition of CCL3/4 expression by prostaglandin E2. J Biol Chem. 2004;279:55176–55186. doi: 10.1074/jbc.M409816200. [DOI] [PubMed] [Google Scholar]
- 17.Li J, Yang S, Billiar TR. Cyclic nucleotides suppress tumor necrosis factor alpha-mediated apoptosis by inhibiting caspase activation and cytochrome c release in primary hepatocytes via a mechanism independent of Akt activation. J Biol Chem. 2000;275:13026–13034. doi: 10.1074/jbc.275.17.13026. [DOI] [PubMed] [Google Scholar]
- 18.Fujino H, West KA, Regan JW. Phosphorylation of glycogen synthase kinse-3 and stimulation of T-cell factor signaling following activation of EP2 and EP4 prostanoid receptors by prostaglandin E2. J Biol Chem. 2002;277:2614–2619. doi: 10.1074/jbc.M109440200. [DOI] [PubMed] [Google Scholar]
- 19.Cross DAE, Alessi DR, Cohen P, Andjelkovich M, Hemmings BA. Inhibition of glycogen synthase kinase-3 by insulin mediated by protein kinase B. Nature. 1995;378:785–789. doi: 10.1038/378785a0. [DOI] [PubMed] [Google Scholar]
- 20.Narumiya S. Prostanoid receptors. Structure, function and distribution. Ann New York Acad Sci. 1994;744:126–138. doi: 10.1111/j.1749-6632.1994.tb52729.x. [DOI] [PubMed] [Google Scholar]
- 21.Nishigaki N, Negishi M, Honda A, Sugimoto Y, Namba T, Narumiya S, Ichikawa A. Identification of prostaglandin E receptor ‘EP2’ cloned from mastocytoma cells as EP4 subtype. FEBS Lett. 1995;364:339–341. doi: 10.1016/0014-5793(95)00421-5. [DOI] [PubMed] [Google Scholar]
- 22.Honda A, Sugimoto Y, Namba T, Watabe A, Irie A, Negishi M, Narumiya S, Ichikawa A. Cloning and expression of a cDNA for mouse prostaglandin E receptor EP2 subtype. J Biol Chem. 1993;268:7759–7762. [PubMed] [Google Scholar]
- 23.Katsuyama M, Ikegami R, Karahashi H, Amano F, Sugimoto Y, Ichikawa A. Characterization of the LPS-stimulated expression of EP2 and EP4 prostaglandin E receptors in mouse macrophage-like cell line, J774.1. Biochem Biophys Res Commu. 1998;251:727–731. doi: 10.1006/bbrc.1998.9540. [DOI] [PubMed] [Google Scholar]
- 24.Daniel PB, Walker WH, Habener JF. Cyclic AMP signaling and gene regulation. Annu Rev Nutr. 1998;18:353–383. doi: 10.1146/annurev.nutr.18.1.353. [DOI] [PubMed] [Google Scholar]
- 25.Mei FC, Qiao J, Tsygankova OM, Meinkoth JL, Quilliam LA, Cheng X. Differerntial signaling of cyclic AMP. J Biol Chem. 2002;277:11497–11504. doi: 10.1074/jbc.M110856200. [DOI] [PubMed] [Google Scholar]
- 26.Hoeflich KP, Luo J, Rubie EA, Tsao MS, Jin O, Woodgett JR. Requirement for glycogen synthase kinase-3beta in cell survival and NF-kappaB activation. Nature. 2000;406:86–90. doi: 10.1038/35017574. [DOI] [PubMed] [Google Scholar]


