Abstract
TRPC5 are non-specific cation channels activated through phospholipase C-dependent pathways, although the precise gating mechanism is unknown. TRPC5 current-voltage relationships (I-Vs) change systematically during the activation-deactivation cycle, shifting between outwardly rectifying and doubly rectifying shapes. Since several TRP family members exhibit voltage-dependent properties, we investigated whether the various I-V relationships were due to changes in gating. Using patch-clamp recordings of rat TRPC5 transfected HEK293 cells, we found that TRPC5 currents had distinct biophysical characteristics correlated with individual I-V shapes, a phenomenon we call ‘phases.’ At rest, channels were closed at most potentials, although strong depolarizations (>+80 mV) stimulated small outward currents (Phase 0). For 10-15 sec after activation, voltage steps evoked small inward and large outward currents with time- and voltage-dependent kinetics (Phase 1, outwardly-rectifying I-Vs). At maximal inward amplitude, currents were voltage-independent at all potentials (Phase 2, doubly-rectifying I-Vs owing to Mg(2+) block). During desensitization (Phase 3), currents reverted to a Phase 1-like voltage-dependence. La(3+) ions potentiated inward TRPC5 currents by promoting a reversible transition from Phase 3 to Phase 2. Single channel recordings revealed asymmetric conductance properties with values of approximately 40 pS at negative potentials and approximately 130 pS at >+60 mV. Mutation of D633, a cytoplasmic residue that mediates Mg(2+) block, decreased channel activity at negative potentials during Phase 2. We conclude that TRPC5 gating properties can switch reversibly between voltage-dependent and voltage-independent states. The modulation of phase transitions by external agents such as La(3+) and EBP50, a scaffolding protein, may constitute a novel mechanism for regulation of channel activity.
Keywords: TRPC channel, non-selective cation channel, patch clamp
INTRODUCTION
Transient Receptor Potential (TRP) proteins form cation-selective ion channels that have been implicated in a broad array of functional roles, ranging from sensing temperature, odorants, or osmolarity to transducing responses to neurotransmitters and hormones. The larger TRP family consists of three major subfamilies, TRPC(1-7), TRPV(1-6), and TRPM(1-8), as well as the smaller groups of TRPP and TRPML with 3 members each and a single TRPA channel (Nilius et al. 2007). TRPC (‘canonical’ TRP) proteins form Ca2+-permeable channels that mediate receptor and store-operated Ca2+ influx in excitable and non-excitable cell types (Clapham, 2003; Vazquez et al. 2004; Ambudkar, 2006). TRPC4 and TRPC5 are two closely related channels, with significant homology and similar biophysical properties, which are abundant in neurons and cells of the cardiovascular system and are also found in non-excitable cells of other tissues.
The precise mechanism of activation of TRPC channels is not understood (Putney, 2005; Ambudkar, 2006; Ramsey et al. 2006). TRPC channels respond to stimuli from G-protein coupled receptors (GPCR) and receptor tyrosine kinases (RTK; Schaefer et al. 2000). A signal downstream of phospholipase C (PLC) is required for TRPC activation (Clapham, 2003). TRPC3 and TRPC6 channels can be activated by diacylglycerol (DAG), a metabolite of PLC, but other members of the group are insensitive (Hofmann et al. 1999; Venkatachalam et al. 2003; Ramsey et al. 2006).
Under certain conditions, activation appears to require translocation of the channel from cytoplasmic vesicles to the plasma membrane. TRPC5 activation by epidermal growth factor in developing neurites requires exocytotic insertion of the channels (Bezzerides et al. 2004). This process is mediated by RTK and is relatively slow (tens of seconds) compared to activation by agonists of GPCR which is detectable within ∼1 sec (Schaefer et al. 2000; Obukhov and Nowycky, 2002).
Recently, an unusual form of activation was proposed for several TRP channel family members. At rest, TRPM4, TRPM8, TRPV1 and TRPV4 are closed at physiological potentials, but exhibit voltage-dependent gating when the membrane is depolarized to strongly positive, non-physiological voltage ranges. The ‘activation mechanism’ involves a leftward shift of the voltage range for channel opening (Voets et al. 2004; Nilius et al. 2005; Voets et al. 2007).
TRPC5 and the closely related TRPC4 channel have unorthodox and variable current-voltage relationships (I-Vs). In whole-cell voltage-clamp recordings, the I-V shapes obtained with brief voltage-ramps can be singly or doubly-rectifying (Schaefer et al. 2000; Strübing et al. 2001; Plant and Schaefer, 2003; Obukhov and Nowycky, 2004; 2005). Recently, we reported that following TRPC5 activation the I-V shape changes occur in a highly reproducible temporal sequence which we called ‘phases’ of channel activity (Obukhov and Nowycky, 2004). Significantly, we found that EBP50, a cytoskeletal scaffolding protein which binds to a C-terminus PDZ-domain binding motif on TRPC4 and TRPC5, slowed the rate of transition between two phases, without affecting the characteristics of the I-Vs in either phase. This suggests that the duration of individual phases is regulated by factors external to the channels and that such regulation may be a significant component or modulator of the activation-deactivation processes.
In this study we considered two general mechanisms that might underlie phases. First, channels may undergo changes of gating properties similar to those exhibited by members of the TRPV and TRPM families (Nilius et al. 2005). Second, the conductance characteristics of the active channels may change. This could be due to a change in the properties of one channel population or to the recruitment of a distinct population of TRPC5 or other channels.
To date, most TRPC voltage-clamp studies have been performed by recording currents at a constant membrane holding potential or by intermittently administering brief voltage ramps. Both of these experimental protocols obscure aspects of whole-cell current kinetics and voltage-dependence. Therefore we used voltage step protocols to analyze the time- and voltage-dependence of whole-cell currents. We also performed single channel experiments to determine the contribution of conductance properties to the changes of macroscopic current amplitudes during activation and deactivation.
Here we present evidence that the I-V shapes observed in macroscopic recordings of TRPC5 channels result from changes in the gating properties of the channels rather than changes in the mean unitary single-channel amplitude or the recruitment of distinct channel populations. In contrast to other voltage-dependent TRP channels that exhibit shifts in the activation range, TRPC5 channels transition between voltage-dependent and voltage-independent states. We also demonstrate that La3+ ions potentiate inward currents by promoting a reversible transition to the voltage-independent phase. These results provide insight into the mechanism of activation-deactivation of TRPC5 channels and suggest that the channels may be under novel forms of modulation that change macroscopic current amplitudes by modifying transition rates between phases.
Materials and Methods
Cell transfection
HEK293 cells (ATCC, Rockville, MD) were maintained in Earle's minimal essential medium supplemented with non-essential amino acids, 1 mM pyruvate, 2 mM glutamine and 10% fetal calf serum. Cells were transfected using Lipofectamine 2000 (Invitrogen, Carlsbad, CA). Transfected cells were seeded onto glass coverslips. Mouse H1-receptor tagged with YFP (H1R-YFP) was used as a reporter protein to identify transfected cells. In control experiments, the TRPC5 cDNA was substituted by an equivalent amount of pcDNA3.1. All experiments were performed at room temperature, 48-72 hours after transfection.
Molecular biology
The clones used were: rat TRPC5 (accession #: AY064411); mouse H1-histamine receptor (accession #: D50095). The H1-receptor fused to yellow fluorescent protein (YFP) served as a reporter cDNA. TRPC5 clones were subcloned into the BamH I/Xba I and Xho I/Xba I sites of the pcDNA3.1 vector (Invitrogen, Carlsbad, CA). Generation of the D633N mutant is described in Obukhov & Nowycky (2005).
Electrophysiology
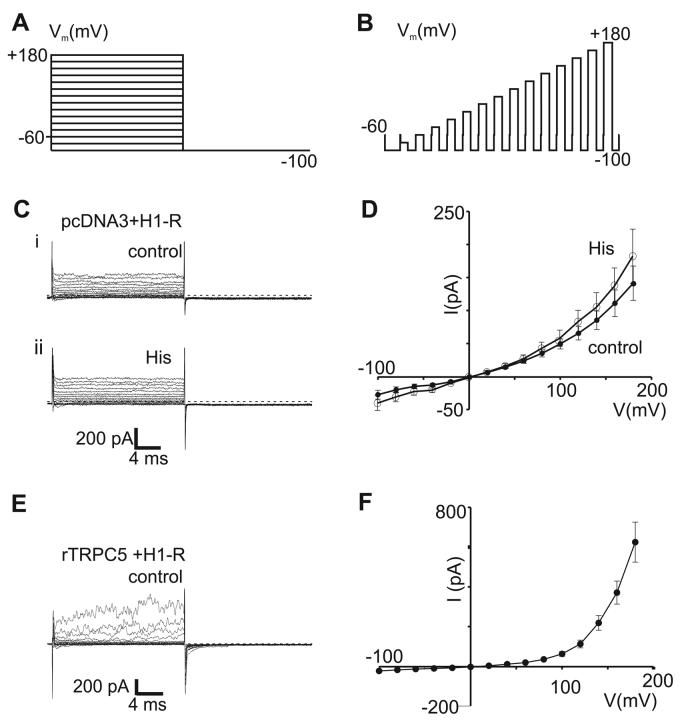
Whole-cell patch-clamp experiments were performed using an Axopatch 200B patch-clamp amplifier. Currents were activated by histamine (10 μM, Sigma, St. Louis, MO) which was added directly to the bath or by dialysis of GTPγS via the recording pipette (500 μM, Calbiochem, San Diego, CA). Cells were voltage-clamped at a potential of −60 mV. The acquisition rate was set to 1 kHz and currents were filtered at 3 kHz. Series resistance compensation was set to 50%. For step-protocol experiments, cells were periodically stimulated with a train of pulses. During the train, the potential was stepped from −100 to +180 or +200 mV at 20 mV intervals. Each test potential was held for 20 msec and then returned to −100 mV for 20 ms before proceeding to the next test potential (see Figure 1A, 1B).
Figure 1. Endogenous currents in control and rTRPC5-transfected HEK293 cells.
A-D. Whole-cell recordings in HEK293 cells transfected with H1R-YFP and empty pcDNA3.1 vector. A, B. The stimulation protocol is illustrated with voltage steps superimposed (A) and in sequence (B). C. Superimposed current traces evoked before (i) and after (ii) histamine application. D. I-V plots of averaged current amplitudes measured over the last 5 msec of the 20 msec voltage step, before (‘control’) and after (‘His’) histamine application (n=11 and 6, respectively, mean ± S.E.M.). E-F. Whole-cell recordings in HEK293 cells co-transfected with H1R-YFP and rTRPC5. E. Superimposed current traces evoked by step protocols. F. I-V plot of current amplitudes averaged over the last 5 msec of the 20 msec voltage step (n=5, mean ± S.E.M.).
Single-channel patch-clamp experiments were performed in both cell-attached and excised outside-out mode. Currents were filtered at 3 kHz and sampled at 10 kHz or 100 kHz. Only relatively long channel openings (>1 ms) were used for analysis. Unitary single-channel amplitudes were calculated from Gaussian fits to data collected from 20-40 second records at indicated potentials except data points at potentials exceeding +120 mV, which were estimated from short 40 ms records due to markedly reduced patch stability at these potentials. In single-channel current-voltage plots, averaged unitary single-channel amplitudes are shown.
Statistics and Analysis
Student's t-test was used to determine the significance of the results (p<0.05 was considered as the significance level). Data were expressed as mean±S.E.M. Single channel activity was expressed as the product of the number of channels in the patch times the open probability (NPo) measured over 10 sec intervals, calculated using PCLAMP9 software. In whole-cell experiments, NPo was calculated as:
where, “I” is the whole-cell current amplitude and “i” is the unitary single-channel amplitude at each holding potential.
Solutions
Experimental solutions contained (in mM):
Whole-cell recordings
Standard extracellular: 150 NaCl, 2 CaCl2, 1 MgCl2, 10 HEPES, 10 Glucose (pH=7.2, NaOH); Cl−-free: 150 Sodium Isethionate, 2 Ca(gluconate)2, 1 Mg(gluconate) 2, 10 HEPES, 10 Glucose (pH=7.2, NaOH). Intracellular: 135 CsMethylSO3, 10 CsCl, 1 MgCl2, 0.5 EGTA, 10 HEPES (pH=7.2, TrisOH).
Single-channel experiments
Cell-attached patches: Bath and Pipette: 150 NaCl, 2 CaCl2, 1 MgCl2, 10 HEPES, 10 Glucose (pH=7.2, NaOH). Excised, outside-out patches: Bath: (Cl− -free) 150 Sodium Isethionate, 2 Ca(gluconate)2, 1 Mg(gluconate) 2, 10 HEPES, 10 Glucose (pH=7.2, NaOH). Pipette: 135 CsMethylSO3, 10 CsCl, 1 MgCl2, 0.5 EGTA, 10 HEPES (pH=7.2, TrisOH). Bath solution for some of the excised, outside-out experiments with wild-type channels was the standard, extracellular solution.
RESULTS
HEK293 cells have no TRPC5-like endogenous currents
We first determined whether HEK293 cells express TRPC5-like endogenous channels by performing experiments using cells co-transfected with the mouse histamine receptor (H1R) and empty pcDNA3 vector. Stimulation with brief voltage step protocols (Figure 1A,B) evoked small, time-independent currents in control HEK293 cells (Figure 1Ci). Current-voltage (I-V) relationships were plotted using current amplitudes measured at the end of 20 msec voltage step. The I-V relationship was approximately linear and ohmic throughout the voltage range of −100 to +180 mV (Figure 1D). In a few HEK293 cells, small endogenous voltage-dependent Na+ currents were seen (TTX-sensitive, data not shown). Application of histamine had no effect on the current amplitudes or kinetics (Figure 1Cii, 1D, n=6, p=0.43). These data are in good agreement with our previous results (Schaefer et al. 2000; Obukhov and Nowycky, 2004) and indicate that HEK293 cells exhibit no significant histamine-activated channels under our experimental conditions.
All remaining experiments were performed in cells co-transfected with H1R-YFP and rat TRPC5 (rTRPC5). rTRPC5 channels show little spontaneous activity at negative potentials when transiently expressed in HEK293 cells (Obukhov and Nowycky, 2004). Prior to histamine application, voltage-step protocols to negative potentials evoked inward currents that were small and indistinguishable from the endogenous current of control cells (Figure 1E). However, in contrast to endogenous currents, strong depolarizations to voltages > +80 mV activated some rTRPC5 channels even in the absence of agonist stimulation (Figure 1E). The voltage-stimulated outward currents decayed rapidly to baseline on return to −100 mV (τ ∼1-3 msec). The I-V relationship, measured at the end of 20 msec duration voltage steps, displayed marked outward rectification above +80 mV (Figure 1F). Thus small endogenous currents are readily distinguished from currents carried by TRPC5 channels, even in the absence of agonist stimulation.
Histamine-activated TRPC5 currents exhibit ‘phases’ of activity
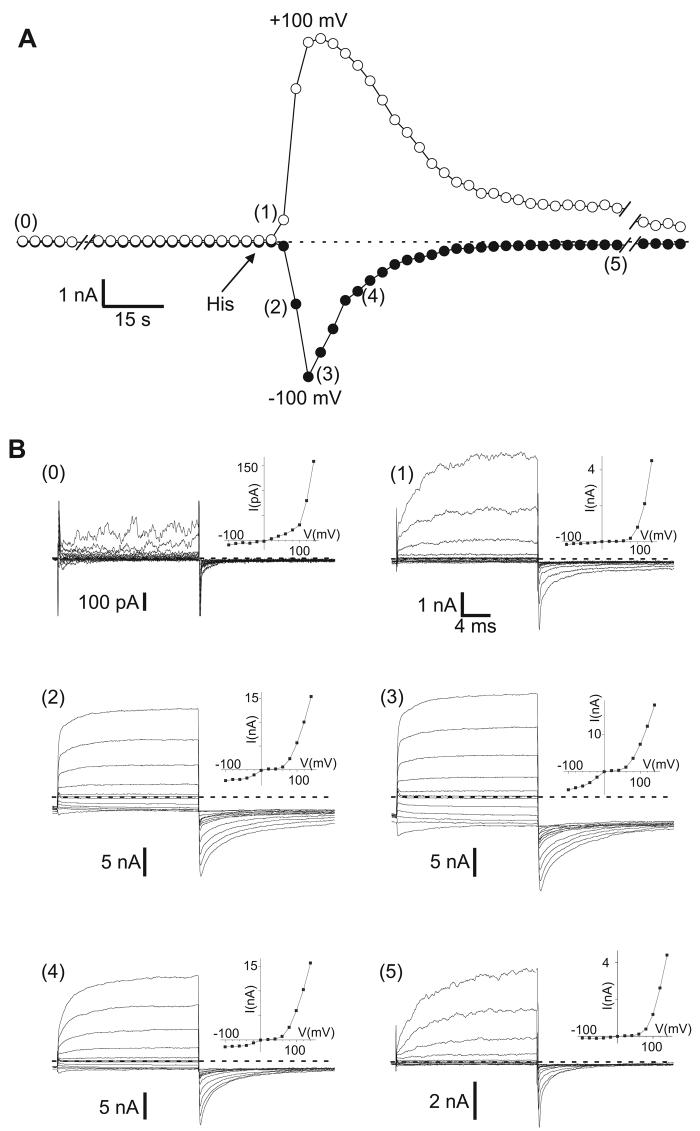
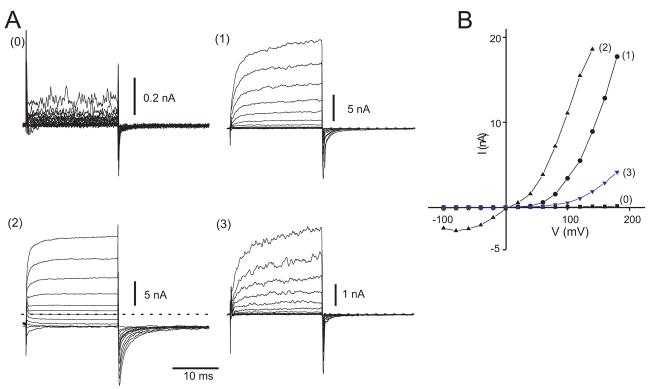
In HEK293 cells co-transfected with H1R and rTRPC5, histamine application evoked large, systematic changes of both inward and outward currents (Figure 2A). Voltage-step protocols were applied every 3 sec in order to examine the I-V and kinetic properties of the TRPC5 currents. We found that both the I-V relationships and the time- and voltage-dependent properties of currents changed systematically during the time course of histamine-evoked TRPC5 activity and describe these properties in terms of four distinct ‘phases.’
Figure 2. The biophysical properties of histamine-stimulated rTRPC5 currents change during activation and deactivation.
Whole-cell recording performed at a holding potential of −60 mV with cycles of voltage-step protocols administered at 3 sec intervals. A. Time course of inward current and outward currents measured at −100 and +100 mV during voltage step protocols. Histamine (His, 10 μM) was applied as indicated by arrow. B (0-5). Superimposed currents elicited by voltage step protocols corresponding to time points indicated in parentheses in A. Dashed lines represent zero current levels. Insets: I-V plots obtained from values averaged over the last 5 msec of the 20 msec voltage step in panel B.
Phase 0
Prior to histamine application, stimulus protocols evoked some outward currents and minimal inward currents (Figure 2B0) that resembled the current profiles in Figure 1E. The corresponding I-V relationship was strongly outwardly rectifying (Figure 2B0, inset).
Phase 1
During the first ∼1-5 sec after histamine application, outward currents increased rapidly, while inward currents increased only slightly (Figure 2B1). The I-V shape remained strongly outwardly rectifying, while the absolute amplitudes increase >20-fold (Figure 2B1, inset). During depolarizing voltage-steps, outward currents displayed voltage-gated characteristics: currents increased in a time-dependent manner during the 20 msec duration step and deactivated rapidly on return to −100 mV. The ‘tail current’ amplitudes observed immediately after repolarization increased proportionately to the strength of the depolarizing pulse, reflecting a voltage-dependent increase in number of open channels, and this current decayed within msec of repolarization.
Phase 2
Phase 1 lasted only a few seconds in the continued presence of histamine, after which both inward and outward currents increased rapidly. At peak current amplitudes, ∼10-30 sec after histamine stimulation (Figure 2A), both the inward and outward currents evoked by depolarizing voltage-steps exhibited little or no time-dependence (Figure 2B3) and appeared to be voltage-independent. Tail currents deactivated slowly and incompletely and a prominent sustained current was observed at all negative potentials. I-V plots showed a characteristic ‘double rectification’ and the I-V relationship was nearly ohmic at negative potentials (Figure 2B3, inset). In the voltage range between 0 and +60 mV there was little outward current, due to channel block by intracellular Mg2+ (Obukhov and Nowycky, 2005).
Phase 3
From the peak amplitude of Phase 2, TRPC5 currents decreased to pre-stimulation baseline levels within ∼1-3 min (Figure 2A). As TRPC5 channels deactivated (or inactivated), the current characteristics changed from Phase 2-like and eventually strongly resembled Phase 1 (Figure 2B5), with little inward current, but sizeable voltage- and time-dependent outward currents. The I-V relationship became outwardly rectifying (Figure 2B5, inset).
Because phases are transient, throughout much of the experiment current traces exhibited mixed phase properties, as seen in Figures 2B2 and 2B4. Here, outward currents have both large time-dependent and -independent components. The tail currents recorded on return to −100 mV also have two current components: a sustained inward current and a decaying tail current. A significant sustained inward current is present at negative potentials. In I-V relationships, inward current amplitudes are small and flat over the range of −100 to −40 mV (Figures 2B2 and 2B4, insets).
We also tested whether contamination by Cl- currents could account for any phase properties. Voltage-step experiments were performed in solutions with extracellular Cl− replaced with isethionate (see Methods). The time- and voltage-dependence of histamine-evoked currents was identical to recordings in control solutions (data not shown).
La3+- ions potentiate GTPγS-stimulated rTRPC5 currents by promoting Phase 2
Low concentrations of La3+ ions potentiate whole-cell currents of TRPC5 or TRPC4 transfected cells (Schaefer et al. 2000; Strübing et al. 2001, Jung et al. 2003; Obukhov and Nowycky, 2004). The I-V relationship of La3+-potentiated currents shows double rectification, similar to that seen during peak inward current corresponding to Phase 2. We performed experiments to further analyze the kinetic properties of the currents.
For these studies, we used intracellular GTPγS to stimulate TRPC5 activity. The time course of a typical experiment is illustrated in Figure 3A, using values obtained by steps to −100 and +100 mV. Small increases of inward and outward currents were observed shortly after establishing the whole-cell configuration. In contrast to histamine-activation, this ‘Phase 1-like’ activity persisted for up to a minute (Figure 3A, (1)). The transition to Phase 2, once initiated, was relatively rapid, as both inward and outward currents increased to peak values in ∼10-20 sec (Figure 3A, (2)). From the peak, current amplitudes declined slowly and incompletely to new steady-state levels that were sustained for the duration of the experiment (Figure 3A, (3)). Application of La3+ strongly increased inward currents, while causing a small (∼30% decrease) of outward currents (Figure 3A, horizontal bar).
Figure 3. La3+ ions potentiate GTPγS-stimulated rTRPC5 currents by promoting Phase 2 characteristics.
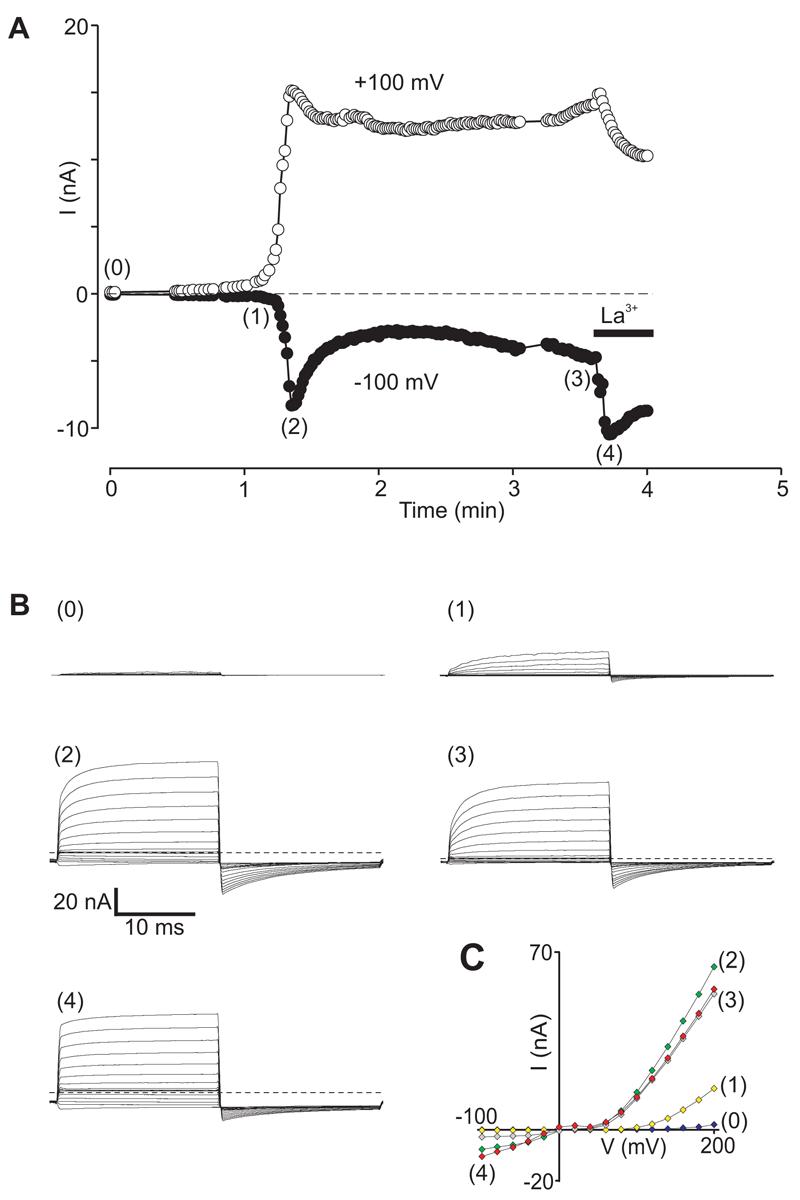
Whole-cell currents recorded in an H1R- and rTRPC5-transfected HEK293 cells infused with GTPγS via the patch pipette. Cells were held at −60 mV and stimulated with voltage-step protocols at 3 sec intervals. A. Time course of inward current and outward currents measured at −100 and +100 mV. La3+ (100 μM) was added to the bath as indicated by the bar. B (0-4). Superimposed currents elicited by voltage step protocols corresponding to time points indicated in A. Dashed lines represent zero current levels. C. I-V plots obtained at indicated time points.
Figure 3B illustrates the kinetics of currents evoked by voltage step protocols at several time points as indicated by corresponding numbers in Figure 3A. Immediately after formation of the whole-cell configuration, voltage step protocols evoked very small currents with Phase 0 properties (Figure 3B(0)). During the following ∼1 minute, whole-cell current properties corresponded to histamine-evoked Phase 1 (Figure 3B(1)) with time- and voltage-dependent currents elicited above +80 or +100 mV and an outwardly rectifying I-V relationship (Figure 3C). At peak amplitude the currents exhibited Phase 2 characteristics (Figure 3B(2), 3C), with sustained inward currents at negative potentials and time-independent currents during voltage-step changes.
From the peak, currents decayed to sustained amplitudes that remained elevated well-above baseline (Figure 3A). Voltage-step protocols elicited currents that exhibited a mixture of Phase 2 and Phase 1-like characteristics (Figure 3B(3), 3C).
Addition of La3+ ions to the extracellular solution during Phase 3 potentiated inward TRPC5 currents (Figure 3A). La3+-enhanced currents exhibited a nearly pure Phase 2 phenotype with no time- or voltage-dependence (Figure 3B(4)). The I-V relationship was ohmic at negative potentials (Figure 3C). The slight decrease at positive potentials is probably due to La3+ block of single channel currents (see below). The La3+ effect was fully reversible on washout (data not shown, e.g. see Jung et al. 2003). In general, La3+ ions evoked currents with purer Phase 2 properties than were observed at peak amplitudes, probably because the peak currents reflect a mixture of channels with Phase 2 as well as Phase 1 or Phase 3 properties. In histamine-stimulated cells, La3+ application induced a qualitatively similar effect (data not shown, but see Jung et al. 2003).
Single channel amplitudes do not change during phases
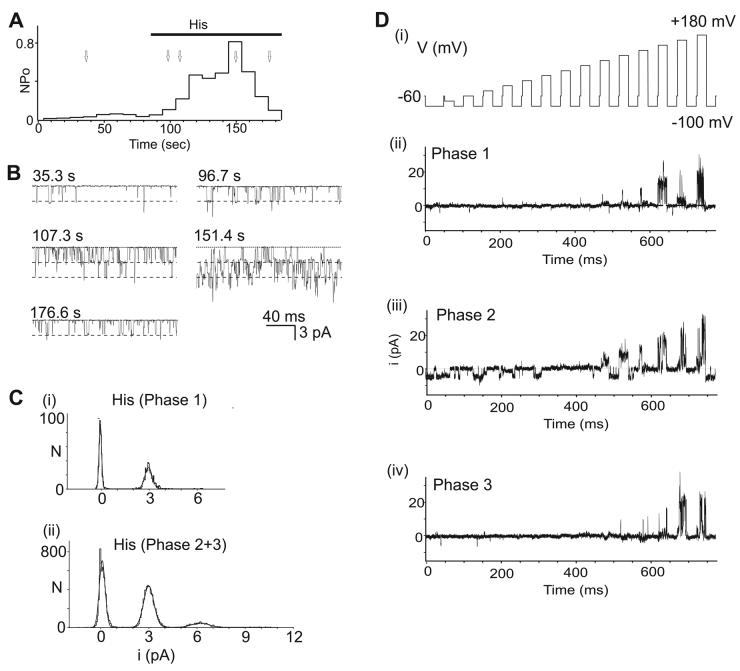
Next, we performed single channel experiments using cell-attached as well as outside-out patch recordings in H1R- and rTRPC5-transfected HEK293 cells. Patches that contained a few channels exhibiting low spontaneous TRPC5 activity were selected. Figure 4A illustrates a 200 sec recording of TRPC5 channel activity in a cell-attached patch before and after histamine addition to the bath. The data are plotted as NPo values computed and averaged over consecutive 10 sec intervals (see Methods). Channel activity was low and stable during more than a minute of baseline recording. On application of histamine to the cell, channel activity increased over ∼1 minute and then decayed to near baseline levels. The time course is similar to changes in current amplitudes seen in whole-cell recordings (Figure 2A).
Figure 4. Single channel conductance values of rTRPC5 channels are constant during histamine activation.
Cell-attached patch recording from an H1R- and rTRPC5-transfected cell. The patch was held at +60 mV, applying a trans-membrane potential of approximately −60 mV to channels. A. Time course of ‘NPo’ changes during the recording, calculated for each consecutive 10 s interval (see Methods). Histamine (10 μM) was added to the bath at the time indicated by the horizontal bar. B. Sample current traces shown at times indicated and by arrows in A. Dashed lines indicate unitary single channel amplitudes obtained from histograms in C. C. Amplitude histograms of single channel openings. Single-channel events longer than 1 ms were selected for analysis at various time points relative to application of histamine. Data prior to histamine application was collected at ∼ 0 to 30 sec (data not shown), during Phase 1 at ∼ 90 to 100 sec (i), and during Phase 2+3 at ∼120 to 180 sec (ii). The Gaussian fits to the data are shown as solid lines. During Phase 1 (i), shortly after histamine application, the histogram contains symmetrical baseline noise centered at 0 pA, and a single peak at ∼2.9 pA, while a third peak centered around 6 pA is seen during Phase 2+3 (ii). D. Single channel responses to stimulus train (i) recorded during Phase 1 (ii), Phase 2 (iii), and Phase 3 (iv).
The single channel amplitude was constant before and after histamine stimulation. Single channel currents at 5 times points are illustrated on an expanded time scale in Figure 4B. Dashed lines indicate the amplitude of unitary openings as determined in Figure 4C. During periods of high activity (e.g. 107.3 and 151.4 sec), there are numerous simultaneous openings which are multiples of the unitary conductance.
Mean single channel amplitudes were obtained from Gaussian fits to amplitude histograms (Figure 4C(i - ii)). Samples of current traces were taken before histamine application (data not shown), during Phase 1 (Figure 4C(i)), or during maximal activity, Phase 2-3 (Figure 4C(ii)). In all histograms, there is a sharp peak at ∼3pA, with an additional smaller peak at ∼6 pA observed during maximal activity (Figure 4C(ii)). The values for single channel openings at −60 mV correspond to previously published determinations (Obukhov & Nowycky, 2005, see Figure 3E).
These results indicate that TRPC5 single channels exhibit a single dominant conductance state which does not change throughout the experiment. Similar results were obtained in both cell-attached and excised outside-out recordings (data not shown, but see examples in Figure 5), and irrespective of whether channels were stimulated with histamine or GTPγS. We also tested single channel activity with stimulus trains using the same protocols as during whole cell recordings (Figure 4D(i)). Channel activity was detected only at strongly positive potentials during Phase 1 and 3 (Figure 4D(ii, iv)), but observed at all potentials during Phase 2 (Figure 4D(iii)). We conclude that the phases observed with whole-cell currents reflect changes in TRPC5 channel activity, not in conductance or in the appearance of a distinct channel type.
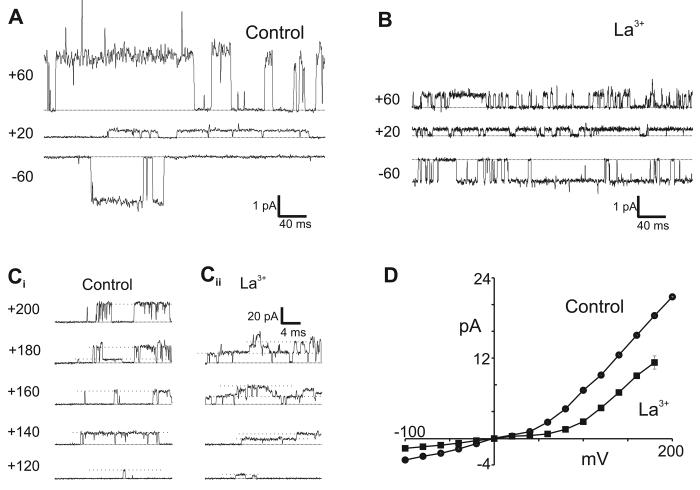
Figure 5. rTRPC5 channel conductance is asymmetric and decreased by La3+ ions.
Outside-out patch recordings from HEK293 cells in control and La3+ (100 μM) containing solution. The patches were held at potentials indicated. The bath (extracellular) solution was Cl−-free solution. A. Traces from one control patch at −60, +20, and +60 mV. B. Traces from a different patch at −60, +20 and +60 mV in the presence of 100 μM La3+. C. Traces obtained from patches held at potentials between +120 to +200 mV in control solution (Ci) and in the presence of 100 μM La3+ (Cii). D. Current-voltage relationship for single channel currents in control (circles) and La3+-containing (squares) extracellular Cl−-free solutions. Values from −100 to +100 mV were obtained from Gaussian fits. Values above +120 mV were determined by eye. Each point represents the mean ± S.E.M (n = 4-10).
Single channel conductance is non-linear and decreased by La3+
Single conductance values of TRPC5 channels were determined over the full potential range of −100 to +200 mV that was used to analyze whole-cell current properties. Previous reports indicated that the conductance of TRPC5 channels at negative potentials was linear with a value of ∼36-40 pS (Schaefer et al. 2000: Strübing et al. 2001; Jung et al. 2003; Obukhov and Nowycky, 2005). However, there was no information on single channel conductance at positive potentials, except for our determination of values at +30 and +60 mV (Obukhov and Nowycky, 2005).
For these experiments, we used GTPγS to stimulate channel activity in outside-out patches. Figure 5A illustrates single channel traces obtained in control solutions at 3 potentials. The amplitude at −60 mV is similar in outside-out (Figure 5A) and cell-attached experiments (Fig. 4C). Currents at +20 mV are very small due to Mg2+-dependent block and this block is relieved above ∼+60 or +80 mV (Obukhov and Nowycky, 2005). Addition of 100 μM La3+ decreased the unitary single-channel amplitude at both positive and negative potentials (Figure 5B; also Jung et al. 2003).
Next we extended the voltage range to strongly positive potentials (Figure 5C). At these potentials, patches were less stable, making it difficult to obtain sufficient data for histograms, and single channel amplitudes were determined by eye (dashed lines). Channel openings were very large at strongly positive potentials and a single maximal value was readily determined despite the presence of an occasional sub-conductance state (see trace +180 mV, Figure 5Ci). In agreement with an earlier report (Jung et al. 2003), addition of La3+ greatly increased channel activity, resulting in numerous simultaneous channel openings (Figure 5Cii). Nevertheless, unitary amplitudes were clearly visible and these were noticeably reduced compared to control solutions.
The averaged current amplitude values (i) of all single channel experiments are plotted in Figure 5D. The i-V plot reveals non-linear and asymmetric conductance properties. Single channel currents at negative potentials are linear with a slope conductance of ∼38 pS. At +20 and +40 mV, single channel current amplitudes are small as a result of block by intracellular Mg2+ (Obukhov and Nowycky, 2005). Above this potential range, current amplitudes were very large: the slope conductance was ∼134 pS between +60 to +200 mV, ∼3-fold greater than at negative potentials. These large values have not been previously reported as earlier experiments, including our own, did not test potentials above the region of Mg2+ block (e.g. > +60 mV).
La3+ ions decreased single channel amplitudes at all potentials. The slope conductance value was ∼ 20 pS at negative potentials, and ∼67 at positive potentials (Figure 5D). At negative potentials, therefore, La3+ ions decreased the apparent conductance by ∼50%. The value at positive potentials is similarly diminished, however, the slope values cannot be directly compared because the linear current-voltage relationship in the presence of La3+ ions begins at more positive values than in control experiments.
Channel activity, estimated as ‘NPo’, has a complex dependence on voltage
Since unitary single-channel amplitude is constant during the activation-deactivation cycle of TRPC5, the whole-cell current through TRPC5 channels at each given time and voltage is directly proportional to the product of unitary single-channel amplitude and ‘NPo’, where ‘N’ is the number of active channels and ‘Po’ their open probability (see Methods). We used the single channel amplitude data (Figure 5D) to estimate whether there are any voltage-dependent influences on channel activity.
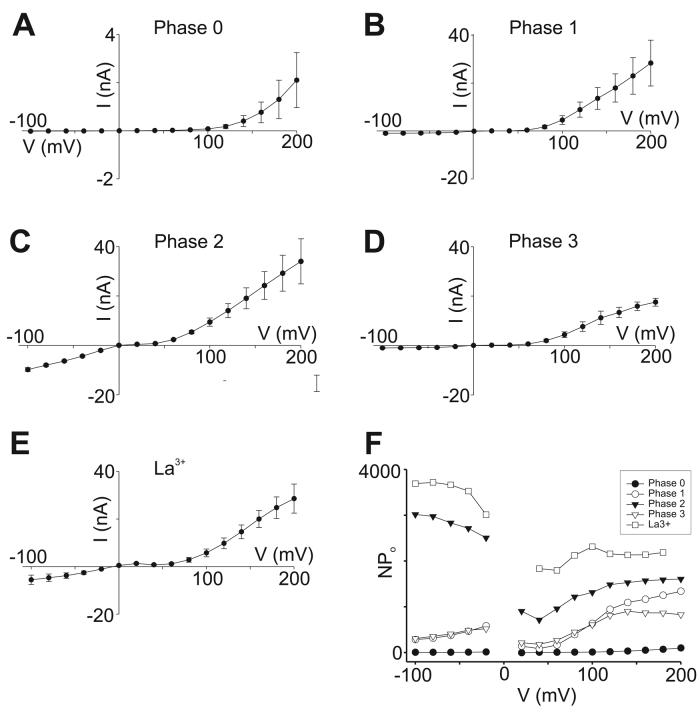
Whole-cell data were obtained from experiments performed with GTPγS-stimulated TRPC5 currents recorded in Cl−-free solutions. Stimulus-train protocols were applied as before, and the results are plotted in Figure 6 as averages of I-V relationships obtained during various points of the activation cycle. Phase 0 values were obtained shortly after establishing the whole-cell configuration (Figure 6A); Phase 2 values at the peak current (Figure 6C); Phase 1 between Phases 0 and 2 (Figure 6B); Phase 3 during the steady-state current (Figure 6D) and separately after addition of La3+ ions to the bath (Figure 6E). The averaged results closely resemble those seen in the exemplar cell shown in Figure 3. Figure 6F illustrates the results of dividing the averaged whole-cell I-V relationships by the unitary single-channel amplitudes shown in Figure 5. The following observations were made:
Figure 6. Estimates of channel activity, ‘NPo,’ from recordings of GTPγS-stimulated rTRPC5 currents.
A-E.Averaged I-V relationships from whole-cell recordings at different times following break-in and initiation of GTPγS perfusion. Data collected at: A. Phase 0: within seconds of establishing whole-cell perfusion. B. Phase 1: from 5-15 sec before peak current. C. Phase 2: at peak current. D. Phase 3: during steady-state currents. E. La3+ during Phase 3: from peak inward current after La3+ application. All recordings in Cl−-free extracellular solution. Number of cells = 5 in all panels except D, where n = 4. Bars indicate S.E.M. F. Averaged I-V data from panels A-E were divided by single channel values in Figure 5D and plotted as estimated NPo at each potential.
Phase 0
Channel activity at negative potentials is negligible. NPo increases slightly in a voltage-dependent manner at very strong depolarizations.
Phase 1
Channel activity at negative potentials is significantly elevated above pre-stimulus levels. The values of NPo show a very weak voltage-dependence, increasing ∼2-fold between −100 and −20 mV, although the trend does not reach statistical significance. At weakly positive potentials (+20 to +60 mV) in the region of Mg2+ block, NPo drops to lower values than those seen at negative potentials. From +80 to +200 mV, NPo increases ∼4-5-fold in a voltage-dependent manner.
Phase 2
NPo is high at all potentials with a weak and irregular correlation with voltage. Between −100 to −20 mV, NPo values exhibit a downward trend (∼17% decline) which just reaches statistical significance at the two outermost potentials. Between −20 to +20 mV there is an abrupt drop, almost halving NPo values. NPo rises modestly above +40 mV, plateauing at about +120-140 mV. The maximal Phase 2 values at +200 mV are similar to maximal values reached in Phase 1.
Phase 3
NPo values at all potentials are nearly identical to those of Phase 1.
La3+ (during Phase 3)
NPo activity is very high and nearly completely voltage-independent over the entire potential range from −100 to +200 mV. As in Phase 2, however, there is a downward trend between −100 to −20 mV, and a significant drop between −20 and +20 mV. The modest increase of NPo seen in Phase 2 at positive potentials is much less pronounced in the presence of La3+, suggesting less contamination with Phase 1 or 3 properties in the presence of the trivalent cation.
In summary, TRPC5 channels do not exhibit the hallmarks of a clearly defined leftward shift of activation potentials that is characteristic of the voltage-dependent group of TRP channels.
Cytoplasmic residue D633 modifies channel activity during Phase 2
The sharp drop in NPo values between −20 and +20 mV that was seen in all phases and in the presence of La3+ is puzzling. We wondered whether it was related to another unusual property of TRPC5 channels, block of outward currents by intracellular Mg2+ in the restricted range of 0 to +60 mV. Previously, we demonstrated that a single cytoplasmic residue, D633, was responsible for Mg2+ block and that mutation D633N effectively eliminated block of outward currents (Obukhov and Nowycky, 2005). We used our standard voltage pulse protocols to determine the biophysical properties of the D633N mutant.
Standard whole-cell recordings were performed in HEK293 cells co-transfected with H1R and the mutant D633N rTRPC5 channel. In most respects, the characteristics of histamine-evoked currents of D633N-transfected cells resembled those of wild-type channels. The time courses of activation and deactivation of inward current at −60 mV were similar (see Figure 2A in Obukhov & Nowycky, 2005). The kinetic features of currents evoked by pulse trains had similar time- and voltage-dependent characteristics in Phases 1 and 3, while currents evoked in Phase 2 (at the time of peak inward currents) were time- and voltage-independent with large sustained currents at negative potentials (Figure 7A0-3). The I-V relationship during Phase 2, however, differed from that of wild-type channels as the mutant channels lacked the prominent block between 0 and +60 mV (Figure 7B).
Figure 7. Histamine-stimulated currents through D633N mutant rTRPC5 channels.
Whole-cell currents recorded in an H1R- and D633N rTRPC5-transfected HEK293 cell stimulated with histamine. Cells were held at −60 mV and voltage-step protocols were administered at 3 sec intervals. A (0-3). Superimposed currents elicited by voltage step protocols. Dashed lines represent zero current levels. B. I-V plots obtained at corresponding time points.
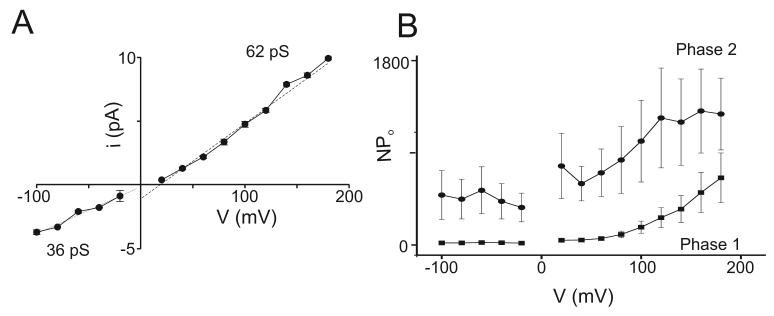
To analyze channel activity ‘NPo’ we first determined the single channel conductance of D633N channels over the range of −100 to +180 mV (Figure 8A). At negative potentials, the conductance was 36 pS, close to the value of 38 pS obtained for wild-type channels (see Figure 5D). Between +20 to +180 mV, the conductance was linear with a value of 62 pS, less than half of the conductance of wild-type channels (∼134 pS), although still 1.6 times the conductance at negative potentials. Thus, mutation D633N modifies outward current amplitudes in addition to eliminating Mg2+ block of the channel.
Figure 8. Estimates of channel activity, ‘NPo,’ for Phase 1 and Phase 2 of histamine-stimulated D633N mutant rTRPC5 channels.
A. Single channel current amplitudes from cell-attached recordings obtained as in Figures 4 and 5. Dashed lines are linear regression fits to data points at positive and at negative potentials with values of 36 pS at negative potentials and 62 pS at positive potentials (n=3-7 individual determinations for each data point). B. Averaged I-V data from experiments with D633N-transfected cells (n=7) were divided by single channel values and plotted as estimated NPo at each potential.
We then divided the whole-cell current amplitudes by the single channel amplitudes to estimate channel activity at each potential; averaged NPo values for Phase 1 and Phase 2 are illustrated in Figure 8B. Mutating residue D633 had only slight effects on channel activity at positive potentials during Phase 2. Maximal NPo values were ∼1300 for the mutant channel and ∼1700 for the wild-type channel. Unexpectedly, mutation D633N strongly modified NPo values at negative potentials, reducing maximal NPo values at −100 mV from ∼3000 for wild-type to ∼500 for D633N. This reduction abolished the abrupt discontinuity at 0 mV seen in experiments with wild-type channels. We conclude that cytoplasmic residue D633 exerts an influence on channel activity at negative potentials during Phase 2, while their effect on single channel conductance and Mg2+ block is exerted at positive potentials.
Discussion
Here we report that stimulation of rTRPC5 channels initiates a complex activation process in which channels first become available for opening and then undergo a series of systematic changes in biophysical properties. At peak inward current (Phase 2), channels are voltage-independent. Phase 2 is preceded and followed by phases in which channels have low activity at physiological potentials (Phase 1 and Phase 3), but exhibit voltage-dependent activity at non-physiological, strongly positive potentials. Low concentrations of La3+ ions potentiate TRPC5 current amplitudes by inducing a reversible transition to Phase 2.
Phases reflect changes in channel activity, not conductance
A single, uniform population of TRPC5 channels appears to be responsible for all currents observed on stimulation with a GPCR agonist or GTPγS as the single channel conductance does not change at any time during the activation-deactivation cycle. Changes of macroscopic TRPC5 current amplitude result from a combination of both changes in channel availability and gating properties. During the transition from Phase 0 (pre-stimulation) to Phase 1, there is a progressive increase of channel activity evoked at the strongest positive potentials (+180 or +200 mV), reflecting increased availability. The maximum number of channels available for opening appears to be constant during Phases 1, 2, and during the sustained Phase 3 observed with GTPγS stimulation. During Phase 3 there is progressive decline of both channel availability (measured in histamine-stimulated cells) and a shift from voltage-independent to dependent properties.
While Phase 2 is clearly distinct from Phases 1 and 3, the voltage protocols used here did not definitively distinguish the properties of Phase 1 from Phase 3. We choose to give separate labels to the currents that precede and follow Phase 2, based on several experimental observations. First, we have previously reported that EBP50, a scaffolding protein, prolonged Phase 1 but not Phase 3 (Obukhov and Nowycky, 2004). Second, activation of channels with GTPγS results in an indefinitely prolonged Phase 3 (Obukhov and Nowycky, 2005 and this paper). Finally, it has been reported that protein kinase C accelerates the ‘desensitization’ rate of TRPC5 (Zhu et al. 2005), an effect equivalent to modulation of Phase 3. Thus, until additional experiments establish a definitive kinetic scheme of TRPC5 channel behavior, it is convenient to use separate nomenclature for the three phases.
Single channel conductance properties
An unexpected finding in this study is that TRPC5 channels have strongly asymmetric conductances in the inward and outward directions. The slope conductance between −100 to 0 mV is ∼ 40 pS, in excellent agreement with previous reports of mouse and rat TRPC5 and TRPC4 (Yamada et al. 2000; Strübing et al. 2001; Jung et al. 2003). Between 0 and +60 mV is a region of very small single channel amplitudes due to block by intracellular Mg2+ as reported previously (Obukhov and Nowycky, 2005). Above +60 or +80 mV, Mg2+ block appears to be completely relieved and between +80 and +200 mV the conductance is linear and almost 3-times larger than at negative potentials (∼ 130 pS).
Previously, we had demonstrated that residue D633, which is predicted to lie close to the intracellular mouth of the channel, is responsible for intracellular Mg2+ block (Obukhov & Nowycky, 2005). Here we report that mutating D633 to asparagine significantly lowered the conductance of TRPC5 at positive potentials, but not at negative potentials (Figure 8). This result suggests that the asymmetric conductance of TRPC5 may be determined at least partially by negatively charged residues lying in the intracellular vestibules of the pore.
Voltage-dependence of TRPC5
On the basis of overall sequence similarity, TRP channels belong to the superfamily of voltage-gated ion channel (Yu et al. 2005). Indeed, several TRP channels, including TRPV1, TRPV3, TRPM4, and TRPM8, exhibit unusual forms of voltage-dependence (reviewed in Nilius et al. 2005). In the resting, non-activated state, these channels can be opened in a voltage-dependent manner at strongly positive potentials, well-outside the physiological range. On administration of the appropriate stimulus (e.g. heat or capsaicin for TRPV1, cold or menthol for TRPM8), there is a shift of the Boltzmann activation curve to a physiological voltage range.
Here we examined whether TRPC5 channels exhibit similar voltage-dependent properties. We used experiments with trains of voltage steps and report both similarities and also distinct differences from other voltage-dependent TRP channels. During Phases 1 and 3, outward currents are clearly voltage-dependent: activity increases over the range of +60-+80 to +200 mV (Figure 6). The properties of TRPC5 channels clearly differ from those of voltage-gated TRP channels during Phase 2. At peak inward current TRPC5 channels become voltage-independent over the entire range from −100 to +200 mV, as judged both by the lack of any time-dependent kinetics during step pulses to positive or negative potentials (Figures 2B, 3B) and from the plot of NPo vs. voltage (Figure 6F).
The molecular mechanism regulating TRPC5 activity transitions during the channel activation-deactivation cycle remains to be uncovered. There are several lines of evidence, however, that residues outside of the transmembrane domains are important for regulating TRPC5 activity. First, Phase 2 characteristics could be elicited by the addition of 100 μM La3+. La3+ -induced TRPC5 potentation was previously shown to be mediated by 3 negatively charged residues lying in the extracellular mouth of the pore (Jung et al. 2003). A possible role for a cytoplasmic residue is suggested by mutation D633N which decreased the activity at negative potentials during Phase 2. The field of TRPC channel structure-function is in its infancy and much remains to be done.
Conclusions
The data presented here indicate that TRPC5 can exist in both voltage-dependent and voltage-independent state during its activation cycle. Functionally, the voltage-independent state of TRPC5 (Phase 2) clearly supports the highest density of cation influx. During the voltage-dependent state (Phase 1 and 3), TRPC5 inward currents are much smaller. Since Phases 1 and 3 persist for considerably longer durations than Phase 2, however, they may also be responsible for a significant cumulative influx of cations.
The most significant aspect of phases may be regulation of transitions by external agents as a mechanism by which channel activity is modified following the initial stimulation. We have shown that EBP50, a cytoskeletal scaffolding protein with two PDZ-domains, prolongs the duration of Phase 1 (Obukhov & Nowycky, 2004) and here demonstrate that potentiation of TRPC5 macroscopic currents by La3+ is due to transition to Phase 2 properties. Interestingly, Semtner et al. (2007) recently demonstrated a La3+-like potentiation of TRPC5 currents by acidification. This potentiation was mediated through E543 and E595, the same extracellular residues responsible for La3+-increased activity. Thus, acidification may promote the transition of TRPC5 to a voltage-independent state in vivo.
Clearly, a full description of TRPC5 ‘activation’ will require not only identification of the gating energy for opening-closing, but also information about the different degrees of channel availability for gating and about changes in channel gating properties themselves.
Acknowledgments
AHA (0335076N) and NIH (HL083381) grants to AOG and NIH (NS040167) and MDA (3689) grants to MCN.
Grant information:
Contract grant sponsor: American Heart Association. Contract grant number: 0335076N. (AOG)
Contract grant sponsor: NIH. Contract grant number: HL083381. (AOG).
Contract grant sponsor: NIH. Contract grant number: NS040167. (MCN).
Contract grant sponsor: Muscular Dystrophy Association. Contract grant number: 3689. (MCN).
REFERENCES
- Ambudkar IS. Ca2+ signaling microdomains: platforms for the assembly and regulation of TRPC channels. Trends Pharmacol Sci. 2006;27:25–32. doi: 10.1016/j.tips.2005.11.008. [DOI] [PubMed] [Google Scholar]
- Bezzerides VJ, Ramsey IS, Kotecha S, Greka A, Clapham DE. Rapid vesicular translocation and insertion of TRP channels. Nat Cell Biol. 2004;6:709–720. doi: 10.1038/ncb1150. [DOI] [PubMed] [Google Scholar]
- Clapham DE. TRP channels as cellular sensors. Nature. 2003;426:517–24. doi: 10.1038/nature02196. [DOI] [PubMed] [Google Scholar]
- Hofmann T, Obukhov AG, Schaefer M, Harteneck C, Gudermann T, Schultz G. Direct activation of human TRPC6 and TRPC3 channels by diacylglycerol. Nature. 1999;397:259–263. doi: 10.1038/16711. [DOI] [PubMed] [Google Scholar]
- Jung S, Muhle A, Schaefer M, Strotmann R, Schultz G, Plant TD. Lanthanides potentiate TRPC5 currents by an action at extracellular sites close to the pore mouth. J Biol Chem. 2003;278:3562–3571. doi: 10.1074/jbc.M211484200. [DOI] [PubMed] [Google Scholar]
- Nilius B, Mahleu F, Karashima Y, Voets T. Regulation of TRP channels: a voltage-lipid connection. Biochem Soc Trans. 2007;35:105–108. doi: 10.1042/BST0350105. [DOI] [PubMed] [Google Scholar]
- Nilius B, Talavera K, Owsianik G, Prenen J, Droogmans G, Voets T. Gating of TRP channels: a voltage connection? J Physiol. 2005;547:33–44. doi: 10.1113/jphysiol.2005.088377. [DOI] [PMC free article] [PubMed] [Google Scholar]
- Obukhov AG, Nowycky MC. TRPC4 can be activated by G-protein coupled receptors and provides sufficient Ca2+ to trigger exocytosis in neuroendocrine cells. J Biol Chem. 2002;277:16172–16178. doi: 10.1074/jbc.M111664200. [DOI] [PubMed] [Google Scholar]
- Obukhov AG, Nowycky MC. TRPC5 activation kinetics are modulated by the scaffolding protein ezrin/radixin/moesin-binding phosphoprotein-50 (EBP50) J Cell Physiol. 2004;201:227–235. doi: 10.1002/jcp.20057. [DOI] [PubMed] [Google Scholar]
- Obukhov AG, Nowycky MC. A cytosolic residue mediates Mg2+ block and regulates inward current amplitude of a transient receptor potential channel. J Neurosci. 2005;25:1234–1239. doi: 10.1523/JNEUROSCI.4451-04.2005. [DOI] [PMC free article] [PubMed] [Google Scholar]
- Plant TD, Schaefer M. TRPC4 and TRPC5: receptor-operated Ca2+-permeable nonselective cation channels. Cell Calcium. 2003;33:441–450. doi: 10.1016/s0143-4160(03)00055-1. [DOI] [PubMed] [Google Scholar]
- Putney JW. Physiological mechanisms of TRPC activation. Pflugers Arch. 2005;451:29–34. doi: 10.1007/s00424-005-1416-4. [DOI] [PubMed] [Google Scholar]
- Ramsey IS, Delling M, Clapham DE. An introduction to trp channels. Annu Rev Physiol. 2006;68:619–647. doi: 10.1146/annurev.physiol.68.040204.100431. [DOI] [PubMed] [Google Scholar]
- Schaefer M, Plant TD, Obukhov AG, Hofmann T, Gudermann T, Schultz G. Receptor-mediated regulation of the nonselective cation channels TRPC4 and TRPC5. J Biol Chem. 2000;275:17517–1726. doi: 10.1074/jbc.275.23.17517. [DOI] [PubMed] [Google Scholar]
- Semtner M, Schaefer M, Pinkenburg O, Plant TD. Potentiation of TRPC5 by protons. J Biol Chem. 2007 doi: 10.1074/jbc.M702577200. doi: 10.1074-jbc.M702577200. [DOI] [PubMed] [Google Scholar]
- Strübing C, Krapivinsky G, Krapivinsky L, Clapham DE. TRPC1 and TRPC5 form a novel cation channel in mammalian brain. Neuron. 2001;29:645–655. doi: 10.1016/s0896-6273(01)00240-9. [DOI] [PubMed] [Google Scholar]
- Vazquez G, Wedel BJ, Aziz O, Trebak M, Putney JW., Jr The mammalian TRPC cation channels. Biochim Biophys Acta. 2004;1742:21–36. doi: 10.1016/j.bbamcr.2004.08.015. [DOI] [PubMed] [Google Scholar]
- Venkatachalam K, Zheng F, Gill DL. Regulation of canonical transient receptor potential (TRPC) channel function by diacylglycerol and protein kinase C. J Biol Chem. 2003;278:29031–29040. doi: 10.1074/jbc.M302751200. [DOI] [PubMed] [Google Scholar]
- Voets T, Droogmans G, Wissenbach U, Janssens A, Flockerzi V, Nilius B. The principle of temperature-dependent gating in cold- and heat-sensitive TRP channels. Nature. 2004;430:748–754. doi: 10.1038/nature02732. [DOI] [PubMed] [Google Scholar]
- Voets T, Owsianik G, Janssens A, Talavera K, Nilius B. TRPM8 voltage sensor mutants reveal a mechanism for integrating thermal and chemical stimuli. Nature Chem Biol. 2007;3:174–182. doi: 10.1038/nchembio862. [DOI] [PubMed] [Google Scholar]
- Yamada H, Wakamori M, Hara Y, Takahashi Y, Konishi K, Imoto K, Mori Y. Spontaneous single-channel activity of neuronal TRP5 channel recombinantly expressed in HEK293 cells. Neurosci Lett. 2000;285:111–114. doi: 10.1016/s0304-3940(00)01033-8. [DOI] [PubMed] [Google Scholar]
- Yu FH, Yarov-Yarovoy V, Gutman GA, Catterall WA. Overview of molecular relationships in the voltage-gated ion channel superfamily. Pharmacol Rev. 2005;57:387–95. doi: 10.1124/pr.57.4.13. [DOI] [PubMed] [Google Scholar]
- Zhu MH, Chae MR, Kim HJ, Lee YM, Kim MJ, Jin NG, Yang Dk, so I, Kim KW. Desensitization of canonical transient receptor potential channel 5 by protein kinase C. Am J Physiol Cell Physiol. 2005;289:C591–C600. doi: 10.1152/ajpcell.00440.2004. [DOI] [PubMed] [Google Scholar]


