

Abstract
Reliably quantifying therapy-induced leukoencephalopathy is a challenging task due to the similarity between its MR properties and those of normal tissues. Multispectral MR images were analyzed for 15 children treated for acute lymphoblastic leukemia. Three different analysis techniques were compared to examine improvements in the segmentation accuracy of leukoencephalopathy versus manual tracings by two experienced observers. The original technique used a white matter mask based on the segmentation of the first serial examination of each patient and no a priori information. The modified techniques combine spatially normalized a priori maps as input and a gradient magnitude threshold. The second technique used a 2D threshold, while the third algorithm utilized a 3D threshold. MR images were segmented with a Kohonen self-organizing map for all three algorithms. Kappa values were compared for the three techniques to each observer and statistically significant improvements were seen between the original and third algorithms (Observer 1: 0.651, 0.744, P = 0.015; Observer 2: 0.603, 0.699, P = 0.024). More accurate and reliable quantification reduces the amount of variance in MR measures and facilitates clinical trials to determine the clinical significance of leukoencephalopathy in this vulnerable population.
Keywords: volumetric analysis, quantitative MR, image segmentation, leukoencephalopathy
Acute lymphoblastic leukemia (ALL) is the most common childhood cancer: ∼2500 new cases are diagnosed each year in the US. Treatment of pediatric ALL must include central nervous system (CNS)-directed therapy to prevent or treat CNS leukemia and often involves the administration of high-dose methotrexate (HDMTX). Reports have shown a significant association between treatment with HDMTX and development of leukoencephalopathy (1-3). The term leukoencephalopathy is used to designate white matter (WM) damage in the CNS that is identified by hyperintense signal in T2-weighted MR imaging after therapy. The clinical significance of the development of transient leukoencephalopathy is not fully understood and needs to be examined.
While quantitative assessment tools have been developed for other populations, most studies using MRI to examine patients with ALL have thus far reported only qualitative assessments of leukoencephalopathy on a subjective grading scale as mild, moderate, or severe (1-4). This subjective scale precluded comparison of therapy-induced leukoencephalopathy between institutions or trials. A methodology for quantitatively assessing leukoencephalopathy in ALL patients has been recently reported and will be the basis for the current work (5).
The MR imaging characteristics of leukoencephalopathy are similar to other diseases or processes that cause WM hyperintensities, such as multiple sclerosis (MS) and aging. Several modifications to existing techniques have been recently reported for quantitative analyses of such WM hyperintensities. Region growing techniques with a variety of automated and semiautomated stopping criteria have been utilized (6-8). These techniques are limited due to the degree of local intensity contrast necessary between the lesion and the surrounding tissues, being based on a single imaging type, and the requirement of subjective selection of each lesion on every slice of the imaging set, requiring a much higher level of operator expertise. A model-based method has been utilized with multispectral data to identify lesions in MS patients (6). This technique makes assumptions about the model and variance that is possible in the model. Several other groups have recently reported modifications to the k-nearest neighbor technique to improve lesion identification and localization in MS and geriatric populations (9-11). The k-nearest neighbor technique is extremely sensitive to intensity inhomogeneities and relies on either assumptions of intensity distributions or subjective samples to define the distributions. The work by Wei et al. (9) found that the addition of template-driven segmentation to the expectation-maximization segmentation and partial volume effect correction algorithms significantly improved the accuracy and reliability of WM signal abnormality measures.
Encouraged by the success of Wei et al., the present study examined the possibility of improving the methodology reported previously for quantitatively assessing leukoencephalopathy in ALL patients (5). The method used a semiautomated hybrid neural network segmentation and classification method based on a Kohonen self-organizing map (SOM) with T1, T2, proton density (PD), and fluid attenuated inversion recovery (FLAIR)-weighted images limited by a WM mask identified from the first examination of each patient. In the current study, a priori probability maps were added to better define the WM and limit errors caused by the inclusion of normal cerebrospinal fluid (CSF) or gray matter (GM) following changes in ventricular size. A gradient magnitude threshold was then incorporated into the segmentation to limit hyperintense artifacts on FLAIR images from influencing the segmentation. First a 2D gradient magnitude threshold was utilized, followed by further improvements from a 3D gradient magnitude threshold technique. Two experienced observers manually segmented the leukoencephalopathy in the study cases to establish a baseline for comparison. The purpose of this study was to improve quantitative MR imaging measures that identify therapy-induced leukoencephalopathy, or other similar WM hyperintensities, for use in longitudinal imaging studies.
PATIENTS AND METHODS
Patient Population
The method for quantitative assessment of subtle therapy-induced leukoencephalopathy was designed and tested in patients treated for ALL with regimens containing HD-MTX. The 15 patients included in this study were a subset of participants receiving treatment for ALL on an institutional protocol (12). Patients underwent a chemotherapy regimen that included seven courses of HDMTX with targeted systemic exposure to eliminate individual differences caused by variability in clearance (13). Patients underwent a clinical imaging protocol after informed consent had been obtained from the patient, parent, or guardian, as appropriate. MRI examinations were performed according to the protocol after the first, fourth, and seventh course of HDMTX as well as at the end of therapy. The 15 examinations used in this study occurred after the seventh course of HDMTX and were randomly selected from examinations read as having leukoencephalopathy by a neuroradiologist. The 15 children ranged in age from 3.8-18.7 (median 8.1) years at the time of the examination.
MR Imaging
Leukoencephalopathy is best visualized with a T2-weighted sequence, preferably with CSF attenuated. The imaging protocol was designed to simultaneously yield raw images for the segmentation procedures and images necessary for the clinical evaluation of the patients. All MRI examinations were performed without contrast agent on a 1.5 T Vision (Siemens Medical Systems, Iselin, NJ) whole-body imager with a standard circular polarized volume head coil. To minimize variability, a localizer sequence was used to determine the position of the patient in the coil. A set of T1-weighted sagittal images was collected as part of the diagnostic examination. The midline sagittal image was used to define an oblique transverseimaging plane that was used on all subsequent sequences. The tilt of this oblique plane was defined by the most inferior extent of the genu and the splenium of the corpus callosum on the midline sagittal image. All images were 3-mm-thick contiguous slices acquired as two interleaved sets of 19 and 18 slices with a 3-mm gap to avoid cross-talk between slice excitations. T1-weighted images were acquired with a multiecho inversion recovery imaging sequence (repetition time between spin excitations [TR], 8000 ms; echo time [TE], 20 ms; time between inversion and the excitation pulse [TI], 300 ms; one acquisition; seven echoes). PD- and T2-weighted images were acquired simultaneously with a dual spin-echo sequence (TR/TE1/TE2 = 3500/17/102 ms; one acquisition). FLAIR images were acquired with a multiecho inversion recovery sequence (TR/TE/TI = 9000/119/2470 ms; one acquisition; seven echoes).
Manual Validation
Manually segmented leukoencephalopathy maps were used to assess the performance of the three segmentation algorithms. Two experienced observers manually segmented all leukoencephalopathy visualized on the T2 and FLAIR-weighted images of the 15 patients at a single pre-determined slice position blinded to patient identity. The edges of the leukoencephalopathy were identified using the pencil tool in Adobe PhotoShop (San Jose, CA). The eraser and paint bucket tools were then used to fill all pixels to be segmented as leukoencephalopathy in the manually segmented images. After a delay of several weeks, both observers repeated all 15 segmentations to determine the intraobserver agreement. Intersubject agreement was also examined before comparing the three segmentation algorithms. All validation was completed on a pixel-by-pixel basis between the two segmentation algorithms under comparison.
Preprocessing
Registration methods developed by Ostuni et al. (14) were used to register all MR imaging sets within an individual examination. In addition to registering different imaging sets obtained during the same examination, images obtained during subsequent examinations of each patient were also registered to the baseline images, which facilitated the longitudinal assessment of tissue changes regardless of slight variations in head tilt between examinations. After registration, a technique to correct for RF inhomogeneities in the imaging sets was performed using a modified renormalization transformation and a local contrast ratio measure to optimize the filtering band (15). This approach has shown the ability to eliminate most of the bias field from the MR images while limiting the amount of distortion to the anatomical information in the clinical images.
Improvements to the Leukoencephalopathy Segmentation Algorithm
The original work to segment leukoencephalopathy was described previously (5), but additional use of this algorithm has revealed limitations. In review, the registered and RF corrected T1, T2, PD, and FLAIR-weighted images served as inputs to the semiautomated hybrid neural network segmentation and classification method (5). This segmentation procedure used a Kohonen SOM (16,17). The segmentation was limited to the WM mask identified from the first examination of each patient. Using the segmented WM was considered to be acceptable because the first examinations were assumed to be normal and served as the reference examination for all registration.
One of the problems with the original technique resulted from the WM mask being dependent on the segmentation of the first serial MR examination. To address this limitation, the International Consortium for Brain Mapping (ICBM) atlas (18) and corresponding a priori maps were spatially normalized to each patient and resliced using Statistical Parametric Mapping 99 (SPM99) software (Wellcome Department of Cognitive Neurology, Institute of Neurology, Queen Square London, UK) (19). For both modified algorithms, WM masks were automatically generated by thresholding for pixels with >30% probability WM, <30% probability GM, and <10% probability CSF. This effectively eliminates any pixels outside the most probable regions of WM for consideration as leukoencephalopathy. A combined imaging set consisting of T1, T2, PD, and FLAIR MR images and WM, GM, and CSF a priori maps (Fig. 1) were then analyzed with an adaptation of the original segmentation algorithm (5).
FIG. 1.
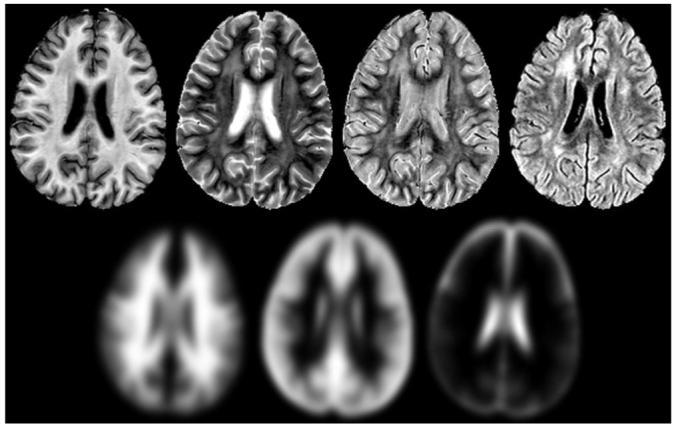
Example of the input images used in all three segmentation algorithms. The MR images are shown on the top row and from left to right correspond to the T1, T2, PD, and FLAIR-weighted images acquired for all subjects on the institutional protocol. The a priori maps spatially normalized to the patient’s MR examination are shown on the bottom row. From left to right, the white matter, gray matter, and cerebrospinal fluid a priori maps are shown that were used to generate the white matter mask and served as additional input to the second and third leukoencephalopathy segmentation algorithms.
A second limitation of the original work was a high number of false-positives that corresponded to imaging artifacts inherent in the imaging protocol. A gradient vector magnitude calculated for a given neighborhood on the FLAIR images (Eq. [1]) was used to formulate a:
| [1] |
threshold to exclude pixels most likely to be image artifacts. For the second algorithm examined, the neighborhood was calculated from a 2D 5 × 5 neighborhood surrounding each pixel in the image stack. The threshold value was automatically determined once for each examination from the descriptive statistics of the gradient magnitude for the index slice, shown in other populations to be capable of representing the full cerebral volume (20). The threshold value was computed by adding the average gradient magnitude value to the standard deviation and excluding pixels above this sum. The third segmentation algorithm attempted to address problems with imaging artifacts that were partial volumed across the slices. The gradient magnitude in this algorithm was computed for a 3D kernel that only sub sampled a 7 × 7 neighborhood in three image slices. The kernel (Fig. 2) was designed to balance the input from the inferior and superior slices with the in-plane contribution without introducing weighting factors for each pixel in the neighborhood.
FIG. 2.
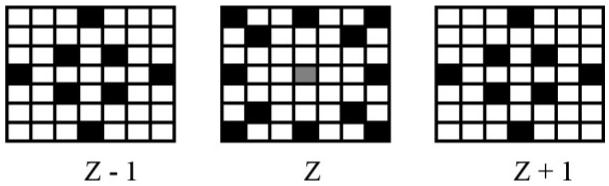
Schematic of the 3D kernel used in the third leukoencephalopathy algorithm. The pixel shown in gray is the reference pixel for which the gradient magnitude value is determined, while the pixels represented as black identify the neighbors used in the calculation of the gradient magnitude value. The center group of pixels represents the in-plane component of the kernel, while the left and right represent pixels in the MR slices superior and inferior to the reference pixel, respectively.
The three algorithms described comprised only the initial portion of the quantitative analysis procedure for the images. After this initial segmentation was completed, the segmented maps were then manually classified to identify the regions with WM hyperintensities corresponding to leukoencephalopathy. A second pass through the segmentation algorithm with only the T1, T2, PD, and FLAIR-weighted images was not limited to the WM mask, so all tissues in each slice were segmented. The leukoencephalopathy mask that was produced from the first segmentation pass was used to exclude abnormal pixels from the analysis of the normal-appearing regions of the brain. After classification of the normal structures, the leukoencephalopathy mask was overlaid for the final pseudocolor output representing both normal and abnormal tissues.
Statistical Analyses
The similarity comparisons between the various segmented images were assessed using Kappa statistics. Since the tissue of interest was normal-appearing WM and leukoencephalopathy, an independent segmentation was used to mask these structures in the comparison process. While the accuracy of this mask was not evaluated, the same mask was used in all comparisons to ensure that the exact same pixels were evaluated for each. To assess the intraobserver agreement of the manual segmentation from each observer, Kappa scores were calculated between the first and second segmentations for each of the 15 subjects and averaged for each of the two observers. The interobserver agreement was examined by comparing the first segmentation performed by each observer. These results were also reported as the average of the 15 individual Kappa scores. Comparisons between the three semiautomated segmentation procedures were completed by comparing each output to the first manual segmentation of each observer and averaging the 15 individual Kappa scores for each technique. Standard deviations were also reported for each average Kappa value. Student’s paired t-tests for means were performed between the Kappa scores of the second and third algorithms and the original technique. Two-tailed probability tests of significance (alpha = 0.05) were used.
RESULTS
Manual Validation
The manual validation was examined before comparing the various semiautomated segmentation algorithms. Both observers were able to complete the manual segmentations with good intraobserver agreement. The Kappa score was 0.806 in Observer 1 and 0.828 in Observer 2. The two observers also had good interobserver agreement as well, with a Kappa score of 0.758. With these acceptable results, the comparisons between the semiautomated techniques could be compared to the manual segmentations of both observers, then use this measure of agreement to compare between the semiautomated techniques.
Segmentation of Leukoencephalopathy
The results of the three semiautomated segmentation algorithms were compared visually and statistically. As expected, the addition of each new procedure improved the segmentation results. The segmented maps for the three segmentation algorithms (Fig. 3) show the improvement from the original technique to the final technique with the spatially normalized a priori maps and the 3D gradient magnitude threshold. The two primary problems with the first technique result from imaging artifacts and the WM mask. These problems produce false-positives at the edge of the ventricles and along the GM/WM interface and can allow false-negatives in the center of the WM. The second technique shows improvements in these areas, but errors remain in partial volumed regions such as the top of the ventricles. The final segmentation shows a reasonable estimation of the leukoencephalopathy with the fewest errors. The average Kappa scores (Table 1) and their SDs also support these conclusions. The paired t-tests (Table 1) demonstrate that the improvements in the second technique reduce the variance in the Kappa scores, but are not statistically different form the original technique. The third technique does produce statistically significant improvements over the original technique. Additionally, scatterplots (Fig. 4) show the absolute single slice volume of the leukoencephalopathy for each subject and the original and third techniques to demonstrate the significant improvements with the modifications to the algorithm.
FIG. 3.
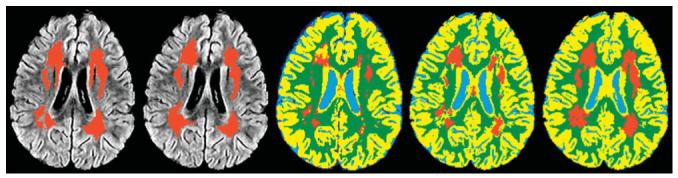
Example output from the three segmentation algorithms. The first two images on the left are the manual segmentations overlaid on FLAIR image corresponding to the MR slice that was segmented. The first image on the left is from Observer 1 and the second is from Observer 2. The remaining three images correspond to the three segmentation algorithms. The center image is the output from the original leukoencephalopathy segmentation algorithm without a priori information or a gradient magnitude threshold. The second from the right is the second leukoencephalopathy segmentation output showing the improvements utilizing the a priori maps and a 2D gradient magnitude threshold. On the right, the improvements provided by the 3D gradient magnitude threshold are shown in the output from the third segmentation algorithm.
Table 1.
Average Kappa scores with standard deviations between the semi-automated segmentation algorithms and the manual segmentations
| Observer 1 | Observer 2 | |
|---|---|---|
| Original leukoencephalopathy segmentation | 0.651 ± 0.154 | 0.602 ± 0.186 |
| Second leukoencephalopathy segmentation with 2-D gradient threshold and a priori maps | 0.653 ± 0.137a | 0.615 ± 0.136a |
| Third leukoencephalopathy segmentation with 3-D gradient threshold and a priori maps | 0.744±0.114b | 0.699±0.095c |
Paired t-tests were computed between the original algorithm and the two modified techniques.
Not significant;
p = 0.015;
p = 0.024.
FIG. 4.

Scatterplots of the volume of leukoencephalopathy from the manual and automated segmentation algorithms. The horizontal axes represent the volume of the manual segmentation for the single slice used in each of the 15 subjects reported in cubic centimeters. The graph on the top shows volumes from the manual segmentation of Observer 1 while the results from Observer 2 are shown on the bottom. Both vertical axes represent the corresponding single-slice volume from the original and third segmentation algorithms in cubic centimeters. The original technique volumes are shown by empty squares and the third technique is represented by filled squares. The dotted line represents the line of equality between the manual and automated techniques.
DISCUSSION
Reliably quantifying therapy-induced leukoencephalopathy in children treated for cancer is a challenging task due to its range of intensity change, delineation from the normal-appearing WM, and similar properties to imaging artifacts and normal tissues outside of WM. Leukoencephalopathy can vary from subtle diffuse changes with nearly identical MR properties and locations with unmyelinated WM to focal lesions with signal intensities near that of CSF. Unsaturated CSF and flow artifacts found on FLAIR and T2-weighted imaging can have similar properties to leukoencephalopathy. This study sought to improve a quantitative methodology for segmenting therapy-induced leukoencephalopathy (5) by developing new technologies to address the observed limitations of this previous technique. Assessment of the methodologies was facilitated by comparisons of each technique to manual segmentations performed by two experienced observers. While the new WM mask and 2D gradient magnitude threshold improved the results, the best results were seen when the gradient magnitude threshold was modified to 3D.
With the initial technique, the idea of using two passes to segment the leukoencephalopathy and normal tissues was established because of the overlap between leukoencephalopathy and normal tissues outside of WM (5). Any segmentation errors for leukoencephalopathy occur in this initial pass, and that process was the focus of this study. The first systematic source of error from the original leukoencephalopathy segmentation technique was the WM mask. Originally, the first examination was assumed to be normal, but this was not always the case for all examinations on the protocol. Also, having the WM mask dependent on the segmentation from the first examination does not allow for normal developmental or treatment related changes to be considered. The age at diagnosis in the total population was as low as 1.8 years on this protocol, a time when major structural changes are still occurring. One significant treatment-related effect is the change in the size of the ventricles, producing significant effects in the locations of the entire GM/WM interface.
The next error from the original leukoencephalopathy segmentation technique was the problem with imaging artifacts. While the FLAIR images provide better visualization of abnormal tissue, flow artifacts and unsaturated CSF at the edge of the ventricles produce hyperintensities that often result in false-positive leukoencephalopathy pixels. The goal of the gradient magnitude threshold was to identify hyperintense regions in a narrow band, similar to these hyperintense regions along the edge of the ventricles. The threshold was derived from a region with a large CSF component, theoretically providing a good measure of the amount of these FLAIR artifacts, and the observed results support the idea that an appropriate threshold was reached with this technique. The remaining problem of the second technique lies with partial volumed regions such as at the top of the ventricles. This type of error is not visualized as well with the example in Fig. 3, but the problem seems to occur to some extent in all slices, as the edges of the GM/WM interface also appear improved with the final segmentation algorithm.
As with any study, there are several potential limitations of the present study. While there were three separate algorithms developed, the search to reach these three algorithms was not inclusive. Therefore, the best results achieved with the 3D gradient magnitude threshold with the spatially normalized a priori maps may not be the optimal solution. A possible error source using the new algorithms is the selection of an adult ICBM atlas. While studies have reported errors in using adult atlases in pediatric cases (21), the threshold values that were empirically determined to create the WM mask may correct some of the issues with this problem. Another potential concern with this newly proposed algorithm lies with the algorithm to perform the spatial normalization. Misalignment of the a priori maps could translate into misclassifications. The spatial normalization utilized in this study was performed with SPM99 software, and our preliminary studies indicate that the Statistical Parametric Mapping 2 (SPM2) software update to SPM99 may improve the results. As with any image processing technique utilizing a registration-based technique, this error must be minimized to ensure quality data and quantitative results.
In conclusion, this study describes a novel approach for improving the quantitative assessment of therapy-induced leukoencephalopathy. This semiautomated assessment of MR images reduces the errors associated with WM masks from a previous examination and reduces the misclassifications associated with some imaging artifacts. The clinical significance of therapy-induced leukoencephalopathy for long-term survivors is unknown. However, when combined with individualized pharmacokinetic studies and longitudinal neurocognitive testing, this MR method could substantially advance the understanding of leukoencephalopathy and its impact on the quality of life of survivors of ALL. The current results represent data from a preliminary study to address the specific limitations identified in the previous segmentation algorithm. The improved technique is currently being applied in an ongoing clinical trial to assess leukoencephalopathy in an ALL population. The results of this study will be incorporated into the design of future protocols. Our ultimate goal is to use this method to quantify early therapy-induced neurotoxicity, which is potentially reversible through adjustment of therapy or through individually tailored neurobehavioral and pharmacological interventions.
ACKNOWLEDGMENTS
The authors thank Rekha Karuppiah for processing and analysis of the MR examinations and Vickey Simmons for scheduling the examinations.
Grant sponsors: Cancer Center Support (CORE); Grant number: P30CA21765; Grant sponsor: National Cancer Institute; Grant number: R01CA90246; Grant sponsors: American Cancer Society F.M. Kirby Clinical Research Professorship, American Lebanese Syrian Associated Charities (ALSAC).
REFERENCES
- 1.Wilson DA, Nitschke R, Bowman ME, Chaffin MJ, Sexauer CL, Prince JR. Transient white matter changes on MR images in children undergoing chemotherapy for acute lymphocytic leukemia: correlation with neuropsychologic deficiencies. Radiology. 1991;180:205–209. doi: 10.1148/radiology.180.1.2052695. [DOI] [PubMed] [Google Scholar]
- 2.Asato R, Akiyama Y, Ito M, Kubota M, Okumura R, Miki Y, Konishi J, Mikawa H. Nuclear magnetic resonance abnormalities of the cerebral white matter in children with acute lymphoblastic leukemia and malignant lymphoma during and after central nervous system prophylactic treatment with intrathecal methotrexate. Cancer. 1992;70:1997–2004. doi: 10.1002/1097-0142(19921001)70:7<1997::aid-cncr2820700732>3.0.co;2-g. [DOI] [PubMed] [Google Scholar]
- 3.Mahoney DH, Jr, Shuster JJ, Nitschke R, Lauer SJ, Steuber CP, Winick NJ, Camitta B. Acute neurotoxicity in children with B-precursor acute lymphoid leukemia: an association with intermediate-dose intravenous methotrexate and intrathecal triple therapy — a pediatric oncology group study. J Clin Oncol. 1998;16:1712–1722. doi: 10.1200/JCO.1998.16.5.1712. [DOI] [PubMed] [Google Scholar]
- 4.Paakko E, Harila-Saari A, Vanionpaa L, Himanen S, Pyhtinen J, Lanning M. White matter changes on MRI during treatment in children with acute lymphoblastic leukemia: correlation with neuropsychological findings. Med Pediatr Oncol. 2000;35:456–461. doi: 10.1002/1096-911x(20001101)35:5<456::aid-mpo3>3.0.co;2-1. [DOI] [PubMed] [Google Scholar]
- 5.Reddick WE, Glass JO, Langston JW, Helton KJ. Quantitative MRI assessment of leukoencephalopathy. Magn Reson Med. 2002;47:912–920. doi: 10.1002/mrm.10124. [DOI] [PMC free article] [PubMed] [Google Scholar]
- 6.Ashton EA, Takahashi C, Berg MJ, Goodman A, Totterman S, Ekholm S. Accuracy and reproducibility of manual and semiautomated quantificaton of MS lesions by MRI. J Magn Reson Imag. 2003;17:300–308. doi: 10.1002/jmri.10258. [DOI] [PubMed] [Google Scholar]
- 7.Fan YH, Lam WWM, Mok VCT, Huang RX, Wong KS. Variability and validity of a simple visual rating scale in grading white matter changes on magnetic resonance imaging. J Neuroimag. 2003;13:255–258. [PubMed] [Google Scholar]
- 8.Parodi RC, Sardanelli F, Renzetti P, Rosso E, Losacco C, Ferrari A, Levrero F, Pilot A, Inglese M, Mancardi GL. Growing region segmentation software (GRES) for quantitative magnetic resonance imaging of multiple sclerosis: intra- and inter-observer agreement variability: a comparison with manual contouring method. Eur Radiol. 2002;12:866–871. doi: 10.1007/s003300100978. [DOI] [PubMed] [Google Scholar]
- 9.Wei X, Warfield S, Zou KH, Wu Y, Li X, Guimond A, Mugler IJP, Benson RR, Wolfson L, Weiner HL, Guttman CRG. Quantitative analysis of MRI signal abnormalitites of brain white matter with high reproducibility and accuracy. J Magn Reson Imag. 2002;15:203–209. doi: 10.1002/jmri.10053. [DOI] [PubMed] [Google Scholar]
- 10.Payne ME, Fetzer DL, MacFall JR, Provenzale JM, Byrun CE, Krishnan KR. Development of a semi-automated method for quantification of MRI gray and white matter lesions in geriatric subjects. Psychiat Res Neuroim. 2002;115:63–77. doi: 10.1016/s0925-4927(02)00009-4. [DOI] [PubMed] [Google Scholar]
- 11.Swartz RH, Black SE, Feinstein A, Rockel C, Sela G, Gao FQ, Caldwell CB, Bronskill MJ. Utility of simultaneous brain, CSF and hyperintensity quantification in dementia. Psychiat Res Neuroim. 2002;116:83–93. doi: 10.1016/s0925-4927(02)00068-9. [DOI] [PubMed] [Google Scholar]
- 12.Kishi S, Griener JC, Cheng C, Das S, Cook EH, Pei D, Hudson MM, Rubnitz JE, Sandlund JT, Pui C-H, Relling MV. Homocysteine, pharmacogenetics, and neurotoxicity in children with leukemia. J Clin Oncol. 2003;21:3084–3091. doi: 10.1200/JCO.2003.07.056. [DOI] [PubMed] [Google Scholar]
- 13.Evans WE, Relling MV, Rodman JH, Crom WR, Boyett JM, Pui C-H. Conventional compared with individualized chemotherapy for childhood acute lymphoblastic leukemia. N Engl J Med. 1998;338:499–505. doi: 10.1056/NEJM199802193380803. [DOI] [PubMed] [Google Scholar]
- 14.Ostuni JL, Levin RL, Frank JA, DeCarli C. Correspondence of closest gradient voxels — a robust registration algorithm. J Magn Reson Imag. 1997;7:410–415. doi: 10.1002/jmri.1880070227. [DOI] [PubMed] [Google Scholar]
- 15.Ji Q, Reddick WE, Glass JO, Krynetskiy E. Quantitative study of renormalization transformation method to correct the inhomogeneity in MR images. SPIE Medical Imaging Symposium. Conference on Image Processing. 2002;4684-2:1002–1009. [Google Scholar]
- 16.Pal NR, Bezdek JC, Tsao ECK. Generalized clustering networks and Kohonen's self-organizing scheme. IEEE Trans Neural Networks. 1993;4:549–557. doi: 10.1109/72.238310. [DOI] [PubMed] [Google Scholar]
- 17.Kohonen T. Self-organization and associative memory. Springer; New York: 1989. [Google Scholar]
- 18.Mazziotta JC, Toga AW, Evans A, Fox P, Lancaster J. A probabilistic atlas of the human brain: theory and rationale for its development: the International Consortium for Brain Mapping (ICBM) NeuroImage. 1995;2:89–101. doi: 10.1006/nimg.1995.1012. [DOI] [PubMed] [Google Scholar]
- 19.Ashburner J, Friston KJ. Nonlinear spatial normalization using basis functions. Hum Brain Mapp. 1999;7:254–266. doi: 10.1002/(SICI)1097-0193(1999)7:4<254::AID-HBM4>3.0.CO;2-G. [DOI] [PMC free article] [PubMed] [Google Scholar]
- 20.Glass JO, Ji Q, Glas LS, Reddick WE. Prediction of total cerebral tissue volumes in normal appearing brain from subsampled segmentation volumes. Magn Reson Imag. 2003;21:977–982. doi: 10.1016/j.mri.2003.05.010. [DOI] [PubMed] [Google Scholar]
- 21.Wilke M, Schmithorst VJ, Holland SK. Normative pediatric brain data for spatial normalization and segmentation differs from standard adult data. Magn Reson Med. 2003;50:749–757. doi: 10.1002/mrm.10606. [DOI] [PubMed] [Google Scholar]