

Abstract
Equilibrium unfolding behaviors of cytochrome c and lysozyme induced by the presence of urea (0–10 M) as well as changes in temperature (295–363 K) or pH (1.8–7) are examined via small-angle x-ray scattering and spectroscopic techniques, including circular dichroism and optical absorption. Denaturant and temperature effects are incorporated into the free energy expression for a general multigroup unfolding process. Results indicate that there are at least four unfolding groups in the temperature-, urea-, or pH-induced unfolding of cytochrome c: two of these are related to the prosthetic heme group, and the other two correspond, respectively, to the unfolding of α-helices and global changes in protein morphology that are largely unaccounted for by the first two groups. In contrast, the unfolding of lysozyme approximately follows a simple one-group process. A modified mean-field Ising model is adopted for a coherent description of the unfolding behaviors observed. Thermodynamic parameters extracted from simple denaturing processes, on the basis of the Ising model, can closely predict unfolding behaviors of the proteins in compounded denaturing environments.
INTRODUCTION
Structures and structural evolutions of proteins during folding-unfolding carry critical information in understanding correlations between structures and functions of the proteins. Such correlations are helpful in searching for possible remedies for diseases caused by protein misfolding such as Alzheimer's and Creutzfeldt-Jacob diseases (1,2). Controlling environmental parameters, such as temperature and/or denaturants, can selectively stabilize a protein at a specific partially folded conformation, which allows a convenient and close observation of the partially folded or misfolded protein structures of interest. In the study of protein solution structure, optical spectroscopies including circular dichroism (CD), light absorption, fluorescence, resonance Raman scattering, and NMR have often been used to reveal specific aspects of local structural changes of proteins in various denaturing environments (3–7). Compared to the optical spectroscopies mentioned, small-angle x-ray scattering (SAXS) can be a more direct tool in extracting global structural information of proteins in unfolding (7,8). Recent studies have shown the apparent advantage of combining global and local structural tools in addressing correlations between the local-local structures and local-global structures (9–11); with this information, a better description of the protein unfolding process as well as a better understanding of intermediate states or partially folded structures can be expected.
Unfolding behaviors of the two-model proteins, cytochrome c and lysozyme, induced by the presence of denaturants or changes in pH or temperature have been studied rigorously (3–9). Nevertheless, we demonstrate here that for cytochrome c, a metalloprotein, a combination of structural tools of SAXS and spectroscopy measurements of CD and ultraviolet-visible absorption can still provide new insights based on the noncollective local and global structural changes observed in our designated unfolding processes of single and compounded denaturing environments. In the interpretation of the noncollective local and global structural changes, the conventional two-state model (3,4,7), with the folded (native) and unfolded states, is insufficient. Abundant models have been developed to describe general protein folding-unfolding process with partially folded or intermediate protein structures (12).
For instance, singular value decomposition analysis was successful in some cases in finding a minimum number of additional (intermediate) states to facilitate the description of the noncollective local and global unfolding behaviors observed (3,9); foldons and sequential stabilization were proposed in charactering the unfolding behavior of cytochrome c revealed by NMR with the hydrogen exchange method (6,12,13); the energy landscape of folding was derived from the structural evolution of cytochrome c unfolding observed with fluorescence (14). The effects of local and nonlocal interactions on thermodynamics and kinetics of protein folding were also investigated by Monte Carlo simulation with the classical lattice model; this result indicated that the random coil of a protein can fold with selected sequences to achieve a unique native conformation of a minimum free energy (15,16). The Monte Carlo calculation, however, could not provide a real timescale during the energy landscape of protein folding. Alternatively, thermodynamics and kinetics information of protein folding were extracted from the protein state determined from the binary variables of peptide bonds in the Muñoz-Eaton model (17,18).
Bakk et al. developed a one-dimensional Ising model (19) that could explicitly account for the cooperative effect inside a protein by an exact partition function for a system (protein) consisting of N identical units in the form of a closed ring. The model could provide a topology of protein folding-unfolding and the related calorimetric change of enthalpy; because of a rather complicated form of the partition function, it is, however, not straightforward to associate the protein unfolding free energy and denaturant concentration with the unfolding fraction deduced from experiment. On the other hand, the Ising model with a mean-field approximation developed by Lin's group can describe kinetics and thermodynamics of protein folding-unfolding influenced by denaturant effects (20–23) or calorimetric change of enthalpy, as well as the unfolding in atomic force measurements (24,25), via a microscopic point of view. In this study, we find that the mean-field Ising model can provide a simple yet coherent description on the multigroup unfolding behaviors of the model proteins we have observed at not only global but also local scales as experimentally accessed via SAXS and spectroscopic measurements.
In the mean-field Ising model of protein folding-unfolding, the protein molecule is regarded as an ensemble of units reduced from, presumably, peptide bonds or amino acid residues. Units of similar thermodynamic properties are further classified into groups that are related to, for instance, α-helices or β-sheets. Units of the same group are assumed to unfold collectively, whereas units of different groups may undergo either sequential or coupled unfolding. The introduction of unfolding groups facilitates the description of noncollective local structural changes experimentally observed via a multigroup unfolding. Furthermore, we incorporate denaturant and temperature effects into the free energy expression of the protein upon dissolution in a specific environment at thermal equilibrium and show that thermodynamic parameters extracted from simple denaturing processes can be used to predict unfolding behaviors of the proteins in compounded denaturing environments. Extracted values of thermodynamic parameters for the two-model proteins of cytochrome c and lysozyme are compared, and differences in the unfolding behaviors are interpreted in molecular terms.
MATERIALS AND METHODS
Materials and sample preparation
Horse heart cytochrome c in an oxidized form (molecular mass = 12,384 Da) and hen egg white lysozyme (molecular mass = 14,300 Da) were purchased from Sigma Chemical (St. Louis, MO) and used without further purification. Sample solutions prepared before each measurement of SAXS, CD, or optical absorption are detailed below; pH values of the sample solutions were examined before measurements. For temperature-dependent measurements within 295–363 K (pH = 7 and 2.9, respectively, for cytochrome c and lysozyme sample solutions), sample temperature was controlled with an accuracy of 1 K; for measurements with urea- or pH-dependent unfolding, sample solutions were kept at ambient temperature (295–298 K).
SAXS measurement and data analysis
Aqueous solutions with urea (0–8 M) and lysozyme, 7–21 g L−1 in concentration, were prepared with 0.1 M NaCl and 0.1 M sodium citrate buffer at pH 2.9. Potassium phosphate (7 mM) buffer solutions, containing 7–21 mM KCl (to adjust the buffer solutions for a constant ionic strength) and 21 g L−1 cytochrome c, were prepared at urea concentrations ranging from 0 to 10 M at pH 7. Similar solutions of 10 g L−1 cytochrome c and lysozyme were respectively prepared in acidic environments within the pH range of 1.8–7. SAXS measurements were performed using the small and wide angle x-ray scattering instrument at the beamline 17B3 of the National Synchrotron Radiation Research Center (26). A sample cell with an x-ray path length of 2 mm was used in SAXS data collection with 10 keV x-rays. All SAXS data, corrected for detector noise, background scattering, pixel sensitivity, incoming flux, and sample thickness, were scaled to the absolute intensity (26,27).
Analysis of SAXS data for the global structural information follows that reported previously (22,28). SAXS intensity distribution for monodisperse protein solutions is modeled as  with the scattering vector Q = 4πsinθ/λ defined by scattering angle 2θ and x-ray wavelength λ, the normalized form factor
  and the structure factor S(Q). The simulation package for protein envelope was adopted from the EMBL Biological Small Angle Scattering Group (29). With each amino acid approximated by a dummy residue, the simulation routine searches a best envelope, assembled from the dummy residues, whose pair correlation function p(r) can best fit the corresponding p(r) profile Fourier transformed from the SAXS data.
CD and absorption measurements
Spectra of Soret band and the secondary structure (α-helix mainly) of cytochrome c were observed by optical absorption (Hitachi U-3200; Hitachi, San Jose, CA) and CD (Jasco J715; Jasco, Tokyo, Japan), respectively. Both spectroscopy measurements were performed with the same buffer solutions as described in SAXS measurements, with 20 μM cytochrome c and urea concentrations ranging from 0 to 10 M at pH 1.8–7, in a sample cell with a light path length of 2 mm. The peak of Soret band of the heme group located at 409 nm in native cytochrome c was attributed to the in-plane π−π* transition of porphyrin. Due to the interactions of the protein with the denaturants, the Soret peak of the final unfolded protein showed a blue shift of 4 nm in 10 M urea and 14 nm at pH 1.8 (22,30).
We define the unfolding fraction as fu = (Xobs − XN)/(XU − XN), where Xobs is the experimental value of the absorbance at 400 nm, Rg from SAXS or CD at 226 nm, at certain urea concentration or temperature; XN and XU are the corresponding values observed in the native and unfolded forms, respectively. The absorbance was done at 400 nm for a convenient observation of cytochrome c unfolding, as the absorption (i.e., the unfolding fraction) increases with the increase of denaturant concentrations (urea and acid).
Molecular dynamics simulation
MacroModel V 9.1 software with the all-atom AMBER* force field was used for molecular dynamics (MD) simulation. The effect of solvent (H2O) was simulated with the continuum generalized Born/surface area model (31–33). The initial structure of MD was taken from the optimized geometry of an x-ray Protein Data Bank structure of lysozyme (code 132L). The average structure of the last 600 ps of the 4.2 ns simulated unfolding was used to calculate the value of Rg.
Ising model for protein folding-unfolding
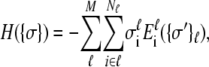
In the Ising model with the mean-field approximation, a protein is regarded as a topological collection (ensemble) of interacting units; each unit may take either folded or unfolded state. Both thermodynamic and near equilibrium kinetic characteristics of protein folding-unfolding are assumed to be determined by the elementary process in folding-unfolding of the structural units, expressed as the fraction of unfolded units fu (hereafter referred to as the unfolded fraction) in the protein. When all units of a protein are in the folded (or unfolded) state, the protein behaves as fully folded (or unfolded); for a partially folded protein, 0 < fu < 1. The evolution of protein morphology, in terms of the unfolded fraction fu, during the unfolding process is then governed by the free energy change of the protein units (20–23).
With each unit taking either the folded or unfolded state (denoted σ = 1 or σ = −1), the state of a protein molecule containing M groups is denoted by  where
where  is the
  group of
  units, the fully folded state is
  whereas the fully unfolded state corresponds to
  The Hamiltonian summed over all units is then
 |
(1) |
where Ei stands for the total energy of the ith unit (20–23). Under mean-field approximation and the assumption that the canonical ensemble lies not far from thermodynamic equilibrium, the expectation state (nonbinary in value) of the  group can be expressed as
 |
(2) |
with thermal energy kBT, the unfolded fraction of the units
 |
(3) |
and the averaged total energy of the unit  Here, only nearest-neighbor interactions J between units in the same group are considered. With a nonzero J value, Eq. 3 exhibits an iteration relation of the unfolded fraction fu. We may further decompose the unfolding free energy change of the protein units into
 |
(4) |
in which the denaturant free energy term is determined by the coefficient 2Δɛm and the denaturant concentration Cm, and the thermal free energy term is determined by the temperature coefficient 2ΔɛT and the temperature difference T − T1/2. We define ΔG0(T) = 2ΔɛT(T − T1/2) as the thermal unfolding free energy of the protein unit, with T1/2 as the characteristic temperature for fu = 1/2 at Cm = 0; the thermal unfolding free energy is thus temperature dependent. Higher T1/2 corresponds to better thermal stability, whereas lower 2ΔɛT and 2Δɛm (negative values) correspond to higher sensitivity with respect to temperature and the denaturant, respectively.
Extending fu in Eq. 3 for protein unfolding that involves more than one denaturant is then straightforward by inclusion in the corresponding denaturant energy terms. Furthermore, the unfolding behavior of a protein containing multigroups can be described as a summation of the individual unfolding profiles of the correlated groups, i.e.,
 |
(5) |
with weighting coefficients (proportional to the number of units in the group) normalized as 
RESULTS AND DISCUSSION
Unfolding of cytochrome c
Shown in Fig. 1 are urea- and temperature-dependent SAXS data for cytochrome c. All the data can be fitted systematically with monodisperse ellipsoids (28,34) on the absolute intensity scale. Slight effects from protein-protein interactions in the low-Q region of the SAXS profiles (Fig. 1 a) were taken into account by use of a structure factor S(Q) of the Percus-Yevick (PY) form for interacting hard spheres (28,34). Relevant parameters such as volume fraction η (= 0.016) is obtained from the protein concentration (20 g L−1), and effective sphere diameter D is derived from equivalent volume approximation (Vdry = 4πab2/3 = πD3/6, where a and b are the semimajor and semiminor axes of the ellipsoid, respectively). Due to interparticle interactions, Guinier approximation is inapplicable but the Rg value may still be deduced from fitted a and b values via Rg = [(a2 + 2b2)/5]1/2 (28,34) (Fig. 1, a or b, inset); the aspect ratio a/b of cytochrome c as a function of urea concentration or temperature can be derived as well. The aspect ratio extracted for the native cytochrome c, with Rg = 13.1 (±0.5) Å, is close to unity, indicating a globular envelope.
FIGURE 1.

SAXS results for cytochrome c solutions at pH 7. (a) Urea-dependent SAXS data are fitted using an ellipsoid form factor and the PY structure factor (dashed curves). The solid curve illustrates the contribution of the pure form factor (without modulation of the PY structure factor) of the native protein. The inset shows the corresponding Rg values of the fitted ellipsoids. (b) Selected temperature-dependent SAXS profiles for the protein solution without urea are fitted (dashed curves) using the ellipsoid model; the inset shows the corresponding Rg values.
The globular morphology is stable up to 5 M urea or 338 K; the envelope elongates gradually to an ellipsoidal shape of aspect ratio ∼6 at 10 M urea or 358 K, leading to a large Rg of 30 (±2) Å. We have also examined the ellipsoidal shape obtained for the partially folded cytochrome c using the dummy residue simulation (8,28,29). Simulated envelopes based on the SAXS data measured, as shown in Fig. 2, can be roughly projected into ellipsoids with sizes and aspect ratios similar to those obtained from our ellipsoid model fitting, in which local structural details below a few angströms are smeared for the analytical shape. The Rg values calculated for the protein envelopes obtained from dummy residue simulation agree well with those from ellipsoid model fitting, as shown in Fig. 2 c.
FIGURE 2.

(a) Urea-dependent envelopes of cytochrome c (solid and light beads represent amino acids and water molecules, respectively) obtained from the SAXS data in Fig. 1 a with the dummy residue simulation, compared with the crystal structure of the protein (helical ribbons). (b) Corresponding pair correlation functions. (c) Comparison of the urea- and temperature-dependent Rg values extracted from the dummy residue simulation and the ellipsoid model fitting of the SAXS data shown in Fig. 1, respectively.
For changes of Rg with urea concentration and temperature, two unfolded fraction profiles fu,SAXS = (Rg − Rg,N)/(Rg,N − Rg,U), with the value of Rg,N obtained at 0 M urea and Rg,U at 10 M urea, are shown in Fig. 3, a and b, respectively. Also given are unfolded fraction profiles fu,CD derived from CD and fu,abs from optical absorbance. These fu profiles represent global to local structural changes during unfolding as viewed from tools of different emphases. The clearly different T1/2 values (at fu = 1/2) of the three temperature-dependent fu profiles in Fig. 3 b indicate a multigroup unfolding process of cytochrome c at thermal equilibrium, with an unfolding sequence of the heme, the α-helix, and the global structure, under the experimental conditions of gradually increased temperature here. We note that thermodynamic unfolding sequence differs from the kinetic unfolding pathway.
FIGURE 3.

(a) Urea- and (b) temperature-induced unfolding of cytochrome c at pH 7. Unfolded fraction profiles determined via absorption, CD, and SAXS measurements are fitted (dashed curves) with four unfolding groups in SAXS (G1–G4), two groups in absorption (G1 and G2), and one group in CD (G3). For demonstrative purposes, unsatisfactory one-group fits (dotted curves) to the profiles determined by absorption are given in a and b. Also shown in b is the fu profile for the case of 6 M urea determined via SAXS, which is well predicted by the Ising model (solid curve).
The thermodynamic unfolding sequence in the multigroup protein is determined by the thermodynamic stability of each group, whereas a kinetic unfolding pathway associates with the activation energy along the unfolding pathway and the initial conditions. Exhibiting one-group unfolding characteristics, the fu,CD profile closely follows that of fu,SAXS. The result suggests that the unfolding of α-helices is closely related to the global morphology change in the unfolding process. In contrast, the fu,abs profile exhibits two-step features (indicated by an arrow), characteristic of a two-group unfolding at lower temperatures, implying that the two relevant groups (most likely related to heme) unfold in a lower temperature range than that of α-helices. In urea-induced unfolding, cytochrome c also displays multigroup unfolding (Fig. 3 a) resembling that in the thermal unfolding.
To consistently extract parametric values 2ΔɛT, 2Δɛm, and T1/2 for each unfolding group based on Eq. 3, we jointly fitted the three urea-dependent fu profiles in Fig. 3 a together with the three temperature-dependent fu profiles in Fig. 3 b. In the joint fitting algorithm of strong constraints on the fitting parameters, two unfolding groups G1 and G2 are used in fitting fu,abs and one group G3 for fu,CD, whereas fu,saxs represents the global structural change with minor contributions from G1 to G3 and dominant contribution from the fourth group G4 (as shown by the γ values in Table 1). Although the G4 group may approximately represent the global structural changes, the unfolding of G4 is not equivalent to the global unfolding composed of all groups. All six unfolded fraction profiles are well described by the four-group model with parametric values given in Table 1. Using the fitted values of 2ΔɛT and T1/2, we further extracted the thermal unfolding free energy ΔG0(T) = 2ΔɛT(T − T1/2) for each group, as given in Table 1. The 2Δɛm and ΔG0 values of the G3 (for the unfolding of the α-helices) and G4 groups (approximately for the global structure) are in general agreement with that reported by different groups (35–38); the values of G1 and G2 involving heme are largely improved under the extended Ising model compared to those reported previously (23).
TABLE 1.
Fitted thermodynamic parameters of cytochrome c in urea- and temperature-induced unfolding
| Group | γ | 2Δɛm (kcal mol−1 M−1) | 2ΔɛT (kcal mol−1 K−1) | T1/2 (K) | ΔG0(293 K) (kcal mol−1) |
|---|---|---|---|---|---|
| G1 | 0.011 | −0.92 ± 0.2 | −0.138 ± 0.015 | 333 ± 11 | 5.9 ± 0.6 |
| G2 | 0.029 | −1.03 ± 0.10 | −0.138 ± 0.015 | 346 ± 5 | 7.3 ± 0.8 |
| G3 | 0.12 | −1.30 ± 0.21 | −0.167 ± 0.026 | 354 ± 1 | 10.2 ± 0.8 |
| G4 | 0.84 | −1.30 ± 0.21 | −0.167 ± 0.026 | 359 ± 5 | 10.9 ± 0.9 |
With the denaturant and temperature effects incorporated in the free energy expression (Eq. 4), we may predict the unfolded fraction of cytochrome c at arbitrary temperature and/or urea concentrations. As demonstrated in Fig. 3 b, the calculated fu profile using thermodynamic parameters given in Table 1 matches well with the independent SAXS observation of thermally induced unfolding of cytochrome c in 6 M urea. According to the Ising model, this urea concentration is expected to result in decreased ΔG and hence a shift of the unfolded fraction profile by ΔT = ΔɛmCm/ΔɛT = 47 K (estimated using parameters of the G4 group) from the denaturant-free counterpart, which is in good agreement with the experimental value of 46 K (Fig. 3 b).
The sequential multigroup unfolding of cytochrome c observed here was revealed in earlier NMR studies based on a hydrogen-exchange method (6,13), where foldons were used to group amino acids in the protein according to the five hydrogen-exchange free energies ΔGHX (293 K) 3.8, 6.3, 7.4, 10.0, and 12.8 kcal/mol observed, respectively. We find that the four unfolding free energies ΔG0 (293 K) (5.9, 7.3, 10.2, and 10.9 kcal/mol) extracted here (Table 1) for cytochrome c based on the Ising model are comparable to the ΔGHX free energies of the foldons. Specifically, the ΔG0 values of our G1 and G2 groups are close to the ΔGHX assigned to the red foldon (71–85 Ω-loop) and the yellow foldon (37–39, 58–61 short antiparallel β-strands), respectively, whereas ΔG0 of G3 and G4 groups are near the ΔGHX of the green foldon (60's α-helix and 19–36 Ω-loop). The small differences between ΔG0 and ΔGHX of the corresponding unfolding groups and foldons can be attributed to the instrument limitation that CD and absorption cannot be sensitive to all groups of cytochrome c, and/or the model limitations of the Ising model due to the mean-field approximation used. The intrinsic difference between ΔGHX and ΔG0 also matters. It would be worthwhile to examine more closely the similarities and differences between the unfolding groups and the foldons in the two approaches.
Effects of pH
In pH-induced unfolding of cytochrome c, SAXS profiles reveal pronounced charge interactions (28,34) between partially folded protein molecules in the pH range of 3.3–2.0. In fitting the SAXS profiles with nontrivial interparticle charge interactions for the a, b, and Rg values of the ellipsoidal form factor, we included the commonly used S(Q) in macroion solutions in the data fitting (34). Based on the Rg values obtained from the SAXS analysis and the corresponding CD and absorption results for cytochrome c, three pH-dependent unfolded fraction profiles (fu,SAXS, fu,CD, and fu,abs, Fig. 4 a) are obtained. Exhibiting step-like transitions, these profiles indicate a multigroup unfolding of cytochrome c in the acidic environment, similar to that observed in the urea- or temperature-induced unfolding. In the acid-induced unfolding, the two heme-related groups G1 and G2 are identified from fu,abs, whereas G3 (associated with α-helices) is identified by fu,CD.
FIGURE 4.

(a) pH- and (b) temperature-dependent unfolded fraction profiles deduced from SAXS, CD, and absorption for cytochrome c. Arrows in a denote completion of unfolding for groups G0–G4. Dashed and solid curves are fits based on the Ising model. Compared to the pH 7 case (fitted with the short-dashed curve) in b are the temperature-dependent fu measured for the protein at pH 3 (fitted with the long-dashed curve) and 6 M urea (fitted with the dotted curve) from SAXS, which are well predicted by the Ising model using parameters obtained in fits to single-factor denaturing experiments. Shown in the inset of b are the individual unfolding profiles of G0–G4, at pH 3, where the G0 group is fully unfolded ( ) in the acidic environment.
Furthermore, the fu,SAXS profile reveals two additional groups: G0 and G4. With the same fitting protocol as that used previously, we fit the three unfolding profiles with the five unfolding groups (G0–G4) using Eq. 3, with 2ΔɛT and T1/2 values fixed at those given in Table 1. Encouragingly, the global (fu,SAXS) and the two local unfolded fraction profiles (fu,CD and fu,abs) can be decently fitted with the thermodynamic parameters given in Table 2, from which insight into pH-induced unfolding of cytochrome c may be identified. We note first that the nontrivial J values manifest the unique feature of interunit coupling in the Ising model, which is not accounted for in the conventional two-state model or its modification with intermediate states. Interestingly, this coupling effect is revealed only in the case of pH-induced unfolding, suggesting that interunit coupling is specifically mediated by protonation; the growth and decay of protein-protein interactions observed via SAXS in pH-induced unfolding are, presumably, caused by internal charge interactions, which redistribute internal and hence surface charges.
TABLE 2.
Fitted thermodynamic parameters of cytochrome c in pH-induced unfolding
| Group | γ | 2Δɛm-pH (kcal mol−1 M−1) | 2ΔɛT (kcal mol−1 K−1) | T1/2(K) | J (kcal mol−1 M−1) |
|---|---|---|---|---|---|
| G0 | 0.13 | −6.0 × 10⁶ | −0.167 | 359 | 0 |
| G1 | 0.011 | −7500 ± 2000 | −0.138 | 333 | −0.25 ± 0.05 |
| G2 | 0.029 | −3000 ± 400 | −0.138 | 346 | −0.3 ± 0.05 |
| G3 | 0.12 | −2000 ± 200 | −0.167 | 354 | −0.25 ± 0.05 |
| G4 | 0.71 | −4500 ± 1500 | −0.167 | 359 | −0.3 ± 0.3 |
Furthermore, for cytochrome c denatured by urea and acid, we also find that the unfolding fractions of CD and fluorescence (Trp-59) agree well with each other. The results indicate that α-helix and Trp-59 heme have nearly the same 2Δɛm and ΔG0 values and unfold collectively in the G3 group.
In the pH-dependent unfolding from pH 1.8 to 7 studied, it is known that there is a transition of cytochrome c from state III to II when the pH value is lowered to ∼2.5 (7,39) from 7. In our case, we observed that the protein conformation changes of cytochrome c are subsequently contributed by the five groups G0 → G1 → G4 → G2 → G3 as the pH value decreased from 7 to 1.8. Higher sensitivities of the groups in the protein correspond to lower denatured energies (2Δɛm-pH). Based on Eq. 4, the acid concentrations at the midpoints of the unfolding fraction fu = 1/2 of the five groups at 295 K, 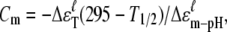 are pH 5.7, 3.1, 2.6, 2.6, and 2.3 for G0, G1, G4, G2, and G3, respectively. In this case, the simple state III cannot account for the fine structural changes we observed with the unfoldings of G0, G1, G4, and G2 in the pH range 7.0–2.6. Nevertheless, the fully unfolded G0, G1, G4, G2, and G3 correspond to state II. As a consequence, the unfolding of G3, corresponding to the unfolding of α-helices, traverses state III into state II and dominates the state transition.
Compared to the urea-induced unfolding (Fig. 3 a), the G4 group unfolds at lower acid concentrations than the G3 group in the pH-induced unfolding (Fig. 4 a). Such results may indicate a larger effect from the internal charge interactions in this group, G4, as revealed from the larger J value shown in Table 2. It may be further noted from Table 2 that, although the G0 and G4 groups are indistinguishable (i.e., of identical 2ΔɛT value) in terms of thermal unfolding, G0 has a higher acid sensitivity (with the lowest 2Δɛm-pH value of all the groups) and may be separated from G4 in an acid-induced unfolding. With exceedingly negative values of 2Δɛm-pH, acid denaturing can alter the unfolding sequence of the temperature-induced unfolding given by T1/2 (or ΔG0), in a moderately acidic environment, as demonstrated below.
Validity of the thermodynamic parameters extracted for pH-induced unfolding of cytochrome c is reaffirmed by comparison of calculated and experimental results in compounded (temperature- and pH-induced) unfolding of cytochrome c. Given in Fig. 4 b is the temperature-dependent unfolded fraction profile obtained from the Rg values of the protein at pH 3 (by SAXS). It is then gratifying to observe that this experimental profile is well matched by that calculated from the five-group unfolding model with parameters given in Table 2. In this acidic environment, the G4 group unfolds at a lower temperature than G3 does; the G0 group is fully unfolded, leading to the partially folded cytochrome c at room temperature (Fig. 4 b, inset).
Comparison with unfolding of lysozyme
Shown in Fig. 5 are two unfolded fraction profiles derived from the Rg values obtained with the ellipsoid fitting of urea- and temperature-dependent SAXS profiles. Also displayed are relevant urea-dependent fu,flu and fu,CD profiles adapted from published fluorescence (4) and CD (40) studies. In contrast to the multigroup unfolding behavior of cytochrome c, the three unfolding profiles of lysozyme overlap approximately. For comparison with cytochrome c, we approximate the lysozyme unfolding with a one-group activity. Presumably, the local structures related to the six Trps (distributed somewhat evenly in the protein) may unfold collectively with the global lysozyme structure, despite some difference in the unfolding of α-helices. Joint fitting of temperature- and urea-dependent fu,SAXS profiles (Fig. 5) results in parametric values of 2ΔɛT = −0.14 (±0.02) kcal mol−1 K−1, 2Δɛm = −1.06 (±0.09) kcal mol−1 M−1, T1/2 = 338 (±4) K, and J = 0.00 (±0.05) kcal mol−1. Values of 2Δɛm and T1/2 are consistent with the literature data (40–43), whereas the 2ΔɛT value is of improved confidence compared to that reported previously (28) due to increased constraints in the joint fitting process here. We note, in addition, that SAXS results for pH-dependent unfolding of lysozyme indicate small changes in the scattering profiles and Rg values (∼5%) upon a gradual decrease in pH from 7 to 1.8.
FIGURE 5.

Urea- and temperature-dependent (inset) unfolded fraction profiles of lysozyme (at pH 2.9) are jointly fitted (dashed curves) with the one-group Ising model. Also shown are the unfolded fraction profiles adapted from published fluorescence (2) and CD (19) studies.
In Table 3, we compare the one-group unfolding parameters of lysozyme with those of the G4 group of cytochrome c, as both sets of parameters characterize the global unfolding behavior. The higher T1/2 value of cytochrome c indicates better thermal stability, whereas the lower 2Δɛm values indicate higher sensitivity in the presence of urea and especially in an acidic environment. Although the two proteins are similar in size and in net surface charges (∼6) when dissolved in water (28,44), cytochrome c (containing a heme group) exhibits rich multigroup unfolding with nontrivial interunit coupling upon pH-induced unfolding, whereas lysozyme roughly undergoes monotonic one-group unfolding that is insensitive to proton concentration.
TABLE 3.
Comparison of the unfolding parameters of lysozyme and cytochrome c. For cytochrome c, the values of the G4 group are used
| Protein | 2ΔɛT (kcal mol−1 K−1) | 2Δɛm-urea (kcal mol−1 M−1) | 2Δɛm-pH (kcal mol−1 K−1) | T1/2(K) | ΔG0 (293K) (kcal mol−1) | J (kcal mol−1M−1) |
|---|---|---|---|---|---|---|
| Lysozyme | −0.14 | −1.06 | insensitive | 338 | 6.3 | 0 |
| Cytochrome c (G4) | −0.167 | −1.30 | −4500 | 359 | 10.9 | −0.3 |
For further information on structural changes of lysozyme during thermal unfolding at pH 7, we performed MD simulation for the partially folded structure at 343 K. As shown in Fig. 6, the equilibrium protein envelope and Rg value (17.3 Å) (obtained after an equilibration time of 4.2 ns with 1.5 fs/step) are consistent with that given by the dummy residue simulation (Rg = 18.0 Å) based on the SAXS data measured. From the partially folded structure, we observe that both terminal α-helices of lysozyme have largely unfolded at 343 K, leaving β-sheets to hold the residual tertiary structure of an ellipsoid-like envelope.
FIGURE 6.

Comparison (side and top views) of the ellipsoid-like protein envelopes from MD (mainly coils and two arrows for β-sheets) and dummy residue simulation (solid beads) for lysozyme at 343 K.
CONCLUSIONS
Combining SAXS and spectroscopic techniques, we have demonstrated that a recently developed mean-field Ising model provides an adequate basis for the quantitative description of the unfolding behaviors of cytochrome c and lysozyme induced by changes in temperature, urea concentration, and/or pH. In contrast to the simplified one-group unfolding of lysozyme, we observed a multigroup unfolding behavior of cytochrome c. Nevertheless, in terms of global structural changes in the thermal or urea-induced unfolding, lysozyme and cytochrome c behave similarly; in contrast, cytochrome c is clearly more vulnerable in acidic environments. The results of a detailed analysis of local structural changes during the unfolding of cytochrome c suggest intricate effects from the prosthetic heme group as well as preferential unfolding of α-helices to the global morphology. In the simpler case of lysozyme, local structural characteristics related to Trps and α-helices undergo largely collective changes with global morphology. Thermodynamic parameters extracted from a simple denaturing processes, on the basis of the Ising model, can be used to predict unfolding behaviors of the proteins in compounded denaturing environments. Integrated local and global structure information improves the understanding of the protein folding-unfolding mechanism and may help in studying the correlations between misfolded local structures and global folding-unfolding behaviors, as noted earlier by Han et al. (45).
Acknowledgments
Thanks are due to Prof. T. C. Chang for CD measurements, C. C. Tseng and Y. Ozcan for SAXS measurements, and Dr. M. Hayashi for fruitful discussion.
This work was supported by the National Science Council (grant No. NSC-95-2112-M-213-002 and NSC 95-2113-M-001-044).
Editor: Jill Trewhella.
References
- 1.Dill, K. A., and H. S. Chan. 1997. From Levinthal to pathways to funnels. Nat. Struct. Biol. 4:10–19. [DOI] [PubMed] [Google Scholar]
- 2.Dobson, C. M. 2001. The structural basis of protein folding and its links with human disease. Philos. Trans. R. Soc. Lond., B. Biol. Sci. 356:133–145. [DOI] [PMC free article] [PubMed] [Google Scholar]
- 3.Doniach, S. 2001. Changes in biomolecular conformation seen by small angle x-ray scattering. Chem. Rev. 101:1763–1778. [DOI] [PubMed] [Google Scholar]
- 4.Ibarra-Molero, B., and J. M. Sanchez-Ruiz. 1997. Are there equilibrium intermediate states in the urea-induced unfolding of hen egg-white lysozyme. Biochemistry. 36:9616–9624. [DOI] [PubMed] [Google Scholar]
- 5.Wrinkler, J. R. 2004. Cytochrome c folding dynamics. Curr. Opin. Chem. Biol. 8:169–174. [DOI] [PubMed] [Google Scholar]
- 6.Maity, H., M. Maity, and S. W. Englander. 2004. How cytochrome c folds, and why: submolecular foldon units and their stepwise sequential stabilization. J. Mol. Biol. 343:223–233. [DOI] [PubMed] [Google Scholar]
- 7.Cinelli, S., F. Spinozzi, R. Itri, S. Finet, F. Garsughi, G. Onori, and P. Mariani. 2001. Structural characterization of the pH-denatured states of ferricytochrome-c by synchrotron small angle x-ray scattering. Biophys. J. 81:3522–3533. [DOI] [PMC free article] [PubMed] [Google Scholar]
- 8.Koch, M. H. J., P. Vachette, and D. I. Svergun. 2003. Small-angle scattering: a view on the properties, structures and structural changes of biological macromolecules in solution. Q. Rev. Biophys. 36:147–227. [DOI] [PubMed] [Google Scholar]
- 9.Akiyama, S., S. Takahashi, T. Kimura, K. Ishimori, I. Morishima, Y. Nishikawa, and T. Fujisawa. 2002. Conformational landscape of cytochrome c folding studied by microsecond-resolved small-angle x-ray scattering. Proc. Natl. Acad. Sci. USA. 99:1329–1334. [DOI] [PMC free article] [PubMed] [Google Scholar]
- 10.Grishaev, A., J. Wu, J. Trewhella, and A. Bax. 2005. Refinement of multidomain protein structures by combination of solution small-angle x-ray scattering and NMR data. J. Am. Chem. Soc. 127:16621–16628. [DOI] [PubMed] [Google Scholar]
- 11.Hsu, I. J., Y.-J. Shiu, U. Jeng, T.-H. Chen, Y.-S. Huang, Y.-H. Lai, L.-N. Tsai, L.-Y. Jang, J.-F. Lee, L.-J. Lin, S.-H. Lin, and Y. Wang. 2007. A solution study on the local and global structure changes of cytochrome c—an unfolding process induced by urea. J. Phys. Chem. A. 111:9286–9290. [DOI] [PubMed] [Google Scholar]
- 12.Krishna, M. M. G., and S. W. Englander. 2007. A unified mechanism for protein folding: predetermined pathways with optional errors. Protein Sci. 16:449–464. [DOI] [PMC free article] [PubMed] [Google Scholar]
- 13.Maity, H., M. Maity, M. M. G. Krishna, L. Mayne, and S. W. Englander. 2005. Protein folding: the stepwise assembly of foldon units. Proc. Natl. Acad. Sci. USA. 102:4741–4746. [DOI] [PMC free article] [PubMed] [Google Scholar]
- 14.Lyubovitsky, J. G., H. B. Gray, and J. R. Winkler. 2002. Mapping the cytochrome c folding landscape. J. Am. Chem. Soc. 124:5481–5485. [DOI] [PubMed] [Google Scholar]
- 15.Shakhnovich, E. I. 1994. Proteins with selected sequences fold into unique native conformation. Phys. Rev. Lett. 72:3907–3910. [DOI] [PubMed] [Google Scholar]
- 16.Abkevich, V. I., A. M. Gutin, and E. I. Shakhnovich. 1995. Impact of local and non-local interactions on thermodynamics and kinetics of protein folding. J. Mol. Biol. 252:460–471. [DOI] [PubMed] [Google Scholar]
- 17.Bruscolini, P., and A. Pelizzola. 2002. Exact solution of the Muñoz-Eaton model for protein folding. Phys. Rev. Lett. 88:258101–258104. [DOI] [PubMed] [Google Scholar]
- 18.Muñoz, V., P. A. Thompson, J. Hofrichter, and W. A. Eaton. 1997. Folding dynamics and mechanism of β-hairpin formation. Nature. 390:196–200. [DOI] [PubMed] [Google Scholar]
- 19.Bakk, A., and J. S. Hoye. 2003. One-dimensional Ising model applied to protein folding. Physica A. 323:504–518. [Google Scholar]
- 20.Liang, K. K., M. Hayashi, Y. J. Shiu, Y. Mo, J. Shao, J. Yan, and S. H. Lin. 2003. Application of the generalized kinetic Ising model to the kinetics of protein folding. J. Chin. Chem. Soc. 50:335–338. [Google Scholar]
- 21.Liang, K. K., M. Hayashi, Y. J. Shiu, Y. Mo, J. Shao, Y. Yan, and S. H. Lin. 2003. Thermodynamics and kinetics of protein folding: a mean field theory. Phys. Chem. Chem. Phys. 5:5300–5308. [Google Scholar]
- 22.Shiu, Y. J., U. Jeng, C. Su, Y.-S. Huang, M. Hayashi, K.-K. Liang, Y.-L. Yeh, and S.-H. Lin. 2007. A modified Ising model for the thermodynamic properties of local and global protein folding-unfolding observed by circular dichroism and small angle x-ray scattering. J. Appl. Cryst. 40:s195–s199. [Google Scholar]
- 23.Shiu, Y. J., C. Su, Y. L. Yeh, K. K. Liang, M. Hayashi, Y. Mo, Y. Yan, and S. H. Lin. 2004. Experimental and theoretical studies of protein folding-unfolding. J. Chin. Chem. Soc. 51:1161–1173. [Google Scholar]
- 24.Yeh, Y. L., K. K. Liang, C. H. Chang, Y. J. Shiu, C. Su, M. Hayashi, G. Yang, J. M. Yuan, C. L. Chyan, S. Jang, F. Y. Li, and S. H. Lin. 2004. Physical chemistry of protein folding—experiments and theories. Trends in Phys. Chem. 40:169–205. [Google Scholar]
- 25.Yeh, Y. L., C. H. Chang, K. K. Liang, Y. J. Shiu, C. Su, M. Hayashi, C. L. Chyan, G. Yang, Y. Mo, Y. J. Yan, and S. H. Lin. 2004. Atomic force microscopic and theoretical studies of poly-ubiquitin proteins. Chem. Phys. Lett. 399:440–445. [Google Scholar]
- 26.Lai, Y. H., Y. S. Sun, U. Jeng, J. M. Lin, T.-L. Lin, H.-S. Sheu, W.-T. Chuang, Y.-S. Huang, C.-H. Hsu, M.-T. Lee, H.-Y. Lee, K. S. Liang, A. Gabriel, and M. H. J. Koch. 2006. An instrument for time resolved and anomalous simultaneous small and wide angle x-ray scattering (SWAXS) at the NSRRC. J. Appl. Cryst. 39:871–877. [Google Scholar]
- 27.Lai, Y. H., Y. S. Sun, U. Jeng, Y. F. Song, K. L. Tsang, and K. S. Liang. 2005. A new small angle x-ray scattering station at NSRRC. Nucl. Instrum. Methods Phys. Res. B. 238:205–213. [Google Scholar]
- 28.Huang, Y.-S., U. Jeng, Y. J. Shiu, Y.-H. Lai, and Y.-S. Sun. 2007. Charge interaction and temperature effects on the solution structure of lysozyme as revealed by small-angle x-ray scattering. J. Appl. Cryst. 40:s165–s169. [Google Scholar]
- 29.Svergun, D. I., M. V. Petoukhov, and M. H. J. Koch. 2001. Determination of domain structure of proteins from x-ray solution scattering. Biophys. J. 80:2946–2953. [DOI] [PMC free article] [PubMed] [Google Scholar]
- 30.Eftink, M. R. 1994. The use of fluorescence methods to monitor unfolding transitions in proteins. Biophys. J. 66:482–501. [DOI] [PMC free article] [PubMed] [Google Scholar]
- 31.MacroModel, version 9.1. 2007. Schrödinger, New York.
- 32.Still, W. C., A. Tempczyk, R. C. Hawley, and T. Hendrickson. 1990. Semianalytical treatment of solvation for molecular mechanics and dynamics. J. Am. Chem. Soc. 112:6127–6129. [Google Scholar]
- 33.Weiner, S. J., P. A. Kollman, D. A. Case, C. U. Singh, C. Ghio, G. Alagona, S. Profeta, and P. Weinerl. 1984. A new force field for molecular mechanical simulation of nucleic acids and proteins. J. Am. Chem. Soc. 106:765–784. [Google Scholar]
- 34.Chen, S. H., and T. L. Lin. 1987. Methods of Experimental Physics—Neutron Scattering in Condensed Matter Research. K. Sköd and D. L. Price, editors. Academic Press, New York.
- 35.Rischel, C., L. E. Jørgensen, and Z. Foldes-Papp. 2003. Microsecond structural fluctuations in denatured cytochrome c and the mechanism of rapid chain contraction. J. Phys. Condens. Matter. 15:S1725–S1735. [Google Scholar]
- 36.Bágel'ová, J., M. Antalík, and Z. Tomori. 1997. Effect of polyglutamate on the thermal stability of ferricytochrome c. Biochem. Mol. Biol. Int. 43:891–900. [DOI] [PubMed] [Google Scholar]
- 37.Hagihara, Y., Y. Tan, and Y. Goto. 1994. Comparison of the conformational stability of the molten globule and native states of horse cytochrome c, effects of acetylation, heat, urea and guanidine-hydrochloride. J. Mol. Biol. 237:336–348. [DOI] [PubMed] [Google Scholar]
- 38.Bai, Y., T. R. Sosnick, L. Mayne, and S. W. Englander. 1995. Protein folding intermediates: native-state hydrogen exchange. Science. 169:192–197. [DOI] [PMC free article] [PubMed] [Google Scholar]
- 39.Boffi, F., A. Bonincontro, S. Cinelli, A. Congiu Castellano, A. De Francesco, S. Della Longa, M. Girasole, and G. Onori. 2001. pH-dependent local structure of ferricytochrome c studied by x-ray absorption spectroscopy. Biophys. J. 80:1473–1479. [DOI] [PMC free article] [PubMed] [Google Scholar]
- 40.Chen, L., K. O. Hodgson, and S. Doniach. 1996. A lysozyme folding intermediate revealed by solution x-ray scattering. J. Mol. Biol. 261:658–671. [DOI] [PubMed] [Google Scholar]
- 41.Scholtz, J. M., D. Barrick, E. J. York, J. M. Stewart, and R. L. Baldwin. 1995. Urea unfolding of peptide helices as a model for interpreting protein unfolding. Proc. Natl. Acad. Sci. USA. 92:185–189. [DOI] [PMC free article] [PubMed] [Google Scholar]
- 42.Murugan, R. 2003. Competitive model on denaturant-mediated protein unfolding. Biophys. J. 84:770–774. [DOI] [PMC free article] [PubMed] [Google Scholar]
- 43.Arai, S., and M. Hirai. 1999. Reversibility and hierarchy of thermal transition of hen egg-white lysozyme studied by small-angle x-ray scattering. Biophys. J. 76:2192–2197. [DOI] [PMC free article] [PubMed] [Google Scholar]
- 44.Wu, C. F., and S. H. Chen. 1987. SANS studies of concentrated protein solutions: determination of the charge, hydration, and H/D exchange in cytochrome c. J. Chem. Phys. 87:6199–6205. [Google Scholar]
- 45.Han, J. H., S. Batey, A. A. Nickson, S. A. Teichmann, and J. Clarke. 2007. The folding and evolution of multidomain proteins. Nat. Rev. Mol. Cell Biol. 8:319–330. [DOI] [PubMed] [Google Scholar]