

Abstract
The 18.5 kDa isoform of myelin basic protein (MBP) is the predominant form in adult human central nervous system myelin. It is an intrinsically disordered protein that functions both in membrane adhesion, and as a linker connecting the oligodendrocyte membrane to the underlying cytoskeleton; its specific interactions with calmodulin and SH3-domain containing proteins suggest further multifunctionality in signaling. Here, we have used multidimensional heteronuclear nuclear magnetic resonance spectroscopy to study the conformational dependence on environment of the protein in aqueous solution (100 mM KCl) and in a membrane-mimetic solvent (30% TFE-d2), particularly to analyze its secondary structure using chemical shift indexing, and to investigate its backbone dynamics using 15N spin relaxation measurements. Collectively, the data revealed three major segments of the protein with a propensity toward α-helicity that was stabilized by membrane-mimetic conditions: T33-D46, V83-T92, and T142-L154 (murine 18.5 kDa sequence numbering). All of these regions corresponded with bioinformatics predictions of ordered secondary structure. The V83-T92 region comprises a primary immunodominant epitope that had previously been shown by site-directed spin labeling and electron paramagnetic resonance spectroscopy to be α-helical in membrane-reconstituted systems. The T142-L154 segment overlapped with a predicted calmodulin-binding site. Chemical shift perturbation experiments using labeled MBP and unlabeled calmodulin demonstrated a dramatic conformational change in MBP upon association of the two proteins, and were consistent with the C-terminal segment of MBP being the primary binding site for calmodulin.
INTRODUCTION
The genes of the oligodendrocyte lineage (Golli) produce several isoforms of the myelin basic protein (MBP) family, arising from three transcription start sites and differential exon splicing (1,2). The classic isoforms of MBP arise from transcription start site 3, and are expressed primarily in the mature central nervous system, where they are known to maintain the compaction of the myelin sheath (3). It has been suggested that some variants of MBP might have further roles in myelin signaling and cytoskeletal assembly (3–7), because of their myriad combinatorial posttranslational modifications (phosphorylation, methylation, deimination) (7,8), specific binding to Ca2+-calmodulin (9–11) and SH3-domains (12), and ability to polymerize and bundle actin and tubulin (13–17). Myelin basic protein is implicated in the pathogenesis of the neurodegenerative disease multiple sclerosis as a mediator of myelin degeneration due to increased deimination, and as a candidate self-antigen (8,18–21).
Based on their net charge to mean hydrophobicity ratio, and various spectroscopic measurements, all known forms of MBP (both classic and Golli) belong to the class of intrinsically disordered proteins (IDPs), sometimes also called intrinsically unstructured proteins (7,22–24). Many IDPs are multifunctional and/or involved in signaling pathways (25–27). They have an extended conformation to present a large effective surface area for interaction with a variety of diverse ligands, which they bind with high specificity, and are often hubs (or central linkers) of protein interaction networks (28–31). These intermolecular associations may involve preformed (inherent and transient, or induced) structural elements such as α-helices, and/or an induced fit, i.e., coupled folding and binding (32–44). Dunker and colleagues have encapsulated this idea in their molecular recognition fragments (MoRF, specifically α-MoRF) hypothesis (45,46).
The most powerful approach to probing the conformational dynamics and interactions of IDPs is nuclear magnetic resonance (NMR) spectroscopy (47–52). Since the propensity of IDPs to adopt different conformations is highly dependent on their environment and on their binding partners, comparative NMR studies of MBP under differing conditions will provide important insights into the structural and functional details of this family (7). A peptide fragment encompassing an immunodominant epitope of MBP (corresponding to murine 18.5 kDa residues P82-P93) has been characterized by solution NMR in aqueous buffer, in 30% trifluoroethanol (TFE-d2, a membrane-mimetic solvent (CF3-CD2-OH)), and in deuterated dodecylphosphocholine (DPC-d38) micelles (53). In the whole protein, this segment of MBP had previously been shown by site-directed spin-labeling (SDSL) and electron paramagnetic resonance (EPR) spectroscopy to be an amphipathic α-helix lying on the surface of the myelin membrane, slightly tilted and partially embedded (54). The structure of the fragment studied by solution NMR was, indeed, α-helical in TFE-d2 and in the DPC-d38 micelles.
We have performed multidimensional heteronuclear solution NMR and backbone assignment of full-length 18.5 kDa recombinant murine MBP (rmMBP, a posttranslationally unmodified form of 176 residues) in both 30% TFE-d2 (55), and in 100 mM KCl solution (56). In this study, multidimensional heteronuclear NMR spectroscopy was used to probe further the structure and dynamics of rmMBP under these two different solution conditions. The deviation of chemical shifts of many spins (including 13Cα, 13Cβ, and 1Hα) from random coil values provides a sensitive probe of secondary structure propensities (57–59). The measurement of 15N and spin relaxation rates provides information about internal dynamics of proteins on the picosecond-to-nanosecond and microsecond-to-millisecond timescales (47,60,61). Here, we have identified several segments of rmMBP that form transient α-helices, representing putative binding targets for other proteins. One of these segments has been strongly implicated as being the primary binding site for calmodulin, identified using chemical shift perturbation analysis. This result adds to the mounting evidence that the physiological role of MBP in central nervous system myelin is more than simply a membrane adhesion factor, but that it is, in fact, a multifunctional adaptor protein (3,9,11,12,14,15).
MATERIALS AND METHODS
Materials
Most chemicals were reagent grade and acquired from either Fisher Scientific (Unionville, ON, Canada) or Sigma-Aldrich (Oakville, ON, Canada). Electrophoresis grade chemicals were purchased from ICN Biomedicals (Costa Mesa, CA) or Bio-Rad Laboratories (Mississauga, ON, Canada). The nitrilotriacetic-acid agarose beads were purchased from Qiagen (Mississauga, ON, Canada). The stable isotopic compounds D2O, 15NH4Cl, and 13C6-glucose were obtained from Cambridge Isotope Laboratories (Andover, MA).
Protein expression and purification
Uniformly 15N- or 13C15N-labeled recombinant murine MBP (rmMBP, 176 residues including an LEH6 tag) was expressed in Escherichia coli BL21-CodonPlus(DE3)-RP cells (Stratagene, La Jolla, CA), grown in M9 minimal media with either 15NH4Cl and/or 13C6-glucose (Cambridge Isotope Laboratories) as the sole nitrogen and/or carbon source(s). Purification was as previously described (62) with minor modifications to improve recovery (55,56). A yield of ∼10–12 mg of purified, labeled rmMBP was obtained per liter of culture.
The plasmid-encoding Xenopus laevis calmodulin with a hexahistidine tag (pET-3a-CaM) was a generous gift from Dr. Mitsu Ikura (Ontario Cancer Institute, Toronto, ON, Canada). Uniformly 15N-labeled X. laevis calmodulin (CaM) was prepared as previously described (63), with a yield of ∼40 mg of protein per liter of culture.
Protein concentrations were determined here by measuring the absorbance at 280 nm, a parameter that we have calibrated by amino-acid analysis. The values of the extinction coefficients used were 0.623 L g−1 cm−1 (rmMBP), and 0.152 L g−1 cm−1 (CaM). These values (in 6.0 M guanidine hydrochloride, 0.02 M phosphate, pH 6.5), were calculated on the basis of the amino-acid sequences using the ProtParam software tool (available at http://www.expasy.ch).
Solution NMR spectroscopy
Backbone and most side-chain resonance assignments for uniformly 13C15N-labeled rmMBP dissolved in either 30% TFE-d2, or in 100 mM KCl, have been previously reported. In these first studies, complementary three-dimensional heteronuclear NMR experiments for establishing backbone connectivity were performed at either 300 K (2 mM 13C15N-rmMBP in 30% TFE-d2, pH 6.5) (55), or at 277 K (2 mM 13C15N-rmMBP in 100 mM KCl, pH 6.5, 10% D2O) (56). Here, new backbone resonance assignments for 18.5 kDa rmMBP in 100 mM KCl at 300 K were obtained by tracking the gradual shift of observable crosspeaks in a series of heteronuclear single quantum coherence (HSQC) experiments recorded at 277 K, 283 K, 289 K, 295 K, and 300 K. The temperature series was recorded on an Avance spectrometer (Bruker BioSpin, Milton, Ontario, Canada) operating at a proton Larmor frequency of 600.13 MHz, using identical acquisition and processing parameters to those previously reported (56,64). These additional resonance assignments were deposited, as an addendum, to the Biological Magnetic Resonance Databank (BMRB) with accession number 15131.
Secondary chemical shifts
The chemical shift deviations from random coil values were used to assess the secondary structure propensities along the backbone of rmMBP. Random coil values (65) were corrected for sequence dependence using sequence-specific correction factors determined for a set of Ac-GGXGG-NH2 peptides in 8 M urea at pH 2.3 (66). The normalized sequence-corrected chemical shift indices ΔδCα, ΔδCβ, ΔδN, and ΔδHN, for Cα, Cβ, N, and HN, respectively, were combined to yield a normalized chemical shift index (CSI):
 |
(1) |
The chemical shift indices were calculated using an in-house script as previously performed (64), written in Lua (Pontifical Catholic University of Rio de Janeiro, Brazil) and executed in computer-aided resonance assignment (CARA) 1.8.3 (67). The Cα, Cβ, and Hα chemical shift data were also used to assess the secondary structure propensity of rmMBP using the program SSP (68).
15N relaxation measurements
All relaxation experiments were recorded on uniformly 15N-labeled MBP samples (1.72 mM 15N-rmMBP in 30% TFE-d2, pH 6.5, 1 mg 2,2-dimethyl-2-silapentane-5-sulfonic acid (DSS); or 1.75 mM 15N-rmMBP in 100 mM KCl, pH 6.5, 10% D2O, 1 mg DSS). The relaxation parameters of 15N were measured using standard approaches (69–71). The spin-lattice R1 rate measurements were conducted with relaxation delays of 1.6, 50, 100, 200, 300, 400, 800, 1000, and 1200 ms as previously described (70,71). The spin-spin relaxation constant R2 measurements were done with Carr-Purcell-Meiboom-Gill (72) delays of 0, 64, 128, 160, 192, 224, 256, 288, and 320 ms. The relaxation rates for both R1 and R2 were determined from the decay of the intensity of each 1H -15N crosspeak in this series of spectra. All of the relaxation parameters, along with the {1H}-15N nuclear Overhauser effect (NOE) intensities for backbone 15N nuclei, were measured at 300 K, at a magnetic field strength of 14.1 T (corresponding to the resonance frequency of 600.13 MHz for 1H), and sweep widths of 12 parts per million (ppm) (1H) and 35 ppm (15N). The number of points was 256 and 2048 in the indirect and direct dimensions, respectively, with 48 transients per point.
The relaxation constants and the experimental errors were extracted by a single exponential curve-fitting of the peak heights using a SPARKY (T. D. Goddard and D. G. Kneller, SPARKY 3, University of California, San Francisco) built-in option. The best fit was obtained by minimizing the root mean-square deviation of the experimental peak heights from the fit. Random errors for R1 and R2 values were estimated by calculating a best fit for a set of perturbed heights 5000 times; the heights were perturbed by computer-simulated noise with a Gaussian distribution of zero mean, and with variance equal to the root mean-square deviation of the heights from the original best fit. The spread in the best-fit values was used as a measure of the experimental random error.
The steady-state {1H}-15N NOE intensities were obtained from the ratio INOE/INONOE, where INOE and INONOE are the peak heights in the NOE spectra with and without proton saturation, respectively. These spectra were collected using a standard experiment (70), with the same acquisition parameters as those of the HSQC spectrum, except that the number of transients per point was 192. The uncertainty in measuring NOE intensities was determined as previously described (64,73).
Spectral density function
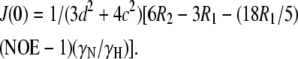
The frequency components of the relaxation parameters R1, R2, and NOE are described by the spectral density function J(ω) (73,74). Here,
 |
(2) |
 |
(3) |
 |
(4) |
where  μ0 is the permeability of free space, h is Planck's constant, γH and γN are gyromagnetic ratios of hydrogen and nitrogen nuclei, respectively, rNH is the proton-nitrogen bond length, ωH and ωN are the Larmor frequencies for proton and nitrogen, respectively, and Δσ is the chemical shift anisotropy of 15N (−160 ppm). Here, Rex is a term introduced to account for contributions arising from conformational averaging on the microsecond-to-millisecond timescale that are not averaged by the Carr-Purcell-Meiboom-Gill (72) pulse train.
The three experimental parameters R1, R2, and NOE are not sufficient to extract the spectral density function J(ω) at five frequencies. However, the values of J(ωH), J(ωH+ωN), and J(ωH−ωN) can be assumed to be approximately equal in the case of 15N relaxation (75). Furthermore, if the contribution from slow conformational exchange, Rex, is assumed to be negligible compared to the other terms under certain conditions, then Eqs. 2–4 can be solved to calculate the spectral density function at three frequencies:
 |
(5) |
 |
(6) |
 |
(7) |
The R1, R2, and NOE values measured at 300 K, and the 1H frequency of 600.13 MHz were used as input parameters for Eqs. 5–7. The uncertainties of these inputs were combined using the standard error propagation methods to propagate the uncertainties in the calculated spectral density values, as was previously performed for the Golli-MBP isoform rmBG21 (64,73).
Model-free analysis
To quantify further the microscopic local motion parameters of the amide 15N relaxation rates, a Lipari-Szabo (76,77) analysis with the extension of Clore et al. (78), was performed with the MODELFREE (v. 4.20) software suite (79,80). In this treatment, the spectral density function is assumed to be related to a set of internal motional parameters which include descriptions of the correlation times (τm, τs, and τf) and order parameters (S2,  and
and  ). The fast and slow internal correlation times are given by τf and τs, respectively, whereas the overall correlation time of the molecule is τm. Likewise,
  and S2 =
  are the descriptions of the slow, fast, and generalized motions, respectively.
The initial estimates for τm for rmMBP in either 30% TFE-d2 or 100 mM KCl were obtained using the MODELFREE grid search function. The models that describe the local motions of the individual NH vectors were optimized separately according to the procedure outlined by Mandel et al. (79). This strategy accounts for the different timescales of the motions arising from structural variations, motional restrictions, and/or exchange. A summary of the models used for 18.5 kDa rmMBP is given in Supplementary Material, Data S1, Table S1. Different rotational diffusion models included in the MODELFREE software package were evaluated, and the isotropic diffusion model was found to provide the best fit to the rmMBP relaxation data for both experimental conditions examined (30% TFE-d2, 100 mM KCl). For the final model fitting, a maximum of three rotational parameters and the overall correlation time could be fit to R1, R2, and NOE acquired at 600 MHz. Errors were determined based on 500 Monte Carlo simulations of Brent's implementation of Powell's method for multidimensional minimization (MODELFREE manual (80)).
Interactions with Ca2+-calmodulin
Samples of rmMBP with CaM were prepared where only one of the binding partners was isotopically labeled, and the unlabeled partner was in molar excess. A series of combinations was prepared which allowed for the assessment of structural changes in both binding partners based on chemical shift perturbations. The following samples were prepared to examine rmMBP-CaM binding: 1), 0.9 mM 15N-rmMBP; 2), 1.25 mM 15N-CaM; 3), 0.78 mM 13C15N-rmMBP with 0.96 mM CaM; and 4), 0.80 mM rmMBP with 0.64 mM 15N-CaM. All proteins were dissolved in 100 mM KCl, 8 mM CaCl2, pH 6.5, 10% D2O, with 0.75 mg DSS added as an internal reference. Briefly, rmMBP and CaM were first dissolved separately in distilled, deionized water at concentrations <1 mg/mL; the samples were exchanged to the experimental buffer using Amicon Ultra 10,000 MWCO spin filters (Millipore, Billerica, MA). Calmodulin was slowly titrated into the rmMBP solution and concentrated using the same spin filter. The final volume was reduced to 500 μL, and the samples were introduced into D2O-matched Shigemi NMR tubes (Shigemi, Allison Park, PA).
The 1H-15N HSQCs were recorded for each sample on an Avance III spectrometer (Bruker) operating at a proton Larmor frequency of 800.23 MHz. Sequential backbone assignments of 13C15N-rmMBP (sample 3, above) were accomplished using the Bruker suite of standard three-dimensional heteronuclear experiments: CBCA(CO)NH, CBCANH, and HCC(CO)NH (81). All three-dimensional spectra were acquired using 12 transients, 2048 × 40 × 128 (F3 × F2 × F1) points employing echo-anti-echo (F2) (82) and states-time-proportional phase incrementation quadrature (F1) detection. The sweep widths were 12, 32, and 83 ppm with the carrier frequencies set at 4.7, 119, and 39 ppm for F3, F2, and F1, respectively. The spectra were apodized using a shifted (π/3), squared, sinusoidal bell function, zero-filled, and linear-predicted (forward with 8 (F2) and 16 (F1) prediction coefficients) before Fourier transformation. The software package TopSpin 2.0 (Bruker BioSpin, Rheinstetten, Germany) was used for spectral processing. The 1H chemical shifts were referenced to the internal methyl signal of DSS. The 15N and 13C chemical shifts were indirectly referenced using IUPAC recommended ratios of 0.251449530 (γ13C/γ1H) and 0.101329118 (γ15N/γ1H) (82). Assignments were done using CARA 1.8.3 (67), and modules contained in the CARA software package (http://www.nmr.ch).
RESULTS AND DISCUSSION
Chemical shift assignment of full-length 18.5 kDa rmMBP under different conditions
We initially performed multidimensional heteronuclear solution NMR studies of 18.5 kDa rmMBP in 30% TFE-d2 (55) (BMRB accession number 6100). These conditions were chosen to mimic the membrane environment of the myelin sheath, while keeping the system experimentally tractable to solution NMR methodology (7). We argue that 30% TFE stabilizes transient α-helices within the protein (83–85) on the basis of multiple, complementary studies on the immunodominant epitope of MBP (murine residues P82-P93). This segment forms an amphipathic, membrane surface-associated α-helix in full-length rmMBP reconstituted with myelin-lipid vesicles (54,86). Solution NMR studies of an 18-residue peptide encompassing this fragment showed this epitope to be disordered in aqueous solution, and α-helical in both 30% TFE-d2 and DPC-d38 micelles (53). Since the TFE solution condition stabilized this real α-helix, we consider that other α-helical segments identified in MBP under these conditions are also likely to be functionally relevant, considering the multitude of interaction partners already identified for this protein (7).
We acknowledge that results obtained with TFE and other fluorinated alcohols should always be interpreted with caution (83,85,87). Most importantly, however, membrane-mimetic conditions using organic solvents are unsuitable to probe interactions of MBP with proteins such as Ca2+-CaM (9), due to the potential (and uncharacterized) influence of the solvent on the function of calmodulin (D. S. Libich, V. V. Bamm, and G. Harauz, unpublished data). Therefore, these studies were more recently extended to rmMBP in 100 mM KCl solution, a more physiologically relevant condition that emulates the intracellular cytosolic oligodendrocyte environment (56) (BMRB accession number 15131), and in which the structure of Ca2+-CaM has been extensively characterized (88).
Although a peptide fragment (residues Q78-T95) of rmMBP has also been studied in DPC-d38 micelles (53), the NMR spectra of the full-length protein under these conditions showed considerable peak broadening (results not shown). Since one of the main functions of 18.5 kDa MBP is membrane adhesion, it aggregates lipid vesicles in vitro (89). Thus, reconstituting full-length 18.5 kDa MBP with lipid micelles or vesicles results in excessively large complexes or aggregates, so that obtaining usable data under these conditions is impossible using solution NMR methodologies. Such reconstituted systems are better suited for solid-state NMR studies. An approach using several complementary heteronuclear correlation experiments to achieve a partial assignment of the mobile fragments of membrane-associated MBP has recently been described (90). However, solid-state NMR requires considerable further development before a full three-dimensional structure can be realized, particularly to probe the membrane-embedded segments (91). Here, solution NMR was applied to study aspects of 18.5 kDa MBP's multifunctionality by focusing on the two conditions under which resonance assignments could be achieved, an aqueous and a membrane-mimetic environment.
The 1H-15N HSQC spectrum of full-length 18.5 kDa rmMBP in 100 mM KCl at 300 K is shown in Fig. 1, for comparison with previously published HSQCs of the protein in 30% TFE-d2 at 298 K (55), and in 100 mM KCl at 277 K (56). The new assignments in Fig. 1 were obtained by tracking the crosspeaks assigned at 277 K through a series of temperature-dependent spectra, and have been deposited in the BMRB under accession number 15131. The absence of significant protein aggregation in these preparations is supported by previous fluorescence spectroscopy and dynamic light scattering experiments (9), as well as the relative quality and reproducibility of the HSQC spectra (55,56).
FIGURE 1.

The 1H-15N HSQC spectrum of uniformly 15N-labeled rmMBP (176 residues, including a C-terminal LEH6 tag) dissolved in 100 mM KCl in water at a concentration of 1.75 mM, recorded at 300 K. A total of 160 of 164 expected backbone peaks are assigned (there are 11 prolyl residues); peaks that appear below the displayed contour levels are not shown. Assignments are based on the assignments first performed at 277 K (56), and were obtained by tracking the assigned crosspeaks through a series of spectra recorded at increasingly higher temperatures.
Chemical shift index analysis
Chemical shift index (CSI) analysis can be used to assess the occurrence, proportion, and type of ordered secondary structure (α-helix, β-strand) in a protein under different conditions (57–59). A more detailed analysis of the chemical shift data, which accounts for the probability that a particular sequence of residues will occupy structured space, can be obtained using the secondary structure propensity (SSP) algorithm (68). Chemical shift difference plots for rmMBP in 30% TFE-d2, the solution membrane-mimetic condition, are given in Fig. 2. The corresponding chemical shift data for the protein in 100 mM KCl are given in Data S1, Fig. S1. The normalized CSI and SSP values are presented in Fig. 3 for the protein dissolved in 30% TFE-d2 (Fig. 3, A and B), and in 100 mM KCl (Fig. 3, C and D). These experimental data are presented for comparison with a theoretical prediction of intrinsic disorder using Predictor of Naturally Disordered Regions (PONDR) (92,93) (Fig. 3 E), a secondary structure prediction using Garnier-Osguthorpe-Osborne (GOR) 4 (94) (Fig. 3 F), and hydrophobic cluster analysis (HCA) (95) (Fig. 3 G).
FIGURE 2.

Chemical shift difference plots (A) HN, (B) N, (C) Hα, (D) Cβ, (E) Cα, for rmMBP in 30% TFE-d2 at 300 K. The random coil values for HN, N, Hα, and Cα have been adjusted for sequence dependence as previously described for the Golli-MBP isoform rmBG21 (64). The dashed lines in all the panels indicate the minimum threshold values for the formation of secondary structure elements. Generally, a consecutive stretch of four residues above the threshold value, or three residues below the threshold value, is considered to be an α-helical or β-strand element, respectively.
FIGURE 3.

Experimentally measured parameters (SSP and normalized CSI) for (A and B) rmMBP in 30% TFE-d2 at 300 K, and (C and D) rmMBP in 100 mM KCl at 277 K, for comparison with (E) IDP order predictions using PONDR (VL-XT Predictor) (92,93), (F) secondary structure predictions using GOR4 (94), and (G) a visually enhanced sequence representation using hydrophobic cluster analysis (HCA) (95). The gray bars align the PONDR-predicted regions of order over all the panels. The dashed lines in panels B and D represent minimum threshold values for the formation of either α-helices (positive values), or β-strands (negative values). PONDR uses a neural network to predict regions of order/disorder in IDPs; the dashed line (E) represents the order/disorder threshold. Based on this prediction, rmMBP has three regions of order which align with the α-helical prediction from GOR4 (F). Hydrophobic cluster analysis (HCA) visually enhances primary sequence data using symbols (□, T; ⊡, S; ♦, G; ★, P), and colors (red, P and acidic residues D, E, N, Q; blue, basic residues H, K, R; green, hydrophobic residues V, L, I, F, W, M, Y; and black for all other residues, G, S, T, C, A). The hydrophobic clusters in rmMBP (G) align with both the predicted α-helices (F) and the experimentally measured α-helices (A and B), and occur within the PONDR-predicted ordered regions (E).
The chemical shifts of full-length rmMBP dissolved in 100 mM KCl are considerably different from those obtained for the protein under solution membrane-mimetic conditions, i.e., 30% TFE-d2, as previously observed with an 18-residue peptide fragment (53). CSI analysis confirmed some expected environment-specific structural details. Notably, the amphipathic α-helix (P82-P93) present in the full-length protein in membrane-associated form (54,86), or in an 18-residue MBP-derived peptide under solution membrane-mimetic conditions (53), appears disordered here under aqueous conditions. SSP analysis indicates that the same regions of 18.5 kDa rmMBP are capable of forming α-helices in both TFE and KCl (Fig. 3, A and C, respectively) The CSI analysis clearly shows the formation of stable α-helices in several distinct regions of rmMBP in 30% TFE-d2 (Fig. 3 B), but not in 100 mM KCl (Fig. 3 D). These measurements of secondary structure correspond to the regions of order predicted by PONDR (Fig. 3 E). Here, there are three sections of MBP that form α-helices in the membrane-mimetic solvent, and that correspond to the CSI, SSP, and HCA predictions: T33-D46, V83-T92, and T142-L154 (Fig. 3).
Relaxation measurements—summary of MBP dynamics
To characterize rmMBP further under these conditions, the dynamics (R1, R2, and NOE) of the polypeptide backbone were recorded (Fig. 4 and Table 1) (47,60,61). Since rmMBP dissolved in 30% TFE-d2 has a higher degree of stabilized structure than in 100 mM KCl, as indicated by CSI and SSP analysis, the following analysis further contrasts these differences and highlights this protein's extreme conformational dependence on environment.
FIGURE 4.

Relaxation measurements for rmMBP at 600 MHz and 300 K. We show the R1 values (A and B), R2 values (C and D), and {1H}-15N NOE intensities (E and F) of 13C15N-rmMBP in 30% TFE-d2 (A, C, and E), and in 100 mM KCl (B, D, and F). Experimental values are shown as solid squares (▪) with experimental error. The MODELFREE (v. 4.20) best fits are represented with open circles (○). The goodness of fit is clear at points where an open circle obscures the solid square.
TABLE 1.
Summary of the averaged relaxation (R1, R2, and NOE) and order parameters (S2 and Rex) for rmMBP in either 30% TFE-d2 or 100 mM KCl, at 300 K and at a magnetic field strength of 14.1 T (corresponding to the resonance frequency of 600.13 MHz for 1H)
| Condition | τr (ns) | S2 | Rex (s−1) | R1 (s−1) | R2 (s−1) | NOE |
|---|---|---|---|---|---|---|
| 30% TFE-d2 | 6.74 ± 0.09 | 0.63 ± 0.11 | 1.17 ± 0.66 | 1.64 ± 0.23 | 8.07 ± 0.73 | 0.51 ± 0.08 |
| 100 mM KCl | 1.26 ± 0.01 | 0.46 ± 0.04 | 7.17 ± 0.41 | 1.10 ± 0.10 | 8.57 ± 0.37 | 0.09 ± 0.01 |
rmMBP in 30% TFE-d2
The R1 (spin-lattice relaxation) measurements indicate a relatively flat line with an average of ∼1.64 ± 0.23 s−1 (Fig. 4 A). There is a local minimum that is observed for the region bounded by residues P98-K102 (murine numbering). The relative errors observed for the R1 measurements may be due to slight temperature variations which may have caused minor peak-intensity fluctuations (96). Although rmMBP forms stabilized α-helices under these conditions (discussed below), there is still expected to be a considerable amount of conformational plasticity in the protein. Particularly, tertiary conformational fluctuations may also introduce uncertainty in the measured relaxation rates. Hydrodynamic methods (e.g., small-angle x-ray scattering or pulsed field gradient nuclear magnetic resonance (48,50,97)), or long-range structural information (obtained via paramagnetic relaxation enhancement and SDSL (48)) would be helpful to provide further insight to the conformational behavior of rmMBP. The R2 (spin-spin relaxation) measurements fluctuate with local maxima (Fig. 4 C) that correspond to the SSP- and CSI-predicted α-helices (Fig. 3, A and B, respectively), suggesting a higher degree of immobilization in those regions. There are four major regions of positive and large NOE intensities (Fig. 4 E) that correlate with the R2 data, and that correspond to the SSP and CSI plots that indicate α-helical propensity (Fig. 4 C, and Fig. 3, A, and B, respectively). We interpret these correlations as evidence that there are four TFE-stabilized α-helices present in 18.5 kDa rmMBP. These α-helices occur in regions that have been predicted to be structured via secondary structure prediction algorithms and PONDR analysis. There seems to be an area of higher restraint (possibly a less-stabilized helix than the other regions at L13-H21; dynamics identify motional restriction in this area, but the CSI does not quite meet the threshold for α-helical structure). A final region of restraint is adjacent to the C-terminal helix, covering residues R157-R167. Although the CSI again does not quite meet the threshold for α-helical structure (this region contains a prolyl residue and has an adjacent GG pair), one cannot rule out the influence of the C-terminal Leu-Glu-His6-tag on the stability of this region.
rmMBP in 100 mM KCl
The R1 measurements form a relatively featureless line with an average R1 value of 1.10 ± 0.10 s−1 (Fig. 4 B). The R2 measurements (Fig. 4 D) feature several regions (broadly, these are T33-D46 and T147-L154) of restricted motions that lie within the PONDR-predicted regions of order (Fig. 3 E), yet the corresponding NOE intensities (Fig. 4 F) are close to zero. This result indicates that there are no stabilized secondary structure elements in these regions, in contrast to the observations of α-helices in the membrane-mimetic condition. The restrained motions in these two regions may be due to local hydrophobic collapse, since the HCA analysis identifies clusters of F, I, and L residues (Fig. 3 G). Interestingly, the immunodominant epitope (P82-P93) does not exhibit higher R2 values, and the NOE data are similar in intensity to the rest of the protein in that region (Fig. 4 F), suggesting that the α-helix in this segment is disrupted under these conditions. This result is consistent with previous observations of an 18-residue peptide fragment encompassing this region, that 100 mM KCl was insufficient to stabilize the amphipathic α-helix fully (53). Overall, the NOE measurements do not suggest that there are any regions of restrained motions under these conditions, from which we conclude that rmMBP remains in a primarily random structural ensemble, even though there are segments that show a propensity toward secondary structure formation (Fig. 3). The overall degree of flexibility for this classic 18.5 kDa MBP isoform in aqueous solution is still not as extreme as for the early developmental Golli-MBP isoform rmBG21 (64). These two isoforms share a common segment of 56 amino acids, over which the NOE values show a good correlation and the R1 values a similar pattern (Data S1, Fig. S2), although the comparisons should be viewed with a degree of caution due to potential minor variations in experimental parameters.
Spectral density function analysis
In addition to the dynamics information obtained by measuring R1, R2, and NOE intensities, spectral density mapping is useful to gauge motions in a qualitative manner, without introducing model-related systematic errors (48,98). The spectral density sampled at low frequency, J(0), is used to identify slow (ms-μs) internal motions. The value of the high frequency spectral density function J(ωH) is sensitive only to fast internal motions, reporting on the sub-nanosecond timescale. These fast motions make the value of J(ωH) larger than the average value. The spectral density function values derived for rmMBP at three frequencies are shown in Fig. 5 (A, C, and E: 30% TFE-d2; B, D, and F: 100 mM KCl).
FIGURE 5.

Spectral density function values for 15N-rmMBP at 300 K in 30% TFE-d2 (A, C, and E), or 100 mM KCl (B, D, and F). The spectral density function was derived at three frequencies, 600.13 MHz (ωH, A and B), 60.8 MHz (ωN, C and D), and 0 (E and F). The dashed line in each panel represents the mean value of the respective spectral density function.
The higher frequency spectral density function values J(ωH) and J(ωN) are shown in Fig. 5, A–D. In Fig. 5 A (rmMBP in 30% TFE-d2), the regions that display J(ωH) values below the average for the whole protein correspond to the segments L13-H21, T33-D46, V83-T92, and T142-L154, suggesting that these regions are under more restraint than the regions that have values higher than average. Furthermore, the identified regions correspond to J(0) values (Fig. 5 E) that are above the average values, again suggesting restricted motions indicative of secondary structure formation. The corresponding plot of J(ωH) values for rmMBP in 100 mM KCl (Fig. 5 B) is a relatively featureless curve, with no indication of either very fast or slow motions relative to the average spectral density. It is interesting to note that the average values of J(ωH) are the same for rmMBP dissolved in both 30% TFE-d2 or 100 mM KCl, although there are no indications of local restricted motion on the fast timescale under the latter condition.
There seems to be an indication of slight motional restriction of segments T33-D46 and Y142-L154 under the KCl conditions, as indicated by higher than average values observed for J(0) (Fig. 5 F) in these segments. This result may be indicative of the propensity of these regions to become structured upon encountering stabilizing conditions, such as membrane or protein interactions, or the result of local hydrophobic clustering (Fig. 3 G). The value of J(ωN) is much less informative in terms of backbone motion, although there is a local minimum observed for residues R94-Q100 for the protein in 30% TFE-d2 (Fig. 5 C). This region encompasses a proline-rich segment which may form a polyproline type II helix (12,99) (see below). The corresponding J(ωN) plot for rmMBP in 100 mM KCl (Fig. 5 D) shows a featureless line. The spectral density function thus identifies regions that correspond with the stabilized secondary structural elements identified by CSI analysis (Fig. 3, A and B), the predicted α-helices (Fig. 3 F), and the PONDR-predicted ordered segments (Fig. 3 E), and which encompass the hydrophobic clusters found in MBP (Fig. 3 G). These results clearly demonstrate the reliance of MBP on its surrounding environment for the formation and stabilization of structure (7), behavior entirely consistent with IDPs in general (48,50–52).
Model-free analysis—order parameters
The order parameters for both the aqueous and membrane-mimetic conditions were extracted from the experimental data using MODELFREE analysis, and are plotted in Fig. 6, with a complete list of values given in Data S1, Tables S2 and S3. The rotational correlation times (Table 1) extracted for rmMBP in 30% TFE-d2 (6.74 ± 0.09 ns) and 100 mM KCl (1.26 ± 0.01 ns) are a further indication of the influence of the environment on the protein's structure. In 30% TFE-d2, rmMBP behaves as a relatively compact molecule, although it may sample several different tertiary conformations as noted above. A value of 1.26 ± 0.01 ns for τr is very fast for a protein of this size (19,422 Da for rmMBP (100)), which suggests that rmMBP in 100 mM KCl is in a primarily extended state, particularly when contrasted with the membrane-mimetic condition. The value of S2 provides a measure of rapid internal motions relative to the overall rotational diffusion (Fig. 6, A and B), whereas Rex accounts for the presence of low frequency motions (Fig. 6, C and D) (101). Significantly large values of Rex identify residues that experience conformational or chemical exchange on a microsecond-to-millisecond timescale, rates at which events such as ligand-binding or dissociation, or conformational exchange, often occur (102). Here, in 30% TFE-d2 (Fig. 6 C), there are three major segments of rmMBP with a nearly contiguous run of significantly higher values of Rex (>1.5 s−1): Y12-H21, V84-T95, and S149-L154. Again, the latter two segments correspond with the ordered secondary structure regions indicated in Fig. 3, whereas the first one (Y12-H21) overlaps partly with them. The large Rex values observed for 100 mM KCl, in conjunction with the featureless S2 curve suggest either a high degree of disorder, and/or a high degree of exchange consistent with an averaged structural ensemble, and are therefore not an adequate description of the complex motions exhibited by rmMBP in an aqueous environment (102,103). The values of S2 and Rex plotted (Fig. 6, B and D, respectively) should not be viewed as an absolute description of the motions and exchange processes occurring under these conditions (100 mM KCl), but rather an indication of the extreme conformational flexibility displayed by rmMBP in an aqueous solution condition. A comparison between the order parameters for each condition reveals that rmMBP is highly dependent on its environment for the stabilization of secondary (and by extension, tertiary) structure. These conditions also indicate where and when the approximations used to derive Eqs. 5–7 may break down when these analyses are applied to IDPs.
FIGURE 6.

The MODELFREE-derived order parameters (S2 and Rex) for 15N-rmMBP dissolved in 30% TFE-d2 (panels A and C), and 100 mM KCl (panels B and D) at 300 K. The order parameters were determined using the globally optimized correlation times of 6.74 ± 0.09 ns (30% TFE-d2, panels A and C), and 1.26 ± 0.01 ns (100 mM KCl, panels B and D), from a Lipari-Szabo model-free analysis (76,77), with the extension of Clore et al. (78), as described in the online MODELFREE manual (80). Errors were determined on the basis of 500 Monte Carlo simulations of Brent's implementation of Powell's method for multidimensional minimization (79,80). Complete values for each residue are provided for both conditions in Data S1, Tables S2 and S3.
Interactions of 18.5 kDa MBP with Ca2+-calmodulin—background and rationale
The 18.5 kDa isoform of MBP has previously been demonstrated to interact with CaM in a Ca2+-dependent manner using a variety of techniques including intrinsic single Trp fluorescence spectroscopy (9,104,105), chemical cross-linking and gel-shift assays (106), and dynamic light scattering (9). The in vitro interaction was shown to be specific (i.e., Ca2+-dependent), and occur at a 1:1 MBP/CaM ratio under near physiological conditions (250 mM NaCl, 50 mM Tris, pH 7.4, 10 mM CaCl2) with a dissociation constant of 144 ± 76 nM (9). Subsequent proteomics analyses have revealed MBP to be one of many calmodulin-binding proteins in the brain (107,108), and MBP has recently been shown to function as an adaptor protein linking calmodulin to the BKCa channel (11).
Our first prediction for the CaM-target was of a C-terminal segment on rmMBP (K132-R167), which was consistent with the experimental data (105,106). However, a C-terminal deletion mutant lacking this region also bound CaM specifically (104,109), and deiminated MBP (a reduced charge variant containing citrulline) bound CaM in a manner suggestive of a second binding site (9). We postulated that this putative second CaM-target could be the central immunodominant epitope (P82-P93) (53,54,86). Subsequent studies by us using SDSL/EPR showed that spin labels at all sites on 18.5 kDa rmMBP (i.e., multiple reporter sites compared to the single tryptophanyl residue) were immobilized upon the protein's association with CaM (10). We complemented these experimental studies by molecular modeling, using various peptide fragments of MBP (murine residues R41-R52, P82-P93, T147-D158), constructed in silico and modeled as α-helices, and a collapsed form of CaM with both lobes clamping around the target. We observed from the docking simulations that the MBP peptides showed conformational variability and binding in various orientations, and that the balance of hydrophobic and electrostatic interactions determined the final binding mode. Moreover, the immunodominant epitope (P82-P93) was as plausible a CaM-target as the C-terminal segment (T147-D158) of mMBP, when modeled as an α-helix, but its interaction with CaM was energetically unfavorable when modeled as an extended strand (10). Thus, considering that there are at least two plausible CaM binding sites, NMR studies of the complex of CaM with full-length rmMBP were undertaken here with the goal of identifying definitively the primary CaM interaction site on MBP.
Uniformly-labeled 13C15N-rmMBP associated with unlabeled CaM was used to record a series of three-dimensional spectra (CBCA(CO)NH, CBCANH, and HCC(CO)NH) to use with conventional protein backbone assignment methods. Sample preparation is noteworthy for the rmMBP-CaM complex, since it was very difficult to prepare a concentrated (0.6–1.0 mM) protein sample containing a minimal amount of stabilizing ions (maximum 100 mM), while limiting precipitation. (As described above for the free protein, aggregation was considered to be negligible on the basis of previous studies (9) and the quality and reproducibility of the HSQC spectra.) Furthermore, the resulting rmMBP-CaM complex was ∼34 kDa, very close to the upper limit acceptable for solution NMR spectroscopy without employing specialized labeling techniques and pulse sequences (110). Thus, obtaining high-quality, usable NMR data from the rmMBP-CaM complex was extremely challenging and time-consuming. Titration of labeled rmMBP with unlabeled CaM to facilitate assignments and monitor conformational changes was thus not attempted, although such an experimental strategy is possible with smaller systems (e.g., CaM and a peptide target, (88,111–113)). In all experiments here, in an attempt to circumvent a situation where both bound and unbound conformers coexist, the unlabeled binding partner was introduced into the system in molar excess of the labeled binding partner, to force the system equilibrium into the predominantly bound state (compare to (112)).
Significant conformational changes of rmMBP upon association with CaM
The 1H-15N HSQC of 15N-labeled CaM interacting with unlabeled rmMBP is shown in Fig. 7; the 1H-15N HSQC of 15N-labeled rmMBP interacting with unlabeled CaM is shown in Fig. 8. The assignments of CaM (Fig. 7) are from previous work (114). Here, in addition, a total of 145 of the 164 expected HN-H correlations of rmMBP (Fig. 8) were assigned, and a further 20 Cα and Cβ resonances (176 and 152 expected, respectively) were identified from the CBCACONH and HCCCONH spectra; therefore, the backbone resonances of rmMBP bound to CaM were over 94% assigned.
FIGURE 7.

The 1H-15N HSQC spectra of uniformly 15N-labeled CaM (1.25 mM, black contours) and uniformly 15N-labeled CaM mixed with unlabeled rmMBP (0.64 mM CaM + 0.80 mM rmMBP, red contours). The resonance assignments shown are for unbound CaM and are from Ikura et al. (114); the labels shown correspond to the black (unbound) contours and indicate the secondary structure element (L = loop or H = α-helix) with which each residue is associated. Crosspeaks that have obvious assignments are shown connected with black lines. Both spectra were recorded on samples in 100 mM KCl, 8 mM CaCl2, pH 6.5, 10% D2O, 0.75 mg DSS at 300 K.
FIGURE 8.

The 1H-15N HSQC spectrum of uniformly 13C15N-labeled rmMBP bound with unlabeled CaM. The sample conditions were 100 mM KCl, 8 mM CaCl2, pH 6.5, 10% D2O at 300 K. The concentrations of the binding partners were 0.96 mM CaM and 0.78 mM 13C15N-rmMBP. A total of 145 of 164 expected backbone peaks are assigned for rmMBP (there are 11 prolyl residues); peaks S10, G55, G75, and S109 are assigned, but appear below the displayed contour levels.
The 15N-CaM and unlabeled rmMBP showed chemical shift perturbations of the CaM resonances that were similar to what has been previously observed for CaM interacting with a binding partner (Fig. 7) (e.g., (111)). In the 1H-15N HSQC of 15N-rmMBP and unlabeled CaM (Fig. 8), many of the perturbed peaks of rmMBP mapped themselves to bulky hydrophobic residues (F, Y, and L), which may indicate exclusion of bulk solvent from the hydrophobic face, and/or a specific interaction. These results are consistent with the SDSL/EPR data showing greatest immobilization of the spin label at sites closest to small hydrophobic clusters on rmMBP (10). Although IDPs bind targets with high specificity, often involving multiple electrostatic interactions, the unbound portion of the polypeptide chain often retains considerable plasticity; thus, multiple hydrophobic interactions could be expected (33,42,43,115).
Using 13C15N-rmMBP and unlabeled CaM, ∼40 rmMBP resonances were observed shifted upfield in the 1H dimension (7.0–8.2 ppm), and downfield in the 15N dimension (123–133 ppm), relative to unbound rmMBP (Fig. 1). There was no change to the conformation of rmMBP upon the inclusion of 8 mM CaCl2 to the rmMBP (sample 1, Materials and Methods), as judged by comparison of the peak positions of the pertinent HSQC spectra (results not shown). The 1H-15N HSQC spectrum (Fig. 8) of rmMBP bound with CaM displays an increase in the overall dispersion of the peaks, and may indicate a more ordered state for rmMBP under these conditions. Moreover, these data are consistent with our previous results using SDSL/EPR which indicated that the entire rmMBP protein was involved in some interaction with CaM (10). The same extreme chemical shift perturbations are not observed in the HSQC spectrum of CaM interacting with rmMBP (Fig. 7). Since there was a molar excess of rmMBP to force the equilibrium toward the bound state, we interpret this result to indicate that the structural perturbation of CaM is not as great as for rmMBP (Fig. 8) upon their association. The binding of CaM to rmMBP is Ca2+-dependent, and here CaM is initially folded; but in the (open) halo-form, both the N- and C-terminal lobes of CaM appear to associate with rmMBP (Fig. 7), which is the most common mode of CaM binding. From these results, however, it is unclear whether CaM remains in its open form.
Identification of a C-terminal CaM-binding site on rmMBP
The C-terminal region of rmMBP (comprising roughly residues P120-R160) coincides with a cluster of highly perturbed HN-N chemical shifts (Fig. 9). The combined weighted average chemical shift deviations for the HN and N shifts from random coil values for rmMBP alone at 277 K, alone at 300 K, and bound to CaM at 300 K, are shown, respectively, in Fig. 9, A–C. There is very little difference due to temperature on the observed HN and N shifts of rmMBP alone (Fig. 9 D), but the addition of CaM has a large effect on these shifts (Fig. 9 E). This effect is also evident from the comparison of the HSQCs of unbound (Fig. 1) and CaM-bound (Fig. 8) rmMBP. Although the large HN-N chemical shift deviations occur throughout the entire polypeptide chain, they are clustered in the C-terminal region. Furthermore, three glycyl residues (G155, G156, and G162) and a threonyl residue (T147) in this region have abnormally large HN and N shift perturbations upon interaction with CaM (Fig. 8). Collectively, these observations are consistent with the premise that the C-terminus of posttranslationally unmodified 18.5 kDa rmMBP is the primary interaction site with CaM, as we have previously posited (9,104–106).
FIGURE 9.

Chemical shift perturbation (CSP) plot of the weighted average of the HN and N chemical shift deviations from random coil values. (A) rmMBP alone at 277 K; (B) rmMBP alone at 300 K; (C) rmMBP bound with CaM at 300 K; (D) difference between the CSP of rmMBP at 277 K and rmMBP recorded at 300 K; and (E) difference between the CSP of rmMBP at 277 K and rmMBP bound to CaM recorded at 300 K. The solute for all experiments was 100 mM KCl, pH 6.5, 10% D2O, with 8 mM CaCl2 added to the CaM-containing samples. The weighted average of a specific residue was calculated as  (129).
Local conformational changes in rmMBP upon CaM-binding
Recently, the hypothesis of coupled binding and folding has been explicitly stated for CaM and binding targets on IDPs (116). We now address the question of whether MBP gains ordered structure upon association with CaM. First of all, although the amphipathic α-helix represents the well-studied, canonical CaM-target, it has become recognized that CaM-binding sites and modes of interaction are quite diverse (e.g., (117–120)). There is no strict requirement for the chemical shift perturbations observed in the 1H-15N HSQC to be indicative of an α-helix, and the perturbations observed here (Fig. 8) may be representative of a different type of disorder-to-order transition characteristic of IDP binding (42).
Further evidence for this conjecture is based on SSP scores of rmMBP, calculated using only the Cα and Cβ chemical shifts, alone in 100 mM KCl at 277K (Fig. 10 A), and in association with CaM (Fig. 10 B). (The SSP scores presented in Fig. 3 were derived from the Cα, Cβ, and Hα chemical shifts, in contrast.) The SSP scores calculated from the Cα and Cβ chemical shifts for rmMBP in 100 mM KCl at 277K (Fig. 10 A) show several regions of general order that correspond with the PONDR predictions (Fig. 3 E), although none of them could be categorized as a fully formed secondary structure element. This observation is consistent with the nature of IDP ensembles under nonstabilizing conditions. As a side note, the segments that show negative secondary structure propensities in Fig. 10 A (H24-D36, and R41-K56) are probably not β-strands, but rather polyproline type II helices (99), which have been demonstrated to be a common structural element of IDPs (see (12,121), and references therein). These two secondary structure types are indistinguishable based on chemical shift analysis alone, and other parameters such as coupling constants are required for their distinction (98,122,123). The existence of polyproline type II helices in MBP in these preparations is further supported by the fact that circular dichroism spectroscopy has shown minimal β-strand structure in 18.5 kDa MBP under similar conditions (124).
FIGURE 10.

Comparison of the secondary structure propensity (SSP) of (A) rmMBP alone at 277 K, and (B) rmMBP bound with CaM at 300 K. Both samples were dissolved in 100 mM KCl, pH 6.5, 10% D2O, and 8 mM CaCl2 was included with the CaM-containing sample. For both conditions, the SSP was calculated on the basis of the Cα and Cβ shifts (in contrast to Fig. 3). The shifts were re-referenced as described by Marsh et al. (68) before the calculation of the SSP scores. The SSP score is interpreted as the percentage of conformers in the disordered ensemble that exhibit ordered secondary structure at a given residue (68).
The SSP scores for rmMBP bound to CaM at 300 K are shown in Fig. 10 B. Chemical shifts in the N-terminal third of rmMBP show a pattern of order similar to that of unbound rmMBP. The central immunodominant epitope (P82-P93) seems to be destabilized in the CaM-bound form of rmMBP relative to the free form, similar to what was observed in the relaxation measurements in 100 mM KCl (Fig. 4). Our previous molecular docking simulations indicated that an extended local conformation of this epitope would be unfavorable for CaM-binding (10). Our current data show that this central segment would not be a preferred CaM target for this highly-charged form of 18.5 kDa rmMBP (9,104). Furthermore, the C-terminal region shows a redistribution of the stabilized region, albeit within the PONDR-predicted ordered region. This observation suggests that the stabilization is coming from a different source (i.e., CaM) instead of the solvent or intrachain interactions. The residues from A144-S159 show a slightly increased propensity to form α-helical structure in the CaM-bound rmMBP, compared to the unbound form.
If the CaM remains in an open conformation upon association with MBP (Fig. 7), then the interaction would appear to be noncanonical (119). As reviewed in the Introduction, transient α-helices in IDPs are a common recognition motif for other proteins, and the MoRF hypothesis is an attractive one (45,46), especially as the C-terminus of rmMBP (residues T142-L154) has a propensity toward α-helicity (Figs. 3 and 10 B). However, we cannot conclude unequivocally that this secondary structure type is present in the CaM-associated form. There are other CaM-binding proteins that appear to have an extended conformation of binding site when complexed with CaM, e.g., myristoylated alanine-rich C kinase substrate (MARCKS) and MARCKS-related peptides, and caldesmon (117,119,125). Moreover, there are other examples of IDP-protein binding without a substantial increase in ordered structure in the IDP (126,127), and further studies are required. Collectively, our observations are consistent with the premise that the C-terminus of posttranslationally unmodified 18.5 kDa rmMBP is the primary (preferred) interaction site with CaM, as previously posited (9,104–106), but we cannot rule out the possibility that it may be a noncanonical (non-α-helical) target.
Interactions of 18.5 kDa MBP with Ca2+-calmodulin—significance and future studies
Recently, Kim et al. (11) reported that MBP acts as an adaptor, linking CaM with the BKCa channel, which suggests that MBP possesses multiple, specific interaction sites. Every isoform of MBP can and does adopt multiple unique conformations based on the local environment, and combinatorial posttranslational modifications could themselves induce or stabilize protein-binding targets (12,40,44,128). Overall, the results presented here demonstrate the polymorphic nature of MBP as an IDP, and further our understanding of the multifunctional nature of this protein (42,43). Specifically, our previous molecular modeling studies of MBP-derived peptides and CaM indicated relatively minor effects on docked energy of posttranslational modifications on the MBP target (10). However, the assumption in those in silico docking studies was that the MBP-derived peptide was α-helical, and the CaM was modeled in fully collapsed form. If the recognition site on MBP is noncanonical (10,119), and if the CaM remains in open form, as both are suggested by the current data, then the mode of MBP-CaM binding may be significantly influenced by phosphorylation or deimination events in the target region and beyond (7,116). The current data support the conjecture that rmMBP interacts with CaM primarily through an interaction of the C-terminal residues A144-S159, but are not sufficient to probe the atomic details of this binding. Thus, future studies (e.g., 15N-13C edited NOE spectroscopy experiments) will be necessary to delineate further the details of CaM-binding to MBP.
CONCLUSIONS
Conformational adaptability is an important property of intrinsically disordered proteins, and underscores the importance of comparative structural studies of members of this class of proteins. In aqueous solution, the classic 18.5 kDa isoform of MBP is primarily disordered, but has transient α-helices that are stabilized by membrane-mimetic conditions. Here, solution NMR spectroscopy (chemical shift index analysis, secondary structure propensity, and relaxation measurements) have been used to define three major segments of MBP (T33-D46, V83-T92, T142-L154) that form transient α-helices that could be stabilized by protein- or lipid-binding, and that match bioinformatics predictions of increased order. One of these segments (V83-T92) represents an important membrane contact point and serves as a functional immunodominant epitope in the human neurodegenerative disease multiple sclerosis. Another segment (T142-L154) has been identified as the primary calmodulin-binding site, although perhaps through a noncanonical mode of recognition.
SUPPLEMENTARY MATERIAL
To view all of the supplemental files associated with this article, visit www.biophysj.org.
Supplementary Material
Acknowledgments
The authors are grateful to Dr. Mitsu Ikura (Ontario Cancer Institute, Toronto) for the gift of the plasmid for recombinant Xenopus laevis CaM, Dr. Vladimir Bamm and Ms. Anna Stronks for assistance with protein purification, and to Ms. Valerie Robertson (Guelph NMR Center), Dr. Martine Monette (Bruker BioSpin Canada), and Mr. Mumdooh Ahmed and Dr. Vladimir Ladizhansky (Physics, Guelph) for many helpful discussions, advice, and support.
This work was supported by the Canadian Institutes of Health Research (operating grant No. MOP 74468), and the Natural Sciences and Engineering Research Council of Canada (operating grant No. RG121541). D.S.L. was the recipient of an Ontario Graduate Scholarship. The University of Guelph NMR Centre benefited from funding by the Canada Foundation for Innovation, and the Ontario Innovation Trust.
Editor: Kathleen B. Hall.
References
- 1.Pribyl, T. M., C. W. Campagnoni, K. Kampf, T. Kashima, V. W. Handley, J. McMahon, and A. T. Campagnoni. 1993. The human myelin basic protein gene is included within a 179-kilobase transcription unit: expression in the immune and central nervous systems. Proc. Natl. Acad. Sci. USA. 90:10695–10699. [DOI] [PMC free article] [PubMed] [Google Scholar]
- 2.Campagnoni, A. T., T. M. Pribyl, C. W. Campagnoni, K. Kampf, S. Amur-Umarjee, C. F. Landry, V. W. Handley, S. L. Newman, B. Garbay, and K. Kitamura. 1993. Structure and developmental regulation of Golli-mbp, a 105-kilobase gene that encompasses the myelin basic protein gene and is expressed in cells in the oligodendrocyte lineage in the brain. J. Biol. Chem. 268:4930–4938. [PubMed] [Google Scholar]
- 3.Boggs, J. M. 2006. Myelin basic protein: a multifunctional protein. Cell. Mol. Life Sci. 63:1945–1961. [DOI] [PMC free article] [PubMed] [Google Scholar]
- 4.Dyer, C. A. 1997. Myelin proteins as mediators of signal transduction. In Cell Biology and Pathology of Myelin: Evolving Biological Concepts and Therapeutic Approaches. B. H. J. Juurlink, R. M. Devon, J. R. Doucette, A. J. Nazarali, D. J. Schreyer, and V. M. K. Verge, editors. Plenum Press, New York.
- 5.Givogri, M. I., E. R. Bongarzone, and A. T. Campagnoni. 2000. New insights on the biology of myelin basic protein gene: the neural-immune connection. J. Neurosci. Res. 59:153–159. [PubMed] [Google Scholar]
- 6.Campagnoni, A. T., and R. P. Skoff. 2001. The pathobiology of myelin mutants reveals novel biological functions of the MBP and PLP genes. Brain Pathol. 11:74–91. [DOI] [PMC free article] [PubMed] [Google Scholar]
- 7.Harauz, G., N. Ishiyama, C. M. D. Hill, I. R. Bates, D. S. Libich, and C. Farès. 2004. Myelin basic protein-diverse conformational states of an intrinsically unstructured protein and its roles in myelin assembly and multiple sclerosis. Micron. 35:503–542. [DOI] [PubMed] [Google Scholar]
- 8.Kim, J. K., F. G. Mastronardi, D. D. Wood, D. M. Lubman, R. Zand, and M. A. Moscarello. 2003. Multiple sclerosis: an important role for post-translational modifications of myelin basic protein in pathogenesis. Mol. Cell. Proteomics. 2:453–462. [DOI] [PubMed] [Google Scholar]
- 9.Libich, D. S., C. M. D. Hill, I. R. Bates, F. R. Hallett, S. Armstrong, A. Siemiarczuk, and G. Harauz. 2003. Interaction of the 18.5-kDa isoform of myelin basic protein with Ca2+-calmodulin: effects of deimination assessed by Trp fluorescence spectroscopy, dynamic light scattering, and circular dichroism. Protein Sci. 12:1507–1521. [DOI] [PMC free article] [PubMed] [Google Scholar]
- 10.Polverini, E., J. M. Boggs, I. R. Bates, G. Harauz, and P. Cavatorta. 2004. Electron paramagnetic resonance spectroscopy and molecular modeling of the interaction of myelin basic protein (MBP) with calmodulin (CaM)-diversity and conformational adaptability of MBP CaM-targets. J. Struct. Biol. 148:353–369. [DOI] [PubMed] [Google Scholar]
- 11.Kim, H., S. Jo, H. J. Song, Z. Y. Park, and C. S. Park. 2007. Myelin basic protein as a binding partner and calmodulin adaptor for the BK(Ca) channel. Proteomics. 7:2591–2602. [DOI] [PubMed] [Google Scholar]
- 12.Polverini, E., G. Rangaraj, D. S. Libich, J. M. Boggs, and G. Harauz. 2008. Binding of the proline-rich segment of myelin basic protein to SH3-domains—spectroscopic, microarray, and modeling studies of ligand conformation and effects of post-translational modifications. Biochemistry. 47:267–282. [DOI] [PubMed] [Google Scholar]
- 13.Hill, C. M. D., and G. Harauz. 2005. Charge effects modulate actin assembly by classic myelin basic protein isoforms. Biochem. Biophys. Res. Commun. 329:362–369. [DOI] [PubMed] [Google Scholar]
- 14.Hill, C. M. D., D. S. Libich, and G. Harauz. 2005. Assembly of tubulin by classic myelin basic protein isoforms and regulation by post-translational modification. Biochemistry. 44:16672–16683. [DOI] [PubMed] [Google Scholar]
- 15.Boggs, J. M., G. Rangaraj, C. M. D. Hill, I. R. Bates, Y. M. Heng, and G. Harauz. 2005. Effect of arginine loss in myelin basic protein, as occurs in its deiminated charge isoform, on mediation of actin polymerization and actin binding to a lipid membrane in vitro. Biochemistry. 44:3524–3534. [DOI] [PubMed] [Google Scholar]
- 16.Boggs, J. M., G. Rangaraj, W. Gao, and Y. M. Heng. 2006. Effect of phosphorylation of myelin basic protein by MAPK on its interactions with actin and actin binding to a lipid membrane in vitro. Biochemistry. 45:391–401. [DOI] [PubMed] [Google Scholar]
- 17.Galiano, M. R., A. Andrieux, J. C. Deloulme, C. Bosc, A. Schweitzer, D. Job, and M. E. Hallak. 2006. Myelin basic protein functions as a microtubule stabilizing protein in differentiated oligodendrocytes. J. Neurosci. Res. 84:534–541. [DOI] [PubMed] [Google Scholar]
- 18.Mastronardi, F. G., and M. A. Moscarello. 2005. Molecules affecting myelin stability: a novel hypothesis regarding the pathogenesis of multiple sclerosis. J. Neurosci. Res. 80:301–308. [DOI] [PubMed] [Google Scholar]
- 19.Harauz, G., and A. A. Musse. 2007. A tale of two citrullines—structural and functional aspects of myelin basic protein deimination in health and disease. Neurochem. Res. 32:137–158. [DOI] [PubMed] [Google Scholar]
- 20.Musse, A. A., and G. Harauz. 2007. Molecular “negativity” may underlie multiple sclerosis: role of the myelin basic protein family in the pathogenesis of MS. Int. Rev. Neurobiol. 79:149–172. [DOI] [PubMed] [Google Scholar]
- 21.Moscarello, M. A., F. G. Mastronardi, and D. D. Wood. 2007. The role of citrullinated proteins suggests a novel mechanism in the pathogenesis of multiple sclerosis. Neurochem. Res. 32:251–256. [DOI] [PMC free article] [PubMed] [Google Scholar]
- 22.Uversky, V. N., J. R. Gillespie, and A. L. Fink. 2000. Why are “natively unfolded” proteins unstructured under physiologic conditions? Proteins. 41:415–427. [DOI] [PubMed] [Google Scholar]
- 23.Dunker, A. K., C. J. Brown, J. D. Lawson, L. M. Iakoucheva, and Z. Obradovic. 2002. Intrinsic disorder and protein function. Biochemistry. 41:6573–6582. [DOI] [PubMed] [Google Scholar]
- 24.Dyson, H. J., and P. E. Wright. 2006. According to current textbooks, a well-defined three-dimensional structure is a prerequisite for the function of a protein. Is this correct? IUBMB Life. 58:107–109. [DOI] [PubMed] [Google Scholar]
- 25.Xie, H., S. Vucetic, L. M. Iakoucheva, C. J. Oldfield, A. K. Dunker, V. N. Uversky, and Z. Obradovic. 2007. Functional anthology of intrinsic disorder. 1. Biological processes and functions of proteins with long disordered regions. J. Proteome Res. 6:1882–1898. [DOI] [PMC free article] [PubMed] [Google Scholar]
- 26.Vucetic, S., H. Xie, L. M. Iakoucheva, C. J. Oldfield, A. K. Dunker, Z. Obradovic, and V. N. Uversky. 2007. Functional anthology of intrinsic disorder. 2. Cellular components, domains, technical terms, developmental processes, and coding sequence diversities correlated with long disordered regions. J. Proteome Res. 6:1899–1916. [DOI] [PMC free article] [PubMed] [Google Scholar]
- 27.Xie, H., S. Vucetic, L. M. Iakoucheva, C. J. Oldfield, A. K. Dunker, Z. Obradovic, and V. N. Uversky. 2007. Functional anthology of intrinsic disorder. 3. Ligands, post-translational modifications, and diseases associated with intrinsically disordered proteins. J. Proteome Res. 6:1917–1932. [DOI] [PMC free article] [PubMed] [Google Scholar]
- 28.Uversky, V. N., C. J. Oldfield, and A. K. Dunker. 2005. Showing your ID: intrinsic disorder as an ID for recognition, regulation and cell signaling. J. Mol. Recognit. 18:343–384. [DOI] [PubMed] [Google Scholar]
- 29.Dosztanyi, Z., J. Chen, A. K. Dunker, I. Simon, and P. Tompa. 2006. Disorder and sequence repeats in hub proteins and their implications for network evolution. J. Proteome Res. 5:2985–2995. [DOI] [PubMed] [Google Scholar]
- 30.Patil, A., and H. Nakamura. 2006. Disordered domains and high surface charge confer hubs with the ability to interact with multiple proteins in interaction networks. FEBS Lett. 580:2041–2045. [DOI] [PubMed] [Google Scholar]
- 31.Bhalla, J., G. B. Storchan, C. M. MacCarthy, V. N. Uversky, and O. Tcherkasskaya. 2006. Local flexibility in molecular function paradigm. Mol. Cell. Proteomics. 5:1212–1223. [DOI] [PubMed] [Google Scholar]
- 32.Dyson, H. J., and P. E. Wright. 2002. Coupling of folding and binding for unstructured proteins. Curr. Opin. Struct. Biol. 12:54–60. [DOI] [PubMed] [Google Scholar]
- 33.Fuxreiter, M., I. Simon, P. Friedrich, and P. Tompa. 2004. Preformed structural elements feature in partner recognition by intrinsically unstructured proteins. J. Mol. Biol. 338:1015–1026. [DOI] [PubMed] [Google Scholar]
- 34.Chi, S. W., S. H. Lee, D. H. Kim, M. J. Ahn, J. S. Kim, J. Y. Woo, T. Torizawa, M. Kainosho, and K. H. Han. 2005. Structural details on mdm2-p53 interaction. J. Biol. Chem. 280:38795–38802. [DOI] [PubMed] [Google Scholar]
- 35.Eliezer, D., P. Barre, M. Kobaslija, D. Chan, X. Li, and L. Heend. 2005. Residual structure in the repeat domain of tau: echoes of microtubule binding and paired helical filament formation. Biochemistry. 44:1026–1036. [DOI] [PubMed] [Google Scholar]
- 36.Oldfield, C. J., Y. Cheng, M. S. Cortese, P. Romero, V. N. Uversky, and A. K. Dunker. 2005. Coupled folding and binding with α-helix-forming molecular recognition elements. Biochemistry. 44:12454–12470. [DOI] [PubMed] [Google Scholar]
- 37.Tompa, P., C. Szasz, and L. Buday. 2005. Structural disorder throws new light on moonlighting. Trends Biochem. Sci. 30:484–489. [DOI] [PubMed] [Google Scholar]
- 38.Tompa, P. 2005. The interplay between structure and function in intrinsically unstructured proteins. FEBS Lett. 579:3346–3354. [DOI] [PubMed] [Google Scholar]
- 39.Vise, P. D., B. Baral, A. J. Latos, and G. W. Daughdrill. 2005. NMR chemical shift and relaxation measurements provide evidence for the coupled folding and binding of the p53 transactivation domain. Nucleic Acids Res. 33:2061–2077. [DOI] [PMC free article] [PubMed] [Google Scholar]
- 40.Solt, I., C. Magyar, I. Simon, P. Tompa, and M. Fuxreiter. 2006. Phosphorylation-induced transient intrinsic structure in the kinase-inducible domain of CREB facilitates its recognition by the KIX domain of CBP. Proteins. 64:749–757. [DOI] [PubMed] [Google Scholar]
- 41.Sugase, K., H. J. Dyson, and P. E. Wright. 2007. Mechanism of coupled folding and binding of an intrinsically disordered protein. Nature. 447:1021–1025. [DOI] [PubMed] [Google Scholar]
- 42.Fuxreiter, M., P. Tompa, and I. Simon. 2007. Local structural disorder imparts plasticity on linear motifs. Bioinformatics. 23:950–956. [DOI] [PubMed] [Google Scholar]
- 43.Mészáros, B., P. Tompa, I. Simon, and Z. Dosztányi. 2007. Molecular principles of the interactions of disordered proteins. J. Mol. Biol. 372:549–561. [DOI] [PubMed] [Google Scholar]
- 44.Baker, J. M., R. P. Hudson, V. Kanelis, W. Y. Choy, P. H. Thibodeau, P. J. Thomas, and J. D. Forman-Kay. 2007. CFTR regulatory region interacts with NBD1 predominantly via multiple transient helices. Nat. Struct. Mol. Biol. 14:738–745. [DOI] [PMC free article] [PubMed] [Google Scholar]
- 45.Vacic, V., C. J. Oldfield, A. Mohan, P. Radivojac, M. S. Cortese, V. N. Uversky, and A. K. Dunker. 2007. Characterization of molecular recognition features, MoRFs, and their binding partners. J. Proteome Res. 6:2351–2366. [DOI] [PMC free article] [PubMed] [Google Scholar]
- 46.Mohan, A., C. J. Oldfield, P. Radivojac, V. Vacic, M. S. Cortese, A. K. Dunker, and V. N. Uversky. 2006. Analysis of molecular recognition features (MoRFs). J. Mol. Biol. 362:1043–1059. [DOI] [PubMed] [Google Scholar]
- 47.Dyson, H. J., and P. E. Wright. 2001. Nuclear magnetic resonance methods for elucidation of structure and dynamics in disordered states. Methods Enzymol. 339:258–270. [DOI] [PubMed] [Google Scholar]
- 48.Dyson, H. J., and P. E. Wright. 2004. Unfolded proteins and protein folding studied by NMR. Chem. Rev. 104:3607–3622. [DOI] [PubMed] [Google Scholar]
- 49.Dyson, H. J., and P. E. Wright. 2005. Elucidation of the protein folding landscape by NMR. Methods Enzymol. 394:299–321. [DOI] [PubMed] [Google Scholar]
- 50.Receveur-Bréchot, V., J. M. Bourhis, V. N. Uversky, B. Canard, and S. Longhi. 2006. Assessing protein disorder and induced folding. Proteins. 62:24–45. [DOI] [PubMed] [Google Scholar]
- 51.Radivojac, P., L. M. Iakoucheva, C. J. Oldfield, Z. Obradovic, V. N. Uversky, and A. K. Dunker. 2007. Intrinsic disorder and functional proteomics. Biophys. J. 92:1439–1456. [DOI] [PMC free article] [PubMed] [Google Scholar]
- 52.Mittag, T., and J. D. Forman-Kay. 2007. Atomic-level characterization of disordered protein ensembles. Curr. Opin. Struct. Biol. 17:3–14. [DOI] [PubMed] [Google Scholar]
- 53.Farès, C., D. S. Libich, and G. Harauz. 2006. Solution NMR structure of an immunodominant epitope of myelin basic protein. Conformational dependence on environment of an intrinsically unstructured protein. FEBS J. 273:601–614. [DOI] [PubMed] [Google Scholar]
- 54.Bates, I. R., J. B. Feix, J. M. Boggs, and G. Harauz. 2004. An immunodominant epitope of myelin basic protein is an amphipathic α-helix. J. Biol. Chem. 279:5757–5764. [DOI] [PubMed] [Google Scholar]
- 55.Libich, D. S., V. J. Robertson, M. M. Monette, and G. Harauz. 2004. Backbone resonance assignments of the 18.5 kDa isoform of murine myelin basic protein (MBP). J. Biomol. NMR. 29:545–546. [DOI] [PubMed] [Google Scholar]
- 56.Libich, D. S., M. M. Monette, V. J. Robertson, and G. Harauz. 2007. NMR assignment of an intrinsically disordered protein under physiological conditions: the 18.5 kDa isoform of myelin basic protein. Biomol. NMR Assign. 1:61–63. [DOI] [PubMed] [Google Scholar]
- 57.Spera, S., and A. Bax. 1991. Empirical correlation between protein backbone conformation and C-α and C-β C-13 nuclear magnetic resonance chemical shifts. J. Am. Chem. Soc. 113:5490–5492. [Google Scholar]
- 58.Wishart, D. S., and B. D. Sykes. 1994. Chemical shifts as a tool for structure determination. Methods Enzymol. 239:363–392. [DOI] [PubMed] [Google Scholar]
- 59.Wishart, D. S., and A. M. Nip. 1998. Protein chemical shift analysis: a practical guide. Biochem. Cell Biol. 76:153–163. [DOI] [PubMed] [Google Scholar]
- 60.Lipari, G., A. Szabo, and R. M. Levy. 1982. Protein dynamics and NMR relaxation—comparison of simulations with experiment. Nature. 300:197–198. [Google Scholar]
- 61.Shojania, S., and J. D. O'Neil. 2006. HIV-1 Tat is a natively unfolded protein: the solution conformation and dynamics of reduced HIV-1 Tat-(1–72) by NMR spectroscopy. J. Biol. Chem. 281:8347–8356. [DOI] [PubMed] [Google Scholar]
- 62.Bates, I. R., D. S. Libich, D. D. Wood, M. A. Moscarello, and G. Harauz. 2002. An Arg/Lys → Gln mutant of recombinant murine myelin basic protein as a mimic of the deiminated form implicated in multiple sclerosis. Protein Expr. Purif. 25:330–341. [DOI] [PubMed] [Google Scholar]
- 63.Ikura, M., S. Spera, G. Barbato, L. E. Kay, M. Krinks, and A. Bax. 1991. Secondary structure and side-chain 1H and 13C resonance assignments of calmodulin in solution by heteronuclear multidimensional NMR spectroscopy. Biochemistry. 30:9216–9228. [DOI] [PubMed] [Google Scholar]
- 64.Ahmed, M. A., V. V. Bamm, G. Harauz, and V. Ladizhansky. 2007. The BG21 isoform of Golli myelin basic protein is intrinsically disordered with a highly flexible amino-terminal domain. Biochemistry. 46:9700–9712. [DOI] [PubMed] [Google Scholar]
- 65.Wang, Y., and O. Jardetzky. 2002. Probability-based protein secondary structure identification using combined NMR chemical-shift data. Protein Sci. 11:852–861. [DOI] [PMC free article] [PubMed] [Google Scholar]
- 66.Schwarzinger, S., G. J. Kroon, T. R. Foss, J. Chung, P. E. Wright, and H. J. Dyson. 2001. Sequence-dependent correction of random coil NMR chemical shifts. J. Am. Chem. Soc. 123:2970–2978. [DOI] [PubMed] [Google Scholar]
- 67.Keller, R. 2007. The Computer-Aided Resonance Assignment Tutorial. Cantina-Verlag, Goldau, Switzerland.
- 68.Marsh, J. A., V. K. Singh, Z. Jia, and J. D. Forman-Kay. 2006. Sensitivity of secondary structure propensities to sequence differences between α- and γ-synuclein: implications for fibrillation. Protein Sci. 15:2795–2804. [DOI] [PMC free article] [PubMed] [Google Scholar]
- 69.Palmer, A. G., N. J. Skelton, W. J. Chazin, P. E. Wright, and M. Rance. 1992. Suppression of the effects of cross-correlation between dipolar and anisotropic chemical-shift relaxation mechanisms in the measurement of spin-spin relaxation rates. Mol. Phys. 75:699–711. [Google Scholar]
- 70.Kay, L. E., D. A. Torchia, and A. Bax. 1989. Backbone dynamics of proteins as studied by 15N inverse detected heteronuclear NMR spectroscopy: application to staphylococcal nuclease. Biochemistry. 28:8972–8979. [DOI] [PubMed] [Google Scholar]
- 71.Boyd, J., U. Hommel, and I. D. Campbell. 1990. Influence of cross-correlation between dipolar and anisotropic chemical shift relaxation mechanisms upon longitudinal relaxation rates of 15N in macromolecules. Chem. Phys. Lett. 175:477–482. [Google Scholar]
- 72.Meiboom, S., and D. Gill. 1958. Modified spin-echo for measuring nuclear relaxation times. Rev. Sci. Instrum. 29:688–691. [Google Scholar]
- 73.Abragam, A. 1961. Principles of Nuclear Magnetism. Clarendon Press, Oxford.
- 74.Cavanagh, J., W. J. Fairbrother, A. G. Palmer, and N. J. Skelton. 1996. Protein NMR Spectroscopy. Principles and Practice. Academic Press (Elsevier Science), San Diego, CA.
- 75.Farrow, N. A., O. Zhang, A. Szabo, D. A. Torchia, and L. E. Kay. 1995. Spectral density function mapping using 15N relaxation data exclusively. J. Biomol. NMR. 6:153–162. [DOI] [PubMed] [Google Scholar]
- 76.Lipari, G., and A. Szabo. 1982. Model-free approach to the interpretation of nuclear magnetic resonance relaxation in macromolecules. 1. Theory and range of validity. J. Am. Chem. Soc. 104:4546–4559. [Google Scholar]
- 77.Lipari, G., and A. Szabo. 1982. Model-free approach to the interpretation of nuclear magnetic resonance relaxation in macromolecules. 2. Analysis of experimental results. J. Am. Chem. Soc. 104:4559–4570. [Google Scholar]
- 78.Clore, G. M., A. Szabo, A. Bax, L. E. Kay, P. C. Driscoll, and A. M. Gronenborn. 1990. Deviations from the simple 2-parameter model-free approach to the interpretation of N-15 nuclear magnetic relaxation of proteins. J. Am. Chem. Soc. 112:4989–4991. [Google Scholar]
- 79.Mandel, A. M., M. Akke, and A. G. Palmer III. 1995. Backbone dynamics of Escherichia coli ribonuclease HI: correlations with structure and function in an active enzyme. J. Mol. Biol. 246:144–163. [DOI] [PubMed] [Google Scholar]
- 80.Palmer, A. G. 2007. Modelfree Manual. http://cpmcnet.columbia.edu/dept/gsas/biochem/labs/palmer/software/modelfree_manual.pdf.
- 81.Sattler, M., J. Schleucher, and C. Griesinger. 1999. Heteronuclear multidimensional NMR experiments for the structure determination of proteins in solution employing pulsed field gradients. Prog. Nucl. Magn. Reson. Spectrosc. 34:93–158. [Google Scholar]
- 82.Markley, J. L., A. Bax, Y. Arata, C. W. Hilbers, R. Kaptein, B. D. Sykes, P. E. Wright, and K. Wüthrich. 1998. Recommendations for the presentation of NMR structures of proteins and nucleic acids—IUPAC-IUBMB-IUPAB Inter-Union Task Group on the standardization of data bases of protein and nucleic acid structures determined by NMR spectroscopy. Eur. J. Biochem. 256:1–15. [DOI] [PubMed] [Google Scholar]
- 83.Buck, M. 1998. Trifluoroethanol and colleagues: cosolvents come of age. Recent studies with peptides and proteins. Q. Rev. Biophys. 31:297–355. [DOI] [PubMed] [Google Scholar]
- 84.Roccatano, D., G. Colombo, M. Fioroni, and A. E. Mark. 2002. Mechanism by which 2,2,2-trifluoroethanol/water mixtures stabilize secondary-structure formation in peptides: a molecular dynamics study. Proc. Natl. Acad. Sci. USA. 99:12179–12184. [DOI] [PMC free article] [PubMed] [Google Scholar]
- 85.Povey, J. F., C. M. Smales, S. J. Hassard, and M. J. Howard. 2007. Comparison of the effects of 2,2,2-trifluoroethanol on peptide and protein structure and function. J. Struct. Biol. 157:329–338. [DOI] [PubMed] [Google Scholar]
- 86.Musse, A. A., J. M. Boggs, and G. Harauz. 2006. Deimination of membrane-bound myelin basic protein in multiple sclerosis exposes an immunodominant epitope. Proc. Natl. Acad. Sci. USA. 103:4422–4427. [DOI] [PMC free article] [PubMed] [Google Scholar]
- 87.Otzen, D. E., P. Sehgal, and L. W. Nesgaard. 2007. Alternative membrane protein conformations in alcohols. Biochemistry. 46:4348–4359. [DOI] [PubMed] [Google Scholar]
- 88.Ikura, M., G. M. Clore, A. M. Gronenborn, G. Zhu, C. B. Klee, and A. Bax. 1992. Solution structure of a calmodulin-target peptide complex by multidimensional NMR. Science. 256:632–638. [DOI] [PubMed] [Google Scholar]
- 89.Jo, E., and J. M. Boggs. 1995. Aggregation of acidic lipid vesicles by myelin basic protein: dependence on potassium concentration. Biochemistry. 34:13705–13716. [DOI] [PubMed] [Google Scholar]
- 90.Zhong, L., V. V. Bamm, M. A. Ahmed, G. Harauz, and V. Ladizhansky. 2007. Solid-state NMR spectroscopy of 18.5 kDa myelin basic protein reconstituted with lipid vesicles: spectroscopic characterization and spectral assignments of solvent-exposed protein fragments. Biochim. Biophys. Acta (Biomembr.). 1768:3193–3205. [DOI] [PMC free article] [PubMed] [Google Scholar]
- 91.Bates, I. R., J. M. Boggs, J. B. Feix, and G. Harauz. 2003. Membrane-anchoring and charge effects in the interaction of myelin basic protein (MBP) with lipid bilayers studied by spin-labeling. J. Biol. Chem. 278:29041–29047. [DOI] [PubMed] [Google Scholar]
- 92.Romero, P., Z. Obradovic, X. Li, E. C. Garner, C. J. Brown, and A. K. Dunker. 2001. Sequence complexity of disordered protein. Proteins. 42:38–48. [DOI] [PubMed] [Google Scholar]
- 93.Li, X., P. Romero, M. Rani, A. K. Dunker, and Z. Obradovic. 1999. Predicting protein disorder for N-, C-, and internal regions. Genome Inform. Ser. Workshop Genome Inform. 10:30–40. [PubMed] [Google Scholar]
- 94.Garnier, J., J. F. Gibrat, and B. Robson. 1996. GOR method for predicting protein secondary structure from amino acid sequence. Methods Enzymol. 266:540–553. [DOI] [PubMed] [Google Scholar]
- 95.Gaboriaud, C., V. Bissery, T. Benchetrit, and J. P. Mornon. 1987. Hydrophobic cluster analysis: an efficient new way to compare and analyze amino acid sequences. FEBS Lett. 224:149–155. [DOI] [PubMed] [Google Scholar]
- 96.Rule, G. S., and T. K. Hitchens. 2006. Fundamentals of Protein NMR Spectroscopy. Springer, Dordrecht, The Netherlands.
- 97.Bernado, P., E. Mylonas, M. V. Petoukhov, M. Blackledge, and D. I. Svergun. 2007. Structural characterization of flexible proteins using small-angle x-ray scattering. J. Am. Chem. Soc. 129:5656–5664. [DOI] [PubMed] [Google Scholar]
- 98.Dyson, H. J., and P. E. Wright. 2002. Insights into the structure and dynamics of unfolded proteins from nuclear magnetic resonance. Adv. Protein Chem. 62:311–340. [DOI] [PubMed] [Google Scholar]
- 99.Rath, A., A. R. Davidson, and C. M. Deber. 2005. The structure of “unstructured” regions in peptides and proteins: role of the polyproline II helix in protein folding and recognition. Biopolymers. 80:179–185. [DOI] [PubMed] [Google Scholar]
- 100.Bates, I. R., P. Matharu, N. Ishiyama, D. Rochon, D. D. Wood, E. Polverini, M. A. Moscarello, N. J. Viner, and G. Harauz. 2000. Characterization of a recombinant murine 18.5-kDa myelin basic protein. Protein Expr. Purif. 20:285–299. [DOI] [PubMed] [Google Scholar]
- 101.Palmer III, A. G. 1997. Probing molecular motion by NMR. Curr. Opin. Struct. Biol. 7:732–737. [DOI] [PubMed] [Google Scholar]
- 102.Mukherjee, M., K. Dutta, M. A. White, D. Cowburn, and R. O. Fox. 2006. NMR solution structure and backbone dynamics of domain III of the E protein of tick-borne Langat flavivirus suggests a potential site for molecular recognition. Protein Sci. 15:1342–1355. [DOI] [PMC free article] [PubMed] [Google Scholar]
- 103.Marsh, J. A., C. Neale, F. E. Jack, W. Y. Choy, A. Y. Lee, K. A. Crowhurst, and J. D. Forman-Kay. 2007. Improved structural characterizations of the drkN SH3 domain unfolded state suggest a compact ensemble with native-like and non-native structure. J. Mol. Biol. 367:1494–1510. [DOI] [PubMed] [Google Scholar]
- 104.Libich, D. S., C. M. D. Hill, J. D. Haines, and G. Harauz. 2003. Myelin basic protein has multiple calmodulin-binding sites. Biochem. Biophys. Res. Commun. 308:313–319. [DOI] [PubMed] [Google Scholar]
- 105.Libich, D. S., and G. Harauz. 2002. Interactions of the 18.5 kDa isoform of myelin basic protein with Ca2+-calmodulin: in vitro studies using fluorescence microscopy and spectroscopy. Biochem. Cell Biol. 80:395–406. [DOI] [PubMed] [Google Scholar]
- 106.Libich, D. S., and G. Harauz. 2002. Interactions of the 18.5 kDa isoform of myelin basic protein with Ca2+-calmodulin—in vitro studies using gel shift assays. Mol. Cell. Biochem. 241:45–52. [DOI] [PubMed] [Google Scholar]
- 107.Berggard, T., G. Arrigoni, O. Olsson, M. Fex, S. Linse, and P. James. 2006. 140 mouse brain proteins identified by Ca2+-calmodulin affinity chromatography and tandem mass spectrometry. J. Proteome Res. 5:669–687. [DOI] [PubMed] [Google Scholar]
- 108.Zhang, Z., A. K. Ottens, E. C. Golden, R. L. Hayes, and K. K. W. Wang. 2006. Using calmodulin-affinity capture to study the rat brain calmodulin proteome and its vulnerability to calpain and caspase proteolysis. Calcium Binding Proteins. 1:125–129. [Google Scholar]
- 109.Hill, C. M. D., J. D. Haines, C. E. Antler, I. R. Bates, D. S. Libich, and G. Harauz. 2003. Terminal deletion mutants of myelin basic protein: new insights into self-association and phospholipid interactions. Micron. 34:25–37. [DOI] [PubMed] [Google Scholar]
- 110.Tugarinov, V., P. M. Hwang, and L. E. Kay. 2004. Nuclear magnetic resonance spectroscopy of high-molecular-weight proteins. Annu. Rev. Biochem. 73:107–146. [DOI] [PubMed] [Google Scholar]
- 111.Hayashi, N., M. Matsubara, Y. Jinbo, K. Titani, Y. Izumi, and N. Matsushima. 2002. Nef of HIV-1 interacts directly with calcium-bound calmodulin. Protein Sci. 11:529–537. [DOI] [PMC free article] [PubMed] [Google Scholar]
- 112.Kranz, J. K., E. K. Lee, A. C. Nairn, and A. J. Wand. 2002. A direct test of the reductionist approach to structural studies of calmodulin activity: relevance of peptide models of target proteins. J. Biol. Chem. 277:16351–16354. [DOI] [PubMed] [Google Scholar]
- 113.Turjanski, A. G., D. A. Estrin, R. E. Rosenstein, J. E. McCormick, S. R. Martin, A. Pastore, R. R. Biekofsky, and V. Martorana. 2004. NMR and molecular dynamics studies of the interaction of melatonin with calmodulin. Protein Sci. 13:2925–2938. [DOI] [PMC free article] [PubMed] [Google Scholar]
- 114.Ikura, M., L. E. Kay, and A. Bax. 1990. A novel approach for sequential assignment of 1H, 13C, and 15N spectra of proteins: heteronuclear triple-resonance three-dimensional NMR spectroscopy. Application to calmodulin. Biochemistry. 29:4659–4667. [DOI] [PubMed] [Google Scholar]
- 115.Borg, M., T. Mittag, T. Pawson, M. Tyers, J. D. Forman-Kay, and H. S. Chan. 2007. Polyelectrostatic interactions of disordered ligands suggest a physical basis for ultrasensitivity. Proc. Natl. Acad. Sci. USA. 104:9650–9655. [DOI] [PMC free article] [PubMed] [Google Scholar]
- 116.Radivojac, P., S. Vucetic, T. R. O'Connor, V. N. Uversky, Z. Obradovic, and A. K. Dunker. 2006. Calmodulin signaling: analysis and prediction of a disorder-dependent molecular recognition. Proteins. 63:398–410. [DOI] [PubMed] [Google Scholar]
- 117.Porumb, T., A. Crivici, P. J. Blackshear, and M. Ikura. 1997. Calcium binding and conformational properties of calmodulin complexed with peptides derived from myristoylated alanine-rich C kinase substrate (MARCKS) and MARCKS-related protein (MRP). Eur. Biophys. J. 25:239–247. [DOI] [PubMed] [Google Scholar]
- 118.Osawa, M., H. Tokumitsu, M. B. Swindells, H. Kurihara, M. Orita, T. Shibanuma, T. Furuya, and M. Ikura. 1999. A novel target recognition revealed by calmodulin in complex with Ca2+-calmodulin-dependent kinase kinase. Nat. Struct. Biol. 6:819–824. [DOI] [PubMed] [Google Scholar]
- 119.Hoeflich, K. P., and M. Ikura. 2002. Calmodulin in action: diversity in target recognition and activation mechanisms. Cell. 108:739–742. [DOI] [PubMed] [Google Scholar]
- 120.Ishida, H., and H. J. Vogel. 2006. Protein-peptide interaction studies demonstrate the versatility of calmodulin target protein binding. Protein Pept. Lett. 13:455–465. [DOI] [PubMed] [Google Scholar]
- 121.Shi, Z., R. W. Woody, and N. R. Kallenbach. 2002. Is polyproline II a major backbone conformation in unfolded proteins? Adv. Protein Chem. 62:163–240. [DOI] [PubMed] [Google Scholar]
- 122.Lam, S. L., and V. L. Hsu. 2003. NMR identification of left-handed polyproline type II helices. Biopolymers. 69:270–281. [DOI] [PubMed] [Google Scholar]
- 123.Czinki, E., and A. G. Császár. 2007. Empirical isotropic chemical shift surfaces. J. Biomol. NMR. 38:269–287. [DOI] [PubMed] [Google Scholar]
- 124.Polverini, E., A. Fasano, F. Zito, P. Riccio, and P. Cavatorta. 1999. Conformation of bovine myelin basic protein purified with bound lipids. Eur. Biophys. J. 28:351–355. [DOI] [PubMed] [Google Scholar]
- 125.Permyakov, S. E., I. S. Millett, S. Doniach, E. A. Permyakov, and V. N. Uversky. 2003. Natively unfolded C-terminal domain of caldesmon remains substantially unstructured after the effective binding to calmodulin. Proteins. 53:855–862. [DOI] [PubMed] [Google Scholar]
- 126.Bourhis, J. M., V. Receveur-Bréchot, M. Oglesbee, X. Zhang, M. Buccellato, H. Darbon, B. Canard, S. Finet, and S. Longhi. 2005. The intrinsically disordered C-terminal domain of the measles virus nucleoprotein interacts with the C-terminal domain of the phosphoprotein via two distinct sites and remains predominantly unfolded. Protein Sci. 14:1975–1992. [DOI] [PMC free article] [PubMed] [Google Scholar]
- 127.Sigalov, A. B., A. V. Zhuravleva, and V. Y. Orekhov. 2007. Binding of intrinsically disordered proteins is not necessarily accompanied by a structural transition to a folded form. Biochimie. 89:419–421. [DOI] [PMC free article] [PubMed] [Google Scholar]
- 128.Ramwani, J. J., R. M. Epand, and M. A. Moscarello. 1989. Secondary structure of charge isomers of myelin basic protein before and after phosphorylation. Biochemistry. 28:6538–6543. [DOI] [PubMed] [Google Scholar]
- 129.Grzesiek, S., S. J. Stahl, P. T. Wingfield, and A. Bax. 1996. The CD4 determinant for downregulation by HIV-1 Nef directly binds to Nef. Mapping of the Nef binding surface by NMR. Biochemistry. 35:10256–10261. [DOI] [PubMed] [Google Scholar]
Associated Data
This section collects any data citations, data availability statements, or supplementary materials included in this article.