Abstract
Accurate measurements of nuclear deformation, i.e., structural changes of the nucleus in response to environmental stimuli, are important for signal transduction studies. Traditionally, these measurements require labeling and imaging, and then nuclear measurement using image analysis. This approach is time-consuming, invasive, and unavoidably perturbs cellular systems. Light scattering, an emerging biophotonics technique for probing physical characteristics of living systems, offers a promising alternative. Angle-resolved low-coherence interferometry (a/LCI), a novel light scattering technique, was developed to quantify nuclear morphology for early cancer detection. In this study, a/LCI is used for the first time to noninvasively measure small changes in nuclear morphology in response to environmental stimuli. With this new application, we broaden the potential uses of a/LCI by demonstrating high-throughput measurements and by probing aspherical nuclei. To demonstrate the versatility of this approach, two distinct models relevant to current investigations in cell and tissue engineering research are used. Structural changes in cell nuclei due to subtle environmental stimuli, including substrate topography and osmotic pressure, are profiled rapidly without disrupting the cells or introducing artifacts associated with traditional measurements. Accuracy ≥ 3% is obtained for the range of nuclear geometries examined here, with the greatest deviations occurring for the more complex geometries. Given the high-throughput nature of the measurements, this deviation may be acceptable for many biological applications that seek to establish connections between morphology and function.
INTRODUCTION
Nuclear shape and deformation can serve as important signals in regulating cellular physiology and gene expression; therefore, accurate measurements of nuclear morphology can benefit a wide variety of cell biology studies. As an example, mechanical forces in the extracellular environment may be physically transduced by the cytoskeleton to the nucleus, resulting in nuclear deformation (1,2). Traditionally, nuclear morphology has been determined by fluorescence microscopy imaging, generally after the prerequisite fixation and immunohistochemical staining. However, this approach requires time-consuming image analysis and, in the case of fixation, it only provides one end-point measurement of the postfixation properties of the cells. To further develop understanding of the role of nuclear deformation in cellular events, a noninvasive, high-throughput screening method is needed.
In this study, we present a new application of an optical technique, angle-resolved low coherence interferometry (a/LCI), as a noninvasive tool for assessing nuclear deformation in cell mechanics studies. The a/LCI technique has been developed for detecting changes in epithelial cell nuclei in response to neoplastic transformation (3,4). Here, for the first time, the use of a/LCI is broadened to more general studies of cell mechanics. We demonstrate that it accurately measures nuclear deformation in response to two different environmental stimuli applied to different cell types. The a/LCI method is used to rapidly and accurately profile mechanically induced changes in the nuclear morphology of murine macrophages and osmotically induced changes in the nuclear morphology of porcine chondrocytes (cartilage cells). The nuclear morphology changes observed in our study have significant consequences for the field of cell and tissue engineering. We demonstrate that the a/LCI measurements agree with the results of image analysis with a high degree of accuracy in a fraction of the time needed for manual image analysis. Thus, we expect that a/LCI will become a valuable tool for characterizing the response of cells to engineered environments.
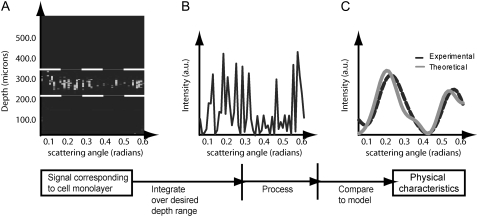
The a/LCI method combines the optical sectioning capabilities of low-coherence interferometry with inverse light scattering analysis (ILSA) to determine nuclear morphology with subwavelength accuracy (5). Low-coherence interferometry uses a wide bandwidth source to achieve depth resolution and to reject out-of-focus light from detection, as in optical coherence tomography (6). This enables sensitive measurements of light scattered from a single cell monolayer (Fig. 1). ILSA is predicated on the fact that elastically scattered light from an object yields a unique signature that is a function of the shape, size, and electromagnetic properties of the object. The signature may be identified by measurements of the resonance spectra or the spatial light scattering distribution, among others (7). By measuring the light scattering properties of an object or a distribution of objects and comparing them to an appropriate model, the characteristics of the scattering object(s) can be discerned with great accuracy.
FIGURE 1.
Acquisition and processing of light scattering data from a cell monolayer using the a/LCI technique. In A, the optical depth corresponding to the cell monolayer is summed to obtain the intensity of the scattered light versus scattering angle (B). The scattering distribution is then low-pass filtered and a second-order polynomial is subtracted to isolate the nuclear scattering. Finally, the processed scattering distribution is compared to a database of known scattering distributions (calculated from an appropriate light scattering model) to ascertain the nuclear morphology (C). In this case, the sample comprised a monolayer of chondrocyte cells for which the a/LCI size determination was 6.5 μm.
ILSA has been used to characterize many cell features. For instance, it has been used to investigate the contributions of the various cellular structures to elastic light scattering (8). Periodic variations in light scattering spectra yield the size of cell nuclei (9), and they also may reveal submicron structures (10). ILSA also has been used with a/LCI to investigate cellular organization and substructure (11) and, more recently, to examine long-range correlations due to coherent light scattering from in vitro cell arrays (12). In addition, ILSA is emerging as a powerful tool for diagnosing various forms of cancer (13,14).
The theoretical framework used for inverse light scattering analysis of a/LCI measurements is based on Mie theory (15), which is the electromagnetic theory of light scattering from a homogeneous sphere. Although Mie theory has been used successfully in many cell models and tissue architectures that contain spherical cell nuclei, it is limited in scope because cell nuclei are often aspherical in their native environment. To broaden its application, a/LCI uses ILSA based on a modified Mie theory, which has been shown to produce accurate cell nuclei measurements (11,16) and even useful measurements of aspherical scatterers (17). The purpose of the following studies is to demonstrate that a/LCI is a fast and accurate method of measuring nuclear deformation in both spherical and nonspherical geometries.
In the first study presented here, osmotically stressed porcine chondrocytes were used as a model system to produce small changes in nuclear volume. It is well known that the volume of isolated chondrocytes is sensitive to media osmolarity (18,19). It also has been observed that changes in chondrocyte volume cause a corresponding change in the nuclear volume, independent of cytoskeletal integrity (1). In this study, small changes in nuclear volume were achieved through alterations of the extracellular osmolarity, measured with a/LCI analysis of unstained cells, and verified through image analysis of fluorescently labeled, unfixed cells.
In the second study, macrophages were used as a model system to study changes in nuclear morphology in response to topographical cues. Cells such as smooth muscle cells and bone marrow–derived mesenchymal stem cells have been observed to align and dramatically elongate when cultured on surfaces patterned with gratings with a period in the submicron range (20,21). This alteration in cellular morphology is accompanied by phenotypic changes in proliferation, motility, and gene expression. Deformation of the nucleus was observed in these studies, and we hypothesize that these topography-induced phenomena are mediated by a mechanotransduction event that originates from the focal adhesion sites and is conveyed to the nuclear membrane. The data presented here demonstrate the feasibility of using a/LCI and ILSA to detect nuclear deformation. We plan future studies with this cell system that will use this biophotonics technique to correlate environmental topography with cell function, where highly accurate measurements of nuclear deformation are needed.
METHODS
Chondrocyte cell culturing
This study uses chondrocytes isolated from articular cartilage of the lateral femoral condyle of 2–3-year-old skeletally mature female pigs obtained from a local abattoir. Cells were isolated by sequential digestion in pronase and collagenase solution and seeded on glass coverslips in Dulbecco's modified Eagle's medium containing 10% fetal bovine serum, 1.5% 4-(2-hydroxyethyl)-1-piperazineethanesulfonic acid or HEPES, and 1% nonessential amino acids (all from Gibco BRL Products, Life Technologies, Grand Island, NY). The media was adjusted to pH 7.4, and its osmolarity was increased to 380 mOsm with sucrose and verified with a freezing point osmometer (Osmette A; Precision Systems, Natick, MA). For a/LCI experiments, chondrocytes were seeded at 7 × 10⁵/cm2 in chambered coverglasses. For confocal microscopy experiments, a 0.2-μl droplet of media containing 2 × 10⁵ cells was spread on the center of a 42-mm diameter coverslip that was placed in a 60-mm diameter culture dish and incubated for 1 h to allow the cells to attach. Then, 5 ml of media were added to each dish. Cells were incubated at 37°C, 5% CO2, in a humidified atmosphere including 95% air for 24 h before experimentation. As a result, the chondrocytes were attached to the glass substrate but retained their rounded morphology at the time of the experiments.
Patterned PDMS samples
Using soft lithography, a tissue culture polystyrene mold was used to produce gratings on poly(dimethyl siloxane) (PDMS) (Sylgard 184 Silicone Elastomer Kit; Dow Corning, Midland, MI). The PDMS replicas were fabricated with an elastomer base/cross-linking agent ratio (w/w) of 10:1, degassed, poured onto the tissue culture polystyrene mold, allowed to bake at 50°C for 3 h, cooled at room temperature, and then separated from the mold. Although soft lithography successfully transferred patterns with nanoscale topographical features onto PDMS, we used 2 μm PDMS gratings for this study, because significant nuclei and morphology elongation on this pattern were observed. The surface dimensions of the parallel gratings were inspected by atomic force microscopy and had width/periodicity/height measurements of 2 μm:4 μm:0.8 μm. Patterned PDMS and planar PDMS control were sterilized in 70% ethanol under ultraviolet light for 30 min and then rinsed with phosphate-buffered saline before cell culture.
Macrophage cell culturing
RAW 264.7 murine macrophage cells (American Type Culture Collection Manassas, VA), were chosen for the native spherical morphology and simple biological features. The cells were seeded at 1.5 × 10⁴ cells/cm2 for 48 h for each sample. Three samples were prepared: a planar control sample, and one sample in each of two orthogonal grating orientations in the chambered coverglass. The macrophage cells were cultured in Dulbecco modified Eagle medium containing 1.5 g/L sodium bicarbonate and 4.5 g/L glucose, supplemented with 10% fetal bovine serum and penicillin/streptomycin, and incubated at 37°C and 5% CO2.
a/LCI measurements
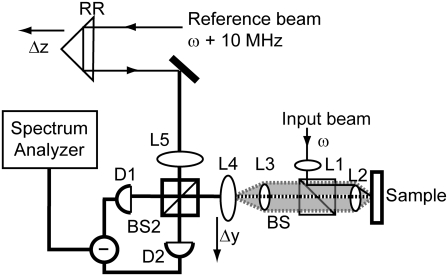
In the a/LCI setup (Fig. 2), low-coherence light from a titanium-sapphire laser source (coherence length = 30 μm) was separated into input and reference beams, and a difference frequency of 10 MHz was introduced between the two via acousto-optical modulators. The retroreflector in Fig. 2 was translated axially to achieve optical sectioning by taking advantage of the coherence properties of the source. Lenses L1–L4 were configured so that the incident light was collimated on the sample, and lens L4 was in the conjugate plane of the scattered light (shaded area in Fig. 2). By scanning L4 in the y direction, the intensity of the scattered light could be mapped as a function of the scattering angle. The signals from the reference and sample beams were focused on a photodetector, and then the interference signal between the reference beam and the scattered light was demodulated at 10 MHz using a spectrum analyzer. By serially scanning the retroreflector and L4, a contour plot of the scattered light could be built as a function of depth and scattering angle.
FIGURE 2.
a/LCI schematic in a Mach-Zehnder interferometer configuration (used with permission of Pyhtila and colleagues (5)). Axial translation of retroreflector permits optical sectioning of the sample by taking advantage of coherence properties of the source. Lenses L1–L4 are configured as shown so that 1), the beam is collimated when incident on the sample, and 2), L4 is in the image plane of the scattered light (the periphery of which is shaded). By scanning L4, the intensity of scattered light can be mapped as a function of the scattering angle.
For the chondrocyte experiment, measurements were performed over the course of 4 h. Three osmolarities (330, 400, and 500 mOsm) were cycled through for a single sample, and a/LCI measurements were made for each osmolarity. The sample was discarded after the measurements were made. Each size measurement reported is the average over N = 14 a/LCI measurements.
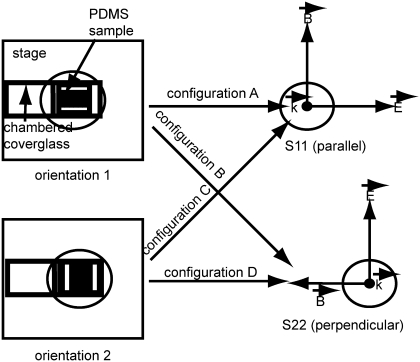
For the macrophage cell experiment, measurements were made on the a/LCI system over the course of 8 h. We hypothesized that, because the cell nuclei in this model were oriented spheroids, different and complementary information could be obtained as a function of sample orientation and incident polarization of the light. After the convention of Fig. 3, the following measurements were made: N =15 measurements of orientation 1 in parallel incident light polarization (configuration A); N = 15 measurements of orientation 1 in perpendicular polarization (configuration B); N = 9 measurements of orientation 2 in parallel polarization (configuration C); N = 15 measurements of orientation 2 in perpendicular polarization (configuration D); and N = 14 measurements of the planar control sample, 7 in each polarization; ∼10–20% of measurements in each configuration had a poor signal due to low cell density and so were discarded. Nine measurements were taken in configuration C due to technical difficulties with the sample. Each sample was out of incubation for a total of 15 min for a/LCI measurements; then it was placed back into incubation, and another sample was selected for measurement.
FIGURE 3.
Schematic of the four configurations used in the a/LCI setup for the experiment regarding the macrophage cells on a 2-μm PDMS grating. The two orientations determine whether the symmetry axis of the macrophage cell nuclei will present itself to the electric field vector or the magnetic field vector; the incident light polarization determines the direction of the two field vectors as presented to the sample.
DATA ANALYSIS
Chondrocyte image analysis
Chondrocytes were incubated at 37°C for 30 min with nucleic acid stain (Syto 82; Molecular Probes, Eugene OR) before imaging. Nuclei were visualized using confocal laser scanning microscopy (LSM 510; Carl Zeiss, Jena, Germany). Images were obtained through an inverted fluorescent microscope (Axiovert 100M; Carl Zeiss) with a 63× magnification, water immersion, 1.2-NA objective lens (C-Apochromat; Carl Zeiss). Argon-ion laser excitation intensity (488 nm) was set to 2% of full power and images were recorded through a 505–530 nm bandpass filter on an 8-bit intensity scale. Images consisted of stacks of confocal sections at 0.5-μm intervals with 1-μm slice thickness and a pixel size of 0.12 μm in-plane. Image stacks were subsequently projected onto a single two-dimensional image using LSM Image Browser software (Carl Zeiss). Each nucleus was cropped from the larger image and thresholded individually using the Iterative Self Organizing Data algorithm as implemented in image processing software (ImageJ; National Institutes of Health, Bethesda, MD) to determine its cross-sectional area. The cross-sectional area was related to an equivalent diameter using the formula for the area of a circle. Reported sizes are based on nuclear size determinations for n = 82 cells for each osmolarity.
Macrophage image analysis
After a/LCI measurements, samples with macrophage cells were fixed in 4% paraformaldehyde and permeabilized with 0.05% Triton-X and 50 mM glycine solution. The F-actin and nucleus were stained with Oregon Green 488 phalloidin and 4,6-diamidino-2-phenylindole (both from Molecular Probes), respectively, as described previously (22). Samples were thoroughly washed with phosphate-buffered saline and mounted on glass coverslips with Gel/Mount (Biomeda, Foster City, CA) before images were obtained with confocal and fluorescence microscopy. Each sample was photographed (40× and 63× magnification) over at least 12 separate regions. These images were analyzed using image processing software (ImageJ; National Institutes of Health). Reported sizes are based on nuclear size determinations for n = 78 cells for planar control samples and n = 112 for patterned samples.
a/LCI analysis
Briefly, the a/LCI technique consists of three steps: acquisition, processing, and analysis. Referring to Fig. 1 A, a contour plot comprising the signal as a function of sample depth and scattering angle is acquired. The signal then is integrated over the region of interest in depth (corresponding to the cell monolayer in our study), which yields the raw scattering data as a function of angle (Fig. 1 B). The scattering distribution contains contributions from scatterers such as organelles, nuclei, and cells; coherent scattering from adjacent nuclei; and noise. All of these contributions correspond to scattering over different length scales that are separated in the Fourier spectrum of the signal. It has been established that a low-pass filter can eliminate contributions from the latter three components, whereas a second-order polynomial removal eliminates the contributions from the first (5). The processed signal comprises only the scattering from cell nuclei as a function of scattering angle (Fig. 1 C).
Separately, a database is prepared that consists of a range of scattering distributions predicted by Mie theory, which is the theory of electromagnetic scattering from homogenous, dielectric spheres. The database is parameterized by sphere size, the size distribution of the spheres, the index of refraction of the medium surrounding the spheres, and the index of refraction of the spheres themselves. In addition, the parameter space is chosen to correspond to the application and any a priori knowledge regarding the sample (see following paragraph for parameterization in this study). Finally, the processed signal is compared to the database, and the nuclear size is established by using a least-squares fitting algorithm (Fig. 1 C). In Fig. 1, the sample comprises a monolayer of chondrocyte cells for which the a/LCI size determination was 6.5 μm.
In the chondrocyte cell experiment, the database was parameterized in the following manner: nuclear diameter ranging from 5.0 to 10.0 μm in steps of 0.1 μm; index of refraction of surrounding medium (cytoplasm) ranging from 1.35 to 1.39 μm in steps of 0.01 μm; index of refraction of cell nucleus ranging from 1.40 to 1.43 μm in steps of 0.01 μm; and size distributions of 2.5%, 5.0%, 7.5%, and 10.0% (size distribution is a normal distribution of sizes about the center nuclear diameter). The macrophage cell experiment was parameterized identically except that the nuclear diameter ranged from 5.0 to 14.0 μm. In this experiment, all data were gathered over an angular range of 0.61 radians from the backscatter (θ = π) with angular resolution of 0.01 radians.
Validation of modified Mie theory analysis using the T-matrix method
To assess the ability of a/LCI analysis, based on modified Mie theory, to determine the structure of spheroids in the indicated orientations (Fig. 3), we applied the method to test data generated using the T-matrix method (23). For each combination of structural parameters (see below), the T-matrix data were compared to a database of angular scattering distributions generated by Mie theory, which predicts light scattering properties of spherical particles, with the following parameters: diameter of particle varied from 5.0 to 13.0 μm; surrounding refractive index varied from 1.35 to 1.37 μm; target refractive index varied from 1.41to 1.43 μm; and size distributions of 1.0%, 2.5%, and 5.0%. The scattering distribution was considered over a total angular range of 0.61 radians with angular resolution of 0.01 radians, which corresponds to the parameters used by the a/LCI system in the cell experiments. To enable useful size determinations, the a/LCI analysis uses a second-order polynomial, which was subtracted from both the model and the T-matrix data. This served to compare the oscillations in the scattering distribution due to diffraction as opposed to fitting the slowly varying features due to reflection and refractions, as described by Pyhtila and colleagues (5). The best fit was determined by χ2 least-squares fitting.
The T-matrix simulations were used to model angular scattering distributions for a distribution of dielectric spheroids with an equal volume radius of 3.75 μm, a surrounding refractive index of 1.36, a target refractive index of 1.42, and a size distribution of 2.5%. The aspect ratios, ɛ, were varied between 0.5 and 1.0 in increments of 0.2, keeping the volume constant. These parameters were chosen based on the approximate properties of the elongated macrophage cell nuclei. At ɛ = 1.0, the results agreed with the results predicted by Mie theory, as expected. Two different particle orientations were considered: one at α = 90°, β = 90°, and the other at α = 0°, β = 60°, where α and β are the Euler angles. These orientations correspond to the oriented macrophage cell nuclei evaluated in the experiment, as influenced by the orientation of the stage in the a/LCI system. Both perpendicular (S22) and parallel (S11) polarized incident light also were considered.
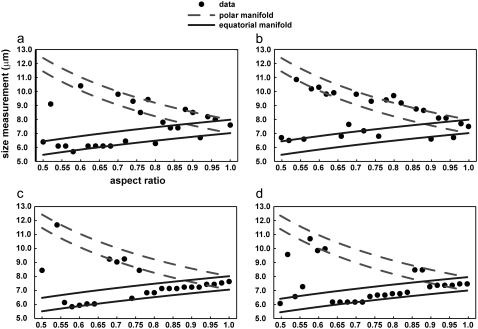
The results of the analysis (Fig. 4) demonstrate that the size determinations from the a/LCI analysis largely lie along one of two manifolds that track the minor and major axes of the spheroid. The equatorial and polar manifolds are 1 wavelength (830-nm) thick, with the center corresponding to the equatorial and polar axes of the spheroid at that aspect ratio. These results indicate that the size measurement of a spheroidal particle as determined by the a/LCI analysis technique almost universally correspond to either the equatorial or polar dimension; however, there is no method of consistently predicting which it will be. These results will be published in more detail elsewhere.
FIGURE 4.
Results of using the a/LCI analysis technique to measure size of spheroidal particles by using angular scattering distributions calculated using the T-matrix model as input into the analysis. Angular scattering distributions correspond to a particle with an equal volume radius of 3.75 μm, a background refractive index of 1.36, a target refractive index of 1.42, and a size distribution of 2.5%. The polarization and orientation of the light and particle respectively are (a) S11, α = 90°, β = 90°; (b) S22, α = 90°, β = 90°, (c) S11, α = 0°, β = 60°, and (d) S22, α = 0°, β = 90°, where α and β are Euler angles and S11 and S22 are parallel and perpendicular incident polarizations, respectively. The equatorial and polar manifolds are 1 wavelength (830 nm) thick, with the center corresponding to the equatorial and polar axes of the spheroid at that aspect ratio. These results indicate that the size measurement of a spheroidal particle as determined by the a/LCI analysis technique almost universally falls on either the equatorial or polar manifold; however, there is no method of consistently predicting which it will be.
Statistical methods
In the chondrocyte cell experiment, repeated measurements were taken on the same cell populations under different osmotic pressures. To account for this, a two-factor analysis of variance with repeated measures followed by Newman-Keuls post hoc test (α = 0.05) were performed with a statistical software package (Statistica; StatSoft, Tulsa, OK) to determine the effect of method (confocal microscopy versus a/LCI) and osmolarity (330, 400, and 500 mOsm) on the measured nuclear diameter.
In the macrophage cell experiment, all p values were calculated using a rank sum test in MATLAB (The MathWorks, Natick, MA) using the default value of α = 0.05.
RESULTS
Assessment of deformation of chondrocyte cell nucleus induced by osmotic loading
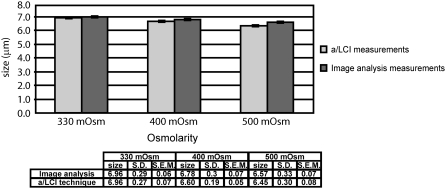
Two separate experiments were performed using chondrocytes drawn from a single superlot of multiple donors to allow comparison of nuclear size measurements made by confocal microscopy and a/LCI. For the a/LCI experiments, cells were seeded at high density in chambered coverglasses and equilibrated with 500, 400 and 330 mOsm saline solution, in that order. The measured nuclear diameters were measured at 6.45 ± 0.08 μm, 6.60 ± 0.05 μm, and 6.96 ± 0.07 μm, respectively (mean ± SE within the 95% confidence interval). Because one cannot determine the exact number of cells measured in this case, mean ± SE was determined by the number of a/LCI measurements. Using two-factor analysis of variance with repeated measures, a significant main effect of osmolarity (but not of method) was found (p < 0.05). There also was a statistically significant interaction between osmolarity and method (p = 0.001). The Newman-Keuls post hoc test showed statistically significant differences at 95% confidence intervals for all the pairwise comparisons between different osmolarities for a/LCI measurements.
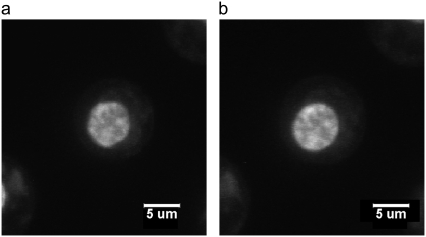
To validate these measurements by fluorescence confocal microscopy, chondrocytes were seeded at low density on coverglasses that were subsequently mounted in a perfusion chamber on a confocal microscope stage to allow simultaneous fluid exchange and imaging. Once a suitable group of cells was located, they were equilibrated to 500, 400 and 330 mOsm saline solution, in that order, and the projected area of the chondrocyte nuclei was imaged (Fig. 5). The equivalent diameters of the nuclei at 500, 400 and 330 mOsm were 6.57 ± 0.07 μm, 6.78 ± 0.07 μm, and 6.96 ± 0.06 μm, respectively. The Newman-Keuls post hoc test showed statistically significant differences at 95% confidence intervals for all the pairwise comparisons between different osmolarities for image analysis. All results are summarized in Fig. 6.
FIGURE 5.
Confocal images of stained chondrocyte cell nucleus equilibrated at (a) 500 mOsm and (b) 330 mOsm. At 500 mOsm, the cell nucleus is smaller and less rounded than the cell nucleus equilibrated at 330 mOsm, which is a typical observation in this experiment.
FIGURE 6.
Results of measurements of porcine chondrocyte cell nuclei using (a) image analysis and (b) the a/LCI technique. The error bars correspond to mean ± SE (standard error of the mean in the 95% confidence interval). Both experiments demonstrate a statistically significant (p < 0.05) increase in nuclear size with decreasing osmolarity.
As a comparison of the required effort between the two methods, we note that labeling, imaging, and analysis of the chondrocyte cell nuclei required > 1 day and yielded measurements of 82 cells for each osmolarity. This corresponds to a measurement rate of ∼20 cell nuclei/h. In comparison, 10 measurements of the cells were made at each osmolarity using a/LCI in ∼4 h. Each measurement is the average measurement of ∼100 cell nuclei, yielding a measurement rate of ∼1000 cell nuclei/h.
Assessment of deformation of macrophage cell nucleus induced by topography
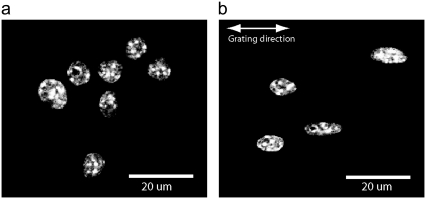
The nuclei of cells grown on the patterned substrates exhibit an elongation along the axis of the gratings (Fig. 7). We formed the hypothesis, based on the results of modeling presented in Fig. 4, that applying the a/LCI technique to oriented spheroidal scatterers, such as cell nuclei on patterned samples, could provide accurate measurements of both the major and minor axes of the scatterer. Through repeated measurements with varying orientation and polarization, both dimensions were determined, and the cell nucleus was characterized fully.
FIGURE 7.
DAPI-stained images of murine macrophage cell nuclei in planar control configuration (a) and on 2-μm PDMS grating (b). Elongation of nuclei along the direction of the grating is clear compared to planar controls.
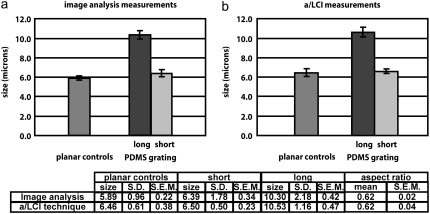
The results of this study are shown in Fig. 8. Traditional image analysis showed that the planar control samples exhibited an overall nuclear size of 5.89 ± 0.22 μm. The planar control sample nuclei were slightly spheroidal, with a major axis of 6.46 ± 0.13 μm and a minor axis of 5.31 ± 0.10 μm, yielding an aspect ratio (ratio of minor to major axes) of 0.83 ± 0.01 μm. In comparison, the a/LCI technique determined a size of 6.46 ± 0.38 μm on the planar control, which accurately agreed with the major axis measurement. Here, we were unable to vary the orientation and incident polarization due to the random orientation of the cell nuclei on the planar controls.
FIGURE 8.
Results of measurements of murine macrophage cell nuclei using (a) image analysis and (b) a/LCI technique. The planar controls were determined by image analysis to be nonoriented spheroids with a small aspect ratio; it is reported as the average between the major and minor axes. For the a/LCI measurements, there was a bimodal distribution of sizes. One size was within the 95% confidence interval of the planar controls, and the other size distribution contained sizes at least four standard deviations larger than the planar controls. The short size was determined to correspond to the minor (equatorial) axis of the macrophage cell nuclei; the large size was determined to correspond to the major (polar) axis of the macrophage cell nuclei. Results of measurements using image analysis and a/LCI analysis are reported in the table. Nuclear elongation is statistically significant (p < 0.01) for both a/LCI and image analysis measurements.
Cell morphology and nuclei on the patterned samples were aligned along the direction of the grating and exhibited a major axis of 10.30 ± 0.42 μm and a minor axis of 6.39 ± 0.34 μm, which corresponds to an aspect ratio of 0.62 ± 0.02 μm. There was a significant difference (p = 0.00001) between the elongation of the planar controls and the patterned samples as measured using traditional image analysis.
To apply a/LCI to determining the structure of oriented spheroids, we measured nuclear morphology of the patterned samples in four configurations as defined in Fig. 1. The four configurations correspond to the four combinations of parallel and perpendicular incident light polarization, and sample orientations along the x- and y-axes of the optical setup. We explored these four configurations to determine if the configurations produced complementary information with one another. All four configurations exhibited a bimodal distribution of size measurements, as was predicted by theoretical models (Fig. 4). In each configuration, there was a distribution of sizes within the 95% confidence interval of the planar control measurement, and there was another distribution of size measurements in which each measurement was at least 4 standard deviations larger than the mean of the planar control measurements. The mean sizes of these two distributions, averaged over all configurations, were 6.50 ± 0.23 μm and 10.53 ± 0.47 μm, respectively. These measurements were in very good agreement with the measurements of the major and minor axes of the macrophage cell nuclei, as determined by image analysis (6.39 ± 0.34 μm and 10.30 ± 0.42 μm, respectively). The measured aspect ratio using the a/LCI technique, 0.62 ± 0.04 μm, was in exact agreement with the aspect ratio measured by image analysis, 0.62 ± 0.02 μm.
DISCUSSION
Near-infrared light scattering methods have great promise as a tool for the study of living systems—the approach is an intrinsically nonperturbative structural measurement. The far-field diffraction pattern of a culture of cells, for example, can provide information about the various scattering targets within those cells (including subcellular structures such as the nucleus), the organization of the scatterers, and the organization of the cells themselves. A great deal of effort has been expended to discern how to separate and interpret each of these contributions (5,9–12,24). As shown here, the a/LCI method can provide useful measurements of nuclear geometry, which is an important cellular feature to monitor because of the connection between nuclear deformation and cell function.
Under normal physiological conditions, cells of the body are exposed to a complex and diverse environment of mechanical stresses and strains due to passive deformation and active behavior. Nearly all cells exhibit the ability to perceive and respond to such changes in their mechanical environment. Thus, the study of cell mechanics is particularly important for understanding the role of biomechanical forces in regulating cell physiology under normal and pathological conditions (25), as well as controlling cell growth and differentiation for applications such as tissue engineering (26). The functional relationship between environmental stimuli and nuclear deformation can shed light on the mechanotransduction of cellular signals and, therefore, provide powerful clues in deducing the influence of environment on cell function. Studies in this area include the observation of highly dynamic processes, which makes them a challenge for traditional biological imaging techniques that are often time-consuming and invasive. The application of light scattering techniques shows great potential to overcome these shortcomings. In this study, the a/LCI technique, which combines ILSA with optical sectioning, is used in two different cell mechanics experiments to measure perturbations of cell systems that manifest as changes in nuclear morphology. Our results demonstrate the potential utility of the a/LCI technique as a biophotonics platform for assessing nuclear deformation in cell studies.
The a/LCI system has been well-characterized previously for measuring spherical cell nuclei or nuclei that are spheroidal but with symmetry axes aligned parallel to the direction of the incident light. To test of the ability of the a/LCI system to measure nuclear deformation in the framework of a cell biology experiment, therefore, we first applied the a/LCI technique to measure the response to osmotic loading of chondrocyte cell nuclei, which have a spherical native morphology. The a/LCI measurements were found to agree with the image analysis measurements within 2–3%.
It is important to qualify this result, as we observed that the disagreement between a/LCI and image analysis increased as osmolarity increased. Although the errors in measurement were only a few percent, the discrepancy presents itself as a highly statistically significant interaction effect and points to a limitation of the a/LCI technique. In this study, the scattering data are fit to a spherical light scattering model; however, the chondrocyte cell nuclei exhibit an increasingly complex geometry at higher osmolarities. This is the most likely cause of the disagreement between the two measurement methods. To apply a/LCI over a wider range of osmolarities, an improved light scattering model is needed that accounts for more complex geometries. Although such a model would extend the utility of a/LCI, models accounting for more complex geometries are computationally expensive, thereby limiting their application. For many nuclear geometries, however, the small measurement discrepancy between the a/LCI technique and image analysis could be viewed as an acceptable tradeoff. The a/LCI measurements are stain free, and they can be collected at a rate ∼2 orders of magnitude faster than traditional image analysis measurements.
It is a significant finding that the a/LCI technique can measure deformation in nuclei that deviate from a spherical morphology and that are oriented orthogonally to the direction of incident light propagation, as this has been a potential limitation of the approach. In this study, the a/LCI system accurately measured the elongation of macrophage cell nuclei along a 2-μm period PDMS grating, obtaining the aspect ratio of the macrophage cell nuclei in exact agreement with that measured by image analysis. Additionally, the a/LCI measurement of the nonoriented, spheroidal planar, control macrophage cell nuclei agreed with the image analysis measurement of the major axis rather than the geometric mean of the major and minor axes expected for nonoriented spheroids (16). This result may provide an avenue for improving our understanding of the relationship between cell orientation, incident polarization, and the a/LCI measurement axis.
CONCLUSION
This study demonstrated the ability of the a/LCI technique to rapidly and accurately measure nuclear deformation in the framework of dynamic cell biology experiments. The a/LCI technique provides an advantage over traditional analysis in assessing nuclear deformation, as it is label free and reduces the acquisition time considerably. Even though a/LCI analyzes light scattering data using a spherical model, useful structural measurements were obtained across a range of nuclear geometries. The limitations of the approach, however, become evident in the chondrocyte experiments in which the complex geometry of the nucleus in the hyperosmotic regime resulted in measurement discrepancies of a few percent. Further advances in a/LCI should focus on improving light scattering models to handle complex geometries and reducing data acquisition time to enable cell dynamics measurements at even finer timescales. We expect that these advances will empower future investigations of functional relationships in cell mechanics, potentially making a/LCI an important measurement technique for a wide range of studies of living systems.
Acknowledgments
The authors thank Cyrus Amoozegar for his contributions to the a/LCI analysis.
This work was supported by grants from the National Science Foundation (BES-0348204), the National Cancer Institute (1R21CA120128-01), and the National Institutes of Health (NIH-EB003447, AG15768, and AR50245).
Editor: Alberto Diaspro.
References
- 1.Guilak, F. 1995. Compression-induced changes in the shape and volume of the chondrocyte nucleus. J. Biomech. 28:1529–1541. [DOI] [PubMed] [Google Scholar]
- 2.Chen, C. S., and D. E. Ingber. 1999. Tensegrity and mechanoregulation: from skeleton to cytoskeleton. Osteoarthritis Cartilage. 7:81–94. [DOI] [PubMed] [Google Scholar]
- 3.Wax, A., J. W. Pyhtila, R. N. Graf, R. Nines, C. W. Boone, R. R. Dasari, M. S. Feld, V. E. Steele, and G. D. Stoner. 2005. Prospective grading of neoplastic change in rat esophagus epithelium using angle-resolved low-coherence interferometry. J. Biomed. Opt. 10:051604. [DOI] [PubMed] [Google Scholar]
- 4.Chalut, K. J., L. A. Kresty, J. W. Pyhtila, R. Nines, M. Baird, V. E. Steele, and A. Wax. 2007. In situ assessment of intraepithelial neoplasia in hamster trachea epithelium using angle-resolved low-coherence interferometry. Cancer Epidem. Biomarkers Prev. 16:223–227. [DOI] [PubMed] [Google Scholar]
- 5.Pyhtila, J. W., R. N. Graf, and A. Wax. 2003. Determining nuclear morphology using an improved angle-resolved low coherence interferometry system. Opt. Express. 11:3473–3484. [DOI] [PubMed] [Google Scholar]
- 6.Huang, D., E. A. Swanson, C. P. Lin, J. S. Schuman, W. G. Stinson, W. Chang, M. R. Hee, T. Flotte, K. Gregory, C. A. Puliafito, and J. G. Fujimoto. 1991. Optical coherence tomography. Science. 254:1178–1181. [DOI] [PMC free article] [PubMed] [Google Scholar]
- 7.Bohren, C. F., and D. R. Huffman. 1983. Absorption and Scattering of Light by Small Particles. Wiley, New York.
- 8.Mourant, J. R., T. M. Johnson, S. Carpenter, A. Guerra, T. Aida, and J. P. Freyer. 2002. Polarized angular dependent spectroscopy of epithelial cells and epithelial cell nuclei to determine the size scale of scattering structures. J. Biomed. Opt. 7:378–387. [DOI] [PubMed] [Google Scholar]
- 9.Perelman, L. T., V. Backman, M. Wallace, G. Zonios, R. Manoharan, A. Nusrat, S. Shields, M. Seiler, C. Lima, T. Hamano, I. Itzkan, J. Van Dam, J. M. Crawford, and M. S. Feld. 1998. Observation of periodic fine structure in reflectance from biological tissue: a new technique for measuring nuclear size distribution. Phys. Rev. Lett. 80:627–630. [Google Scholar]
- 10.Backman, V., V. Gopal, M. Kalashnikov, K. Badizadegan, R. Gurjar, A. Wax, I. Georgakoudi, M. Mueller, C. W. Boone, R. R. Dasari, and M. S. Feld. 2001. Measuring cellular structure at submicrometer scale with light scattering spectroscopy. IEEE J. Sel. Top. Quantum Electron. 7:887–893. [Google Scholar]
- 11.Wax, A., C. H. Yang, V. Backman, K. Badizadegan, C. W. Boone, R. R. Dasari, and M. S. Feld. 2002. Cellular organization and substructure measured using angle-resolved low-coherence interferometry. Biophys. J. 82:2256–2264. [DOI] [PMC free article] [PubMed] [Google Scholar]
- 12.Pyhtila, J. W., H. Ma, A. J. Simnick, A. Chilkoti, and A. Wax. 2006. Determining long range correlations by observing coherent light scattering from in vitro cell arrays with angle-resolved low coherence interferometry. J. Biomed. Opt. 11:024603. [DOI] [PubMed] [Google Scholar]
- 13.Roy, H. K., Y. L. Kim, Y. Liu, R. K. Wali, M. J. Goldberg, V. Turzhitsky, J. Horwitz, and V. Backman. 2006. Risk stratification of colon carcinogenesis through enhanced backscattering spectroscopy analysis of the uninvolved colonic mucosa. Clin. Cancer Res. 12:961–968. [DOI] [PubMed] [Google Scholar]
- 14.Pyhtila, J. W., K. J. Chalut, J. D. Boyer, J. Keener, T. D'Amico, M. Gottfried, F. Gress, and A. Wax. 2007. In situ detection of nuclear atypia in Barrett's esophagus by using angle-resolved low-coherence interferometry. Gastrointest. Endosc. 65:487–491. [DOI] [PubMed] [Google Scholar]
- 15.van de Hulst, H. C. 1957. Light Scattering by Small Particles. Wiley, New York.
- 16.Pyhtila, J. W., and A. Wax. 2007. Polarization effects on scatterer sizing accuracy analyzed with frequency-domain angle-resolved low-coherence interferometry. Appl. Opt. 46:1735–1741. [DOI] [PubMed] [Google Scholar]
- 17.Keener, J. D., K. J. Chalut, J. W. Pyhtila, and A. Wax. 2007. Application of Mie theory to determine the structure of spheroidal scatterers in biological materials. Opt. Lett. 32:1326–1328. [DOI] [PubMed] [Google Scholar]
- 18.Bush, P. G., and A. C. Hall. 2001. The osmotic sensitivity of isolated and in situ bovine articular chondrocytes. J. Orthop. Res. 19:768–778. [DOI] [PubMed] [Google Scholar]
- 19.Guilak, F., G. R. Erickson, and H. P. Ting-Beall. 2002. The effects of osmotic stress on the viscoelastic and physical properties of articular chondrocytes. Biophys. J. 82:720–727. [DOI] [PMC free article] [PubMed] [Google Scholar]
- 20.Yim, E. K., S. W. Pang, and K. W. Leong. 2007. Synthetic nanostructures inducing differentiation of human mesenchymal stem cells into neuronal lineage. Exp. Cell Res. 313:1820–1829. [DOI] [PMC free article] [PubMed] [Google Scholar]
- 21.Yim, E. K., and K. W. Leong. 2005. Significance of synthetic nanostructures in dictating cellular response. Nanomedicine. 1:10–21. [DOI] [PubMed] [Google Scholar]
- 22.Yim, E. K., R. M. Reano, S. W. Pang, A. F. Yee, C. S. Chen, and K. W. Leong. 2005. Nanopattern-induced changes in morphology and motility of smooth muscle cells. Biomaterials. 26:5405–5413. [DOI] [PMC free article] [PubMed] [Google Scholar]
- 23.Mishchenko, M. I., L. D. Travis, and J. W. Hovenier, editors. 2000. Light Scattering by Nonspherical Particles: Theory, Measurements and Applications. Academic Press, San Diego and London.
- 24.Mourant, J. R., T. M. Johnson, V. Doddi, and J. P. Freyer. 2002. Angular dependent light scattering from multicellular spheroids. J. Biomed. Opt. 7:93–99. [DOI] [PubMed] [Google Scholar]
- 25.Ingber, D. E. 2003. Mechanobiology and diseases of mechanotransduction. Ann. Med. 35:564–577. [DOI] [PubMed] [Google Scholar]
- 26.Estes, B. T., J. M. Gimble, and F. Guilak. 2004. Mechanical signals as regulators of stem cell fate. Curr. Top. Dev. Biol. 60:91–126. [DOI] [PubMed] [Google Scholar]


