Abstract
Actomyosin-based cortical contractility is a common feature of eukaryotic cells and is involved in cell motility, cell division, and apoptosis. In nonmuscle cells, oscillations in contractility are induced by microtubule depolymerization during cell spreading. We developed an ordinary differential equation model to describe this behavior. The computational model includes 36 parameters. The values for all but two of the model parameters were taken from experimental measurements found in the literature. Using these values, we demonstrate that the model generates oscillatory behavior consistent with current experimental observations. The rhythmic behavior occurs because of the antagonistic effects of calcium-induced contractility and stretch-activated calcium channels. The model makes several experimentally testable predictions: 1), buffering intracellular calcium increases the period and decreases the amplitude of cortical oscillations; 2), increasing the number or activity of stretch activated channels leads to an increase in period and amplitude of cortical oscillations; 3), inhibiting Ca2+ pump activity increases the period and amplitude of oscillations; and 4), a threshold exists for the calcium concentration below which oscillations cease.
INTRODUCTION
Actomyosin-based contractility is common to eukaryotic cells, but the mechanisms by which cortical contractility is regulated remain to be fully elucidated. The phenomenon of cell blebbing that occurs during cell migration (1), cell division (2), and apoptosis (3) provides a window into the dynamics of the acto-myosin cortex during contraction (4). The membrane protrusions produced by blebbing initially contain no actin or myosin and are thought to be a result of local pressure exerted by cortical contractility (5,6). In fact, drugs that inhibit actin or myosin inhibit blebbing (4). In suspended cells, larger membrane bulges that also contain no actin or myosin, and that oscillate from one region of the cell to the other, can be induced by microtubule depolymerization (7,8).
We have induced a similar oscillating morphology in spreading cells by microtubule depolymerization (9), demonstrating that it is sufficient to induce rhythmic actomyosin-based contractions. Such oscillations with well-defined periods suggest that complex phenomena like these might be fertile ground to explore theoretical explanations of the interactions of the microfilament-microtubule systems that would give rise to such global behavior. Indeed, recently we used a coarse-grained method, causal mapping (CMAP) (10), to determine the system components and interactions needed to produce cortical oscillations. CMAP analysis suggested that the mechanism underlying the observed cortical oscillations relies on a time-delayed negative feedback loop. This leads to one possible molecular mechanism based on the earlier suggestions of Pletjushkina et al. (9): microtubule depolymerization increases the level of active Rho (a member of the small GTPase family), which partially inhibits myosin light chain phosphatase (MLCP) activity, and therefore results in an increase of phosphorylated myosin light chain (p-MLC) concentration and a basal level of cortex contractility.
Our model is based on the hypothesis that an excess of cortical contractility, by squeezing the cytoplasm, produces local regions of extension. This extension activates mechanosensitive channels in the plasma membrane and produces a calcium influx, which in turn stimulates additional actomyosin contractility via the calmodulin-myosin light chain kinase (MLCK) pathway and tends to close stretch-activated calcium channels. This leads to diminished intracellular calcium levels and an eventual reduction in contractility, demonstrating negative feedback. The delay between the closing of the channels and reduced contractility causes the system to overshoot the mechanical equilibrium in which contractile forces are balanced by cytosolic pressure, and oscillations ensue.
Guided by the CMAP analysis, we developed a mechanistic model for cortical oscillations that couples the biochemical pathways that regulate myosin activity to the contractile forces generated by the motor protein. Using parameter values obtained from the literature, our computational analysis reveals that the model is consistent with currently available experimental data on cortical oscillations. Additionally, the model makes several testable experimental predictions that motivate future experimental investigations.
METHODS
Computational
The model of cortical oscillations is based on a set of 11 ordinary differential equations (ODEs) containing 36 parameters (see Model Development for details). A description of the parameters and the values used in the simulations is given in Table 1. Table 1 also lists the references from which the parameter values were taken. The equations were numerically solved using XPPAUT, a simulation and analysis software package freely available and downloadable from http://www.math.pitt.edu/∼bard/xpp/xpp.html. The integration method used to solve the equations was fourth-order Runge-Kutta with a step size of 1 ms.
TABLE 1.
Model parameters
| Parameter | Definition | Value | Source | |
|---|---|---|---|---|
| Rate constants for reactions | On, μM−1 s−1 | Off, s−1 | ||
| k1, k−1 |
 C-term C-term |
2.8 | 1.5 | (22) |
| k2, k−2 |
 N-term N-term |
180 | 480 | (22,65) |
| k3, k−3 |
 C/N-term C/N-term |
28 | 3 | (22,65) |
| k4, k−4 |  |
18 | 2.8 | (22,65,66) |
| k5, k−5 |  |
28 | 0.03 | (22,65) |
| k6, k−6 |  |
0.2 | 0.25 | (22,65,66) |
| k7, k−7 | [CaMBuff] ↔ [CaM] × [Buff] | 5 | 25 | (33–35) |
| Enzyme kinetics | Km, μM | kcat, s−1 | ||
| Km_MLCK |  |
10 | 2.7 | (35,67,68) |
| kcat_MLCK | ||||
| Km_MLCP | pMLC + MLCP → MLC | 15 | 1.6 | (35,69,70) |
| kcat_MLCP | ||||
| Vpmca, Kpmca | PMCA kinetics | 0.3 | 3 | (14,15,71) |
| Initial concentration parameters | μM | |||
| Ca0 | Free calcium initial concentration | 0.1 | ||
| MLCK | Initial concentration of inactive MLCK | 5 | (35,72) | |
| CaM | Free calmodulin initial concentration | 1 | (33,34) | |
| MLC | Myosin light chain initial concentration | 50 | (73) | |
Experimental
Swiss 3T3 fibroblasts (American Type Culture Collection, Rockville, MD) were cultured under standard conditions (DMEM supplemented with 10% fetal bovine serum, at 37°C with 5% CO2), with and without antibiotics in the medium (50 U/ml streptomycin and 50 U/ml penicillin). Cells were then plated on glass bottom 35 mm microcells (MatTek, Ashland, MA) with 1 μg/ml of colcemid to depolymerize the microtubules. After 20 min, the majority of cells were attached to the substratum. The behavior of nearly 500 cells was monitored at 10 s intervals for 6 h on a Diaphot 300 microscope (Nikon, Melville, NY) using phase contrast imaging and MetaMorph software (Molecular Devices, Sunnyvale, CA).
EXPERIMENTAL OBSERVATIONS
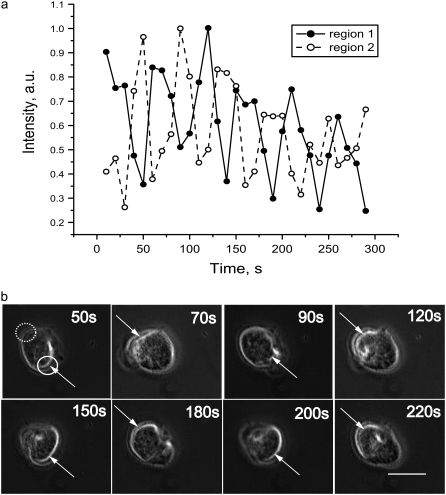
We monitored the behavior of nearly 500 cells over 6 h after depolymerization of the microtubules. Most cells initially undergo a swaying motion (Supplementary Material, Movie S1). This may be due to the cell searching the substratum to establish points of adhesion. After this preliminary period, ∼15% of the cells spread in a normal fashion, whereas ∼70% transitioned to large amplitude oscillations. The form of this oscillatory motion can be roughly divided into two categories: linear motion along a single axis (Fig. 1 b) or circular motion around a fixed point (see Data S1). Individual cells often transitioned between these two behaviors or changed the orientation of the axis along which the linear oscillations occur. Some cells stopped oscillating and then suddenly started again at a later time.
FIGURE 1.
Time dependence of the phase contrast brightness intensity for a single cell after microtubule depolymerization. (a) The relative brightness of opposite regions of the cell was determined from images recorded at 10 s intervals. The data represent an average of the intensities measured within the cellular regions shown in the first panel of b. To produce these time series, the background intensity was subtracted and the resulting time-series normalized to have a maximum of 1. The time courses begin 48 min after plating. The oscillation period for this cell is ∼50 s. The time-series demonstrate that opposite ends of cell contract out-of-phase. (b) Selected images corresponding to the time points shown in a. The first panel shows the regions from which the intensity measurements were made. Each image represents a time point at which one of the two regions is at a maximum as indicated by the white arrows. The bar in the last panel represents 20 μm.
Interestingly, cells undergoing linear oscillations displayed a back-and-forth motion in which opposite ends of the cell appear to oscillate out of phase. To quantify this behavior and determine the oscillation period, we measured the image intensity of two opposing regions of cells undergoing linear pulsations. This analysis revealed that the opposite ends of the cell do indeed oscillate with a phase shift of 180° (Fig. 1 a, Movie S2). To determine the oscillation period, a Fourier transform of 21 cells grown with 0.2 mM streptomycin in the medium, and which oscillated linearly along the same axis for 1 h or longer, was performed. Using this approach, the average period was found to be 48.1 ± 9.92 s, which is in reasonable agreement with our earlier results using 0.2 mM streptomycin (9).
Streptomycin has been found to be a possible blocker of stretch-activated channels (SAC) in cardiac myocytes, neurons and hair cells (11). Repeating our experiments in the absence of streptomycin (Movie S3), we found that roughly the same number of cells oscillate (80%) as do with streptomycin. Most significantly, the oscillation period was notably longer without streptomycin, 68.7 ± 13.47 s, than with streptomycin, 48.1 ± 9.92 s.
DESCRIPTION OF THE MODEL
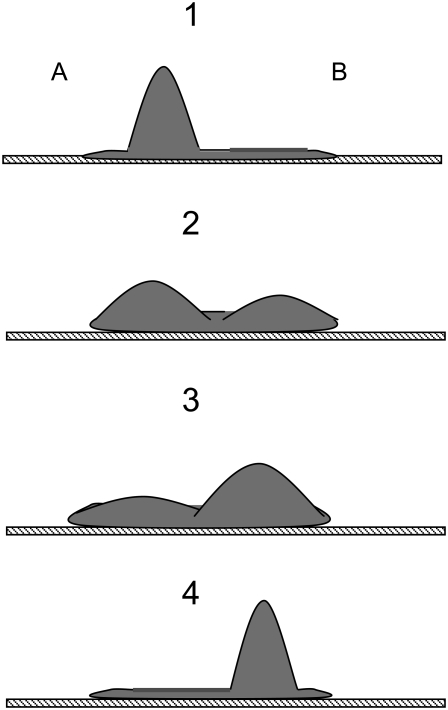
As described in the previous section, when cells undergo linear oscillations, the movement of their opposing ends is out of phase (Fig. 1). Fig. 2 shows a schematic cartoon of this behavior. We assume that during these oscillations the cell volume does not change appreciably. We also assume that local pressure gradients within the cell equilibrate rapidly in comparison to the period of the cortical oscillations. Qualitatively, this means that if internal forces (e.g., myosin-mediated contractility) cause one region of the cell to shrink, this contraction is quickly balanced by an expansion of an opposing region. These assumptions imply that during cortical oscillations the cytosolic pressure remains approximately constant both temporally and spatially, and therefore we do not explicitly take into account movement of the cytosol in our model. Because we assume constant cell volume with opposite regions of the cell 180° out of phase, we can accurately model the oscillatory phenomenon with one region of the cell (Fig. 2).
FIGURE 2.
(Panel 1) Microtubule depolymerization produces a nonuniform increase in contractility resulting in a local protrusion of the cell membrane. The extension of region A activates mechanosensitive channels in the plasma membrane and produces a calcium influx, which in turn stimulates actomyosin contractility. (Panels 2 and 3) The additional contractility tends to force cytosol into region B, thereby reducing the membrane extension and closing the mechanosensitive calcium channels. This leads to a decrease in intracellular calcium levels and an eventual reduction in contractility (negative feedback). (Panel 4) Region B expands sufficiently to initiate another round of calcium-induced contractility, and the process repeats.
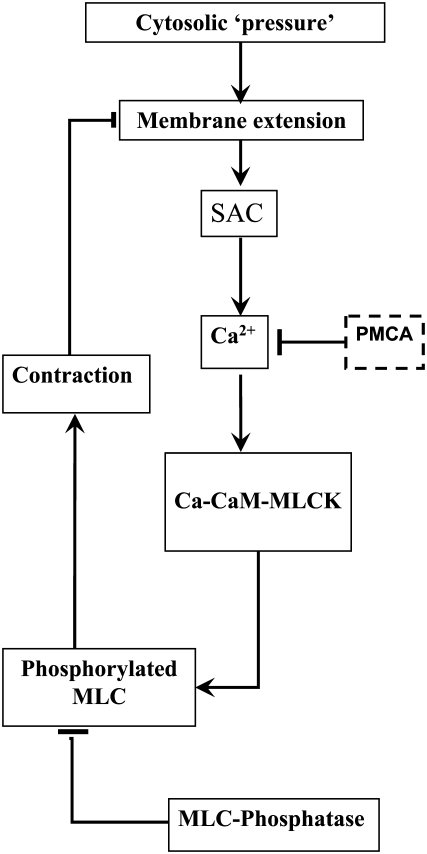
A schematic diagram of our proposed mechanism for cortical oscillations is shown in Fig. 3. Microtubule depolymerization is known to increase levels of the active small G-protein, RhoA. RhoA activates Rho-kinase, which phosphorylates and deactivates myosin light chain phosphatase (MLCP). One mechanism by which MLCP negatively regulates myosin, and hence contractility, is by dephosphorylating and deactivating p-MLC (12,13). Therefore, the net effect of microtubule depolymerization is to elevate basal levels of contractility. It is reasonable to assume that an increase in contractility generates a slight increase in the cell's cytosolic pressure. Furthermore, if the increased contractility does not act uniformly, the cell will become deformed with bulges developing in regions where contractility remains low (Fig. 1 b and Fig. 2).
FIGURE 3.
Schematic diagram for the mechanism of cortical oscillations. Oscillations are initiated by a local expansion of the membrane that results from increased cytosolic pressure after microtubule depolymerization. This local extension produces a calcium influx via stretch-activated channels (SAC), which increases the calcium concentration in cytosol. The increased calcium levels stimulate actomyosin contractility via the calmodulin (CaM)-MLCK pathway. The increased contractility retracts the membrane and closes the SACs, thus providing a negative feedback loop. Removal of calcium via calcium pumps leads to a decrease in contractility allowing another cycle to begin.
The stretching of the membrane in region A results in the opening of SAC producing an influx of calcium. Intracellular calcium stimulates actomyosin contractility via the calmodulin- MLCK pathway. The calcium-induced contractility in region A overcomes RhoA-activated contractility in region B and the cytosol is forced back into B. This movement of the cytosol causes the SACs in region A to close, and therefore acts as a negative feedback that counteracts calcium-induced contractility. However, if there is a delay between when the SACs close and the reuptake of calcium, the contractility will not diminish until region B has expanded sufficiently to initiate another round of calcium-induced contractility, and the process repeats. In this way, the cell body undergoes large scale oscillations about a fixed reference point.
Experimentally we have found that the contractility of regions A and B are 1/2 period out of phase with one another. We therefore simplify the model and avoid describing the spatial aspects of this behavior throughout the cell by explicitly modeling the behavior of only one region.
We built a mathematical model to determine whether the mechanism described above can generate oscillatory behavior consistent with the experimental observations when physiological parameter values are used. While the model does not attempt to include all levels of biological detail, we believe that it does capture the most important features and basic properties of this complex biological system.
MODEL DEVELOPMENT
In this section, we describe all the components of the mathematical model. The full set of mathematical equations is given in the Appendix.
Calcium activation of contractility
Because calcium is a second messenger involved in many cellular processes, it is critical that intracellular calcium concentrations [Ca2+] are tightly regulated and kept at low basal levels of ∼0.1 μM. There are several intracellular mechanisms that maintain a low calcium concentration in the cytosol. In our model, we consider only one of them: ATP-dependent Ca2+ pumps (PMCA) in the plasma membrane. The ATP-dependent calcium flux JPMCA is modeled by a Hill equation (14,15)
 |
(1) |
where VPMCA is the maximal activity of the pump and KPMCA is the activation concentration. The Hill coefficient is taken to be 2 (16).
To maintain finite calcium levels during resting conditions, a constant calcium leak, L, through plasma membrane was included in the model. The value of L was determined by requiring that, in the resting state, [Ca2+] = 0.1 μM. These considerations, in conjunction with the rapid buffering approximation (17), lead to the equation for the cytosolic calcium concentration
 |
(2) |
where the Ri([Ca2+]) values represent the various reactions involving calcium (see below), JSAC is the calcium flux through SACs (see below), and f = 0.01 is the fraction of free Ca2+ in the cell (16).
Upon entering the cytoplasm, calcium can bind to calmodulin. The x-ray crystal structure of calmodulin with four bound Ca2+ ions shows two globular domains with similar conformations, each containing two helix-loop-helix Ca binding sites (C- and N-terminals) (18). The N-terminal sites have fast Ca2+ association and dissociation rates (∼2 × 10⁸ M−1 s−1) and (400 s−1) (19), respectively, which are 170-fold faster than the corresponding rates for C-terminal binding sites (2.3 × 10⁶ M−1 s−1 and 2.4 s−1). Therefore, to simplify the model, we assumed that Ca2+ ions bind and dissociate in pairs, one pair from each domain.
Calcium binding to calmodulin induces a conformational change that exposes hydrophobic surfaces that interact with target molecules, such as myosin light chain kinase (MLCK) with nM affinity (20–25). Although there are a lot of experimental data for the calmodulin interaction with MLCK, there is no consensus on the sequence of calcium-calmodulin-MLCK binding events. Until recently, it was generally assumed that Ca2+ free calmodulin or calmodulin with a single pair of calcium ions does not bind to its targets (20). New experimental evidence suggests that  complexes and even Ca2+ free calmodulin (CaM) can interact with MLCK (22,23,26). However, the Kd for the calcium free CaM/MLCK interaction was shown to be in the 1–10 μM range, which is ∼1000 higher then the Kd values for CaM binding when either singly or doubly occupied with calcium (Kd = 1–8 μM) (27,28). Therefore, in our model, we assume that calcium free CaM does not interact with MLCK. The activation of MLCK upon binding calmodulin may occur only after both calmodulin domains are loaded with calcium (29).
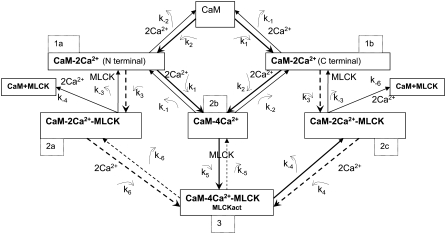
The first step in calcium-induced contractility is the binding of CaM with two Ca2+ ions on the C- or N-terminals (Fig. 4, panels 1 a and 1 b). Assuming that binding to the N- and C-domains is independent, the reaction for this process is
 |
We investigated scenarios in which calmodulin with a single pair of calcium ions could either bind to MLCK or was prohibited from interacting with this protein. Both cases produce similar results. We focus on the more general reaction scheme in which calmodulin with a single pair of Ca2+ ions can interact with calmodulin. (Fig. 4, panels 2 a and 2 c). Therefore, the following two reactions involving CaM-Ca2+ are possible:
 |
 |
The third step of our kinetic scheme produces active MLCK (Fig. 4, panel 3) through the two reactions:
 |
 |
MLCK binding to CaM reduces the rate of Ca2+ dissociation from N-terminal sites ∼200-fold and from C-terminal sites ∼20-fold. This ensures that calmodulin-regulated enzymes remain active after transiently elevated Ca levels have subsided. The initial MLCK concentration was taken as [MLCK] = 5 μM (30).
FIGURE 4.
Schematic diagram of the biochemical pathway involving Ca2+, calmodulin, and MLCK. The model considers all possible reactions for the binding of pairs of calcium ions to the C- and N-terminals of calmodulin. The model also allows binding between MLCK and CaM with a single pair of calcium ions.
To model MLCK phosphorylation of MLC, we used Michaelis-Menten kinetics. The initial MLC concentration was taken to be [MLC0 ] = 50 μM (30,31). Our model does not consider protein turnover. That is, the total MLC concentration is assumed to be conserved. Therefore, the unphosphorylated form is given by [MLC] = [MLC0 ] – [p-MLC] where [p-MLC] is the concentration of phosphorylated MLC.
The effect of calmodulin buffering
Although CaM is found in most cell types at high concentrations (possibly >50 μM), experimental evidence indicates that the level of free CaM available for Ca binding is substantially lower (32,33). Using various techniques, the level of free CaM in the cytoplasm of resting cells has been estimated to be between 0.25 and 3 μM. We investigated the system's behavior with and without buffering of calmodulin. The model with buffering allowed binding and release of free calmodulin from buffering proteins. This effect was taken into account by the equations
 |
(3) |
where the Ri(CaM) values are the different reactions involving calmodulin; [CaMBuff] is a concentration of buffer-calmodulin compound, [Buff] is concentration of free buffer.
The initial concentration of free calmodulin was taken to be 1 μM (25,33,34). The rate constants that govern the CaM flux between the buffer and solution were tuned to keep [CaM] = 1 μM in resting cells (35). In the model without calmodulin buffering, the total calmodulin concentration was assumed to be constant at 1 μM. Simulation results for this case were similar to those which included buffering.
Modeling membrane dynamics
Biological membranes possess unique mechanical properties resulting from their laminar composite structure that combines two states of matter: the liquid crystal membrane bilayer and the polymer cytoskeletal network (36–38). We assume that in response to applied forces, the cell behaves as an elastic body. The shape of the cell is determined by the membrane-cortex complex and the viscous behavior of the cytoplasm. As noted in the Model Description, our model only considers one of the two regions shown in Fig. 2. We consider region A and approximate this region as a sphere with radius R. The thickness of the membrane is very small in comparison to the radius of region A and therefore can be neglected. Thus, the membrane is assumed to be an infinitely thin sheet of isotropic material without bending resistance. In reality, changes in the area of the membrane are local (e.g., blebbing) and stochastic, but for our model we assume that differences in tension only occur between the two regions shown in Fig. 2.
We assume that four mechanical forces are responsible for changing the membrane area:
A constant force Fcyt generated by the osmotic/hydrostatic pressure inside the cell. We assume that any pressure gradients within the cell equilibrate rapidly in comparison to the period of the oscillations and that during these oscillations the cell volume remains constant. Therefore, Fcyt is a constant.
A passive force Fmemb resulting from the elasticity of the membrane. This force is proportional to the changes of membrane area (see below).
An active contractile force Fcont resulting from actin and myosin interactions. This force is time-dependent and taken to be proportional to the concentration of active myosin.
A viscous force Fvisc due to interactions between the membrane and the surrounding medium. This force is characterized by the friction coefficient γ.
The resulting force balance is
 |
(4) |
The membrane elasticity is characterized by elastic moduli for bending and stretching (37). We only consider the component of the elasticity which resists changing of the membrane surface area. In an elastic membrane, the membrane tension T associated with the induced change in surface area (ΔA) is proportional to this change
 |
(5) |
where KA is the membrane elasticity coefficient and A0 is a resting membrane area. We assume that the stiffness of the membrane is constant over the range of applied forces considered in the model so that KA is also a constant. Typical values of KA range between 102 and 103 mN/m depending on the cholesterol content of the bilayer (39). The force Fmemb is related to Tmemb through Laplace's law
 |
(6) |
The force Fcont is produced by actin/myosin contractility and acts to reduce the effective radius R. We assume that the contractility forces are directly proportional to the concentration of phosphorylated myosin, [p-MLC],
 |
(7) |
where fcont is the force developed by 1 μM of phosphorylated MLC. It has been estimated experimentally that one molecule of myosin can produce a force of roughly 3–5 pN. Therefore, the maximal amount of force that can be developed in a cell with radius = 10 μm and a concentration of active (phosphorylated) p-MLC of 1 μM is F = fmyos × [p-MLC] × NA × Vcell ≈ 10 μN, where NA is the Avogadro's constant, fmyos = 4 pN is the force generated by a single myosin molecule and Vcell is the cell volume. In theory, if all myosin molecules ([MLC] = 50μM) are active and generating force in a cooperative manner, then the maximum possible force that can be produced is Fmax = F × [p-MLC] = 500 μN.
The last term in the force balance given by Eq. 4, Fcyt, can be interpreted as follows. Interactions between the cytoskeleton and cellular membrane play a central role in determining cell shape and tissue integrity. Normally, cells experience a small outward pressure that results from hydrostatic/osmotic pressure and possibly contractile forces generated by the cortical cytoskeleton (40,41). Therefore, when the membrane bilayer separates from the cytoskeleton, it normally extends outward. For the purpose of our model, it is only important that the Fcyt tends to drive the membrane outward and that the increased contractility generated by microtubule depolymerization tends to increase Fcyt.
The above considerations lead to the following equation for the radius of region A,
 |
(8) |
where
 |
(9) |
The viscous drag due to the cytosol can be estimated as γ = 100 mN × s × m−1 from experimental results (42–44). Using this value, R0 = 10 μm and Ka = 140 mN × m−1, we estimate Kelas = 0.35 s−1 μm−2. The value of Kcont should not exceed the maximum level Kcont < fcont/γ = 102 μm s−1 μM−1.
Modeling stretch-activated channels
The most likely candidates for mediating Ca2+ changes in response to depolymerization of microtubules appears to be stretch-activated ion channels (SAC). Stretch-activated cation channels were originally discovered by Guharay and Sachs (45). These channels exhibit conformational changes in response to membrane tension and, through mediation of ion transport, may provide a link between a mechanical stimulus and a biochemical response (46–48).
It is generally agreed that mechanosensitive channels respond to membrane tension rather than pressure. A simple way to model the effects of tension on the conductivity of the channel is through use of a Boltzmann factor in which the free energy depends linearly on membrane tension. However, the dependence on tension may be nonlinear when the elastic properties of the membrane depend on the applied tension (49). If there are N total SACs, then the calcium flux is computed as
 |
(10) |
where Popen is a probability that the channel is open and j is the average current through a single channel. The density of SACs in the membrane was estimated by different authors as 0.1–2 μm−2 (46–48,50,51). In our model we assume the SAC density is 0.5 μm−2, and for a cell with radius 10 μm, N = 600. At resting potential, the Ca2+ current through the SAC was estimated to be 0.35 pA (50). This parameter value, together with the conversion coefficient from calcium current to calcium concentration,
 |
where F is Faraday's constant and V is a cell volume, were used in our simulation.
We modeled the SAC as a two-state channel with open and closed probabilities Popen and Pclosed. These probabilities are determined by the relationships
 |
(11) |
where ΔG is the free energy difference between the two states. This implies
 |
(12) |
To model the change in free energy, we use the approach proposed by Sachs and co-workers (47,49), in which
 |
(13) |
and where Tmemb is the tension, ΔG(0) is the difference in free energy at zero tension, and ΔZmsc is the difference in area between the closed and open channels. This leads to the following expression for the open probability:
 |
(14) |
Under the assumption that the probability of a channel being open at zero tension is 10−3, where K0 = 1000, then ΔG(0) = 7 kT. The membrane tension is calculated from Eq. 5.
The membrane tension required for half-activation of SAC is on the order of several dynes/cm (10−3 N/m) (48,51). Such forces can be produced by differences in transmembrane osmolarity of a few milliOsmols (39,52). A lipid bilayer resists stretching with relatively high elasticity coefficient estimated to be between 102 and 103 dynes/cm (53). Therefore, a membrane expansion of 3–5% is sufficient for half-activation of SACs (48,54). Using crystallographic structure and computational data, the membrane channel area, which increases upon opening of the channel, was estimated to be ∼1–10 nm2 (52,55). If we assume that at the half-activation point the membrane expansion is 4% and the elasticity coefficient KA is ∼140 mN × m−1, then ΔZmsc = 5 nm2.
RESULTS
In this section, we demonstrate that the mechano-chemical model developed above is sufficient to explain the experimentally observed cortical oscillations.
Steady-state conditions
Table 1 gives a list of the model parameters and the values used to generate the results presented in this manuscript. Nearly all the parameter values (34 out of 36) listed in Table 1 were taken from measurements reported in the literature. The value of the leak current for calcium to enter the cell was chosen by requiring that the model produce physiological levels of intracellular calcium under resting conditions. Using a leak current of 0.08 μM/s and [MLCP] = 10 μM produced a steady-state calcium concentration 0.1 μM. The concentration of active MLCK under this condition is 0.01 μM and the concentration of phosphorylated MLC is 0.016 μM.
Microtubule depolymerization leads to sustained contractility oscillations
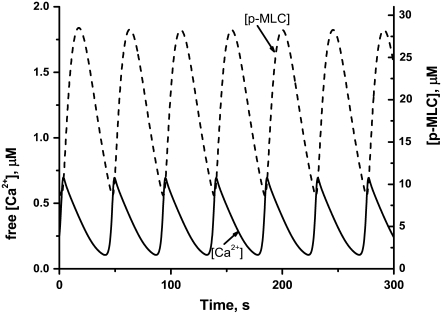
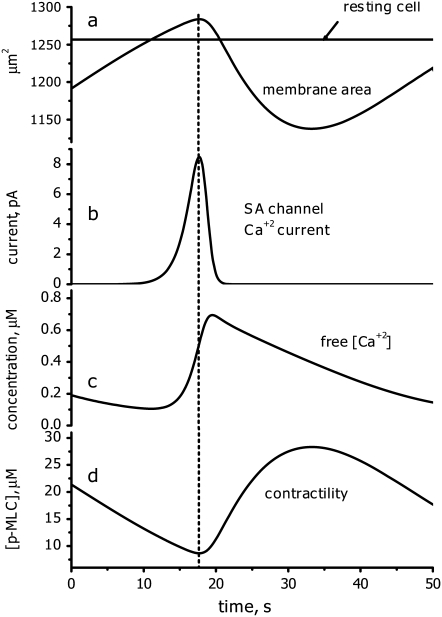
Experimental evidence indicates that microtubule depolymerization produces a decrease in MLC phosphatase through the RhoA pathway (12,13). Therefore, to simulate microtubule depolymerization, the concentration of active MLCP was decreased from 10 to 2 μM. According to our model, increased contractility should generate additional cytosolic pressure. To model this effect, Kcyt was increased from 0 to 25 μm s−1. These perturbations cause the system to undergo sustained oscillations (Fig. 5). The model works as follows: Cytosol moving into region A due to increased contractility in region B causes the membrane to expand (Fig. 6, curve a). This leads to the opening of SACs (Fig. 6, curve b), which, in turn, generates an influx of calcium (Fig. 6, curve c). Increased calcium levels activate myosin (Fig. 6, curve d), generating sufficient contractility to reduce the membrane area. This causes the SACs to close. However, intracellular calcium and thus active myosin levels remain transiently elevated after the closing of SACs. This allows the membrane area to contract below its equilibrium value in which regions A and B have equal volume. Eventually, intracellular calcium levels are depleted and contractility is reduced. This causes region A to expand again, overshooting its equilibrium value, and the cycle repeats.
FIGURE 5.
Time-series showing oscillations in the concentrations of Ca2+ ions (solid line) and phosphorylated MLC (dashed line). The results represent numerical simulations of the model equations (see Appendix) using the basic set of parameter values (Table 1) and [MLCP] = 1 μM, Kcyt = 25 μm/s; Kcont = 2 μm μM−1 s−1.
FIGURE 6.
One period of the oscillatory behavior. Graphs a–d demonstrate the temporal relationship between changes in membrane area, SAC current, [Ca2+], and contractility (see text for details).
Comparison with experimental results
The model produces oscillations with a period of 47.6 s, which is in very good agreement with the experimentally measured period of 48.1 s. The model is consistent with several other experimental observations (9):
The addition of a Rho kinase inhibitor immediately abolishes the oscillatory behavior. In our model, inhibition of Rho kinase increases levels of active MLC phosphatase. As shown later in Fig. 8, when active MLC phosphatase levels are increased beyond 5 μM, oscillations cease.
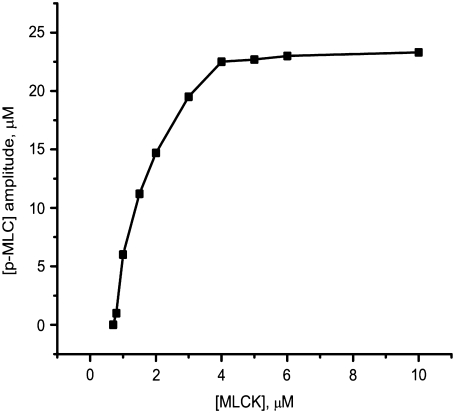
When an inhibitor of myosin light chain kinase, ML-7, was added to oscillating cells, the oscillations stopped after 10 min. Consistent with this behavior, our model predicts that oscillations do not occur below an MLCK concentration level of 1 μM (see Fig. 10).
When an inhibitor of actin polymerization was added to oscillating cells, the pulsations immediately stopped until the inhibitor was removed from the medium. The effect of inhibiting actin polymerization can be modeled by decreasing the parameter Kcont, which models the membrane tension caused by 1 μM of myosin molecules moving along the actin filaments. Reducing Kcont from 2 μm s−1 μM−1, to 0.7 μm s−1 μM−1, causes the oscillations to cease.
Our experimental data indicate that when streptomycin is removed from the medium, the period of the cortical oscillations increases. Streptomycin is a known inhibitor of SAC activity. Therefore, to model the experiment in which streptomycin is removed, we increased the activity of the SACs by 10-fold. This increase caused the period of the oscillations to increase from 47.8 s to 58.2 s, which is in very good agreement with our experimental results.
FIGURE 8.
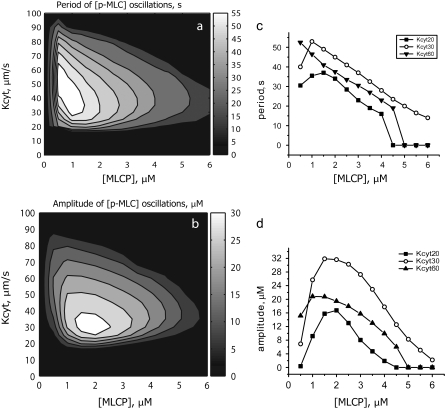
Contour plots (a and b) and selected cross sections (c and d) of the oscillation period and amplitude as a function of Kcyt and MLCP. When Kcyt is between 20 and 50 μm/s, oscillations occur over a range of MLCP concentrations from 1 to 6 mM. The maximum amplitude occurs near MLCP = 2 μM and Kcyt = 25–30 μm/s. Smaller concentrations of MLCP produce longer oscillation periods.
FIGURE 10.
The predicted effect of the MLCK level on the amplitude of the phosphorylated MLC concentration during cortical oscillations.
Parameter analysis
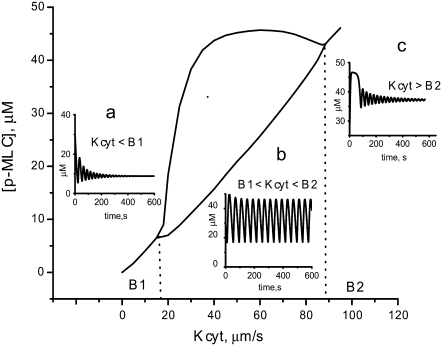
Two key parameters for which we were unable to find values reported in the literature are Kcyt, which characterizes the cytosolic pressure, and the concentration of active MLC phosphatase after microtubules depolymerization. Therefore, we investigated how robust the oscillations are to changes in these two parameters. Fig. 7 shows a single parameter bifurcation diagram for Kcyt with the MLC phosphatase concentration fixed at 2 μM. If the cytosolic pressure is too weak to generate a significant expansion of the membrane, the small amount of calcium that enters the cell can be efficiently removed and only damped oscillations are produced (Fig. 7, inset a). As Kcyt is increased past the critical value B1 (B1 = 17 μm/s for this set of parameters), regular oscillations ensue (Fig. 7, inset b). Eventually Kcyt becomes sufficiently large (>B2 = 90 μm/s) to overcome myosin-based contractility, causing the SACs to remain open, and abolishes oscillations (Fig. 7, inset c). The wide region of Kcyt value for which oscillations occur indicates that the oscillations are robust to the choice of Kcyt.
FIGURE 7.
A single parameter bifurcation diagram for Kcyt with the MLC phosphatase concentration fixed at 2 μM. The values of Kcyt labeled B1 and B2 are the bifurcation points. Between B1 and B2, oscillations occur (inset b). In this region, the two curves shown in the figure represent the maximum and minimum values achieved by the concentration during the oscillations. If Kcyt < B1, only damped oscillations are produced (inset a). Eventually Kcyt becomes sufficiently large (>B2) to overcome myosin-based contractility abolishing oscillations (inset c).
We next investigated the region of parameter space for which oscillations of phosphorylated MLC occur when both Kcyt and the MLC phosphatase concentration are varied. Fig. 8 shows contour plots of the amplitude and period of the [p-MLC] oscillations, respectively, as a function of these two parameters. When Kcyt lies between 20 and 50 μm/s, oscillations occur over a range of MLC phosphatase concentrations from 1–6 μM. The upper range of 6 μM is comparable to MLCP concentration in normal cells. The amplitude is maximum near [MLCP] = 2 μM and Kcyt = 25–35 μm/s and decreases rapidly as Kcyt is reduced (Fig. 8, a and d). The oscillation period depends more strongly on [MLCP] than on Kcyt value. This dependence is almost linear (Fig. 8 c), with smaller concentrations of active MLCP generating longer periods.
While most of the kinetic parameter values used in the model were taken from published experimental results, the accuracy and range of these values varies greatly and many measurements were made in cell types other than fibroblasts. Therefore, we performed a sensitivity analysis using the approach proposed by Wolf et al. (56) to investigate how the behavior of the system depends on the choice of parameter values. Sensitivity analysis reveals parameters whose values critically affect the behavior of the system and those to which the system is relatively insensitive. By determining which perturbations have the largest effect on the system, this analysis provides a guide for future experiments.
The sensitivity coefficients, Cp, for the oscillation period are defined as
 |
(15) |
where T is the period, p is the parameter being perturbed, Δp is difference between the perturbed and unperturbed parameter value, and ΔT is the induced change in the oscillation period. Thus, the sensitivity coefficient represents the ratio of the relative change in the period to the relative change in the parameter value. Similarly, we used the sensitivity coefficients for the oscillation amplitude A, which are given by
 |
(16) |
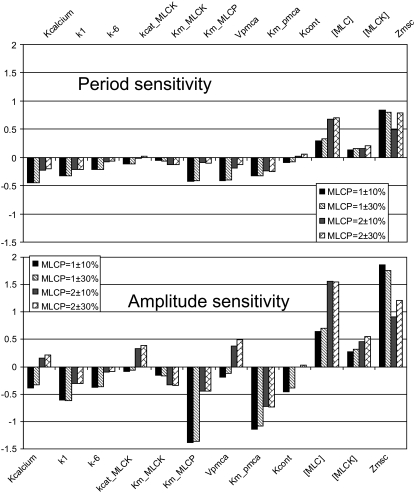
Sensitivity coefficients with small absolute values indicate parameters that, when perturbed, produce only minor effects on the system's behavior, whereas large absolute values indicate high sensitivity. The sign of the sensitivity coefficient indicates whether the change in the amplitude or period positively or negatively correlates with the change in the parameter value. All parameters were varied by ±10% and ±30% from the values reported in Table 1, and CP and CA were calculated from time series of the phospho-MLC concentration. The sensitivity coefficients were computed for Kcyt = 25 μm/s at two values of total [MLC], 2 μM and 1 μM. The value of 2 μM maximizes the amplitude of the oscillations (see Fig. 8 c),whereas, at 1 μM, the amplitude is 65% of the maximum. All of the above parameter variations maintain the oscillation behavior.
A subset of the results from the sensitivity analysis, illustrating the highest coefficients, is presented in Fig. 9 (see Data S1 for the complete set). From this figure, we see that for many parameters the system is much less sensitive to variations when the total MLC phosphatase concentration is 2 μM. This indicates that, under this condition, the system is located near a local maximum of the oscillation amplitude. The difference between 10 and 30% variation is small for the majority of parameters, which demonstrates the linearity of the system's response to changes of these parameters around the reference values. The sensitivity analysis also revealed that the period is more stable to variations in the parameters values than is the amplitude. The average sensitivity coefficients for the oscillation period were 0.16 for [MLCP] = 1 μM and 0.11 for [MLCP] = 2 μM, whereas for the amplitude, the average sensitivity coefficients were 0.33 and 0.26, respectively. The majority of the sensitivity coefficients have values of <0.1 for both amplitude and period, which indicates the robustness of our model to these parameters (Data S1).
FIGURE 9.
The system's sensitivity to variations in selected model parameter values. The sensitivity coefficients were evaluated using the basic values listed in Table 1 both for [MLCP] = 2 μM, where the oscillation amplitude is a maximum, and [MLCP] = 1 μM, which corresponds to 65% of maximum amplitude. The sensitivity coefficients for changes in the period and amplitude were calculated using ±10% and ±30% variations in each of the model parameters.
The parameters Km_PMCA (Michaelis constant for PMCA) and Km_MLC_Phos (Michaelis constant for MLC deactivation) have the largest negative impact on the amplitude. An increase in either of these produces a decrease in amplitude. These parameters also have negative effects on the oscillation period, though not as significantly as on the amplitude. The parameter KbufCa, which determines the portion of unbuffered calcium present in the system, has a significant impact on the oscillation period: smaller coefficients produce oscillations with greater periods. Interestingly, this parameter has a negative impact on the amplitude for low [MLCP] and a positive impact for higher concentrations. The same type of effect on the amplitude is demonstrated by kcat_MLCK (catalytic constant for active MLCK) and Vpmca (maximum activity for PMCA pump). The parameter Vpmca also has significant impact on the oscillation period; increases in Vpmca shorten the period.
The two parameters which have a major positive impact on the amplitude and period are total concentration of myosin light chains ([MLC]) and difference in the surface area between open and closed SACs (ΔZmsc). The first parameter, [MLC], has an obvious impact on the amplitude of [p-MLC]. Our analysis shows that, near the maximum amplitude, its significance is amplified: 10% increase in [MLC] produces 15% increase in [p-MLC].
The last parameter in the set, ΔZmsc, indicates the relation between membrane tension and calcium influx. The high sensitivity to this parameter is mostly due to exponential dependence on this parameter used in the model. It is worthwhile to mention that sensitivity coefficients for SAC average current /density are very low (Data S1).
Overall, the low sensitivity of the system to changes in the majority of the parameter values (see Data S1) indicates that the oscillations are a robust property of the system when physiologically realistic parameter values are used.
Model predictions
According to our model, the most important characteristic that differentiates normal cells from cells in which the microtubules have been depolymerized is that elevated levels of RhoA act to decrease the active MLC phosphatase concentration, thereby increasing myosin-based contractility. A key prediction of this model is that feedback mechanisms do not act on RhoA and therefore the active RhoA concentration should remain constant after microtubule depolymerization. This prediction can be tested using biosensors that recognize the GTP-bound form of RhoA (57). Fig. 8 shows that cell oscillations occur over a range of MLC phosphatase concentrations from 1 to 6 μM. The amplitude is a maximum near [MLCPhos] = 2 μM. Therefore, the model predicts that a partial knockdown of MLC phosphatase will increase the amplitude of the cortical oscillations, whereas near complete silencing should abolish the oscillations.
According to experimental data, the concentration of myosin light chain kinase (MLCK) in resting cells is between 3 and 10 μM. Our computational analysis reveals that reducing MLCK from 10 to 4 μM has little impact on the oscillatory behavior (Fig. 10). Subsequent decreases in the MLCK concentration to levels <4 μM lead to a rapid decrease in the oscillation amplitude, with oscillations finally abolished at 0.8 μM. The reason oscillations are lost is that for MLCK concentrations <4 μM, calmodulin binding to MLCK becomes rate-limiting and not enough myosin can be activated to generate sustained oscillations.
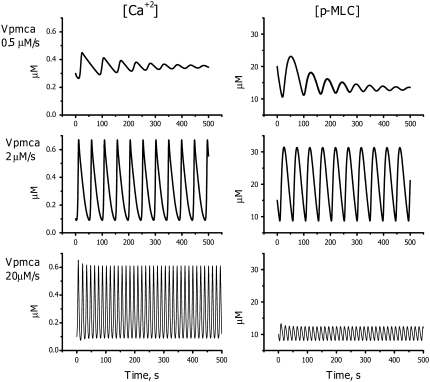
Another parameter that significantly affects the oscillatory behavior is the maximum uptake rate Vpmca of the calcium pumps. Increasing Vpmca strongly increases the frequency of oscillation and produces opposite effects on the calcium and phospho-MLC concentrations (Fig. 11). The calcium amplitude remains almost unchanged, whereas the higher oscillation frequency significantly decreases the amount of phosphorylated MLC during each oscillation (Fig. 11, bottom panels). Oscillations are terminated at high and low pumping rates.
FIGURE 11.
Predicted effects of PMCA activity on the phosphorylated MLC and free calcium concentrations: Vpmca = 0.5 mM/s (top panels), Vpmca = 2.0 mM/s (middle panels), and Vpmca = 20 mM/s (bottom panels).
DISCUSSION
The cytoskeleton is responsible for the internal mechanics of the cell (e.g., cytokinesis and vesicle transport) as well as mechanical interactions with the environment (e.g., cell migration) (58). One way to view the cytoskeleton is that it resides in various states or phases and can transition between these states (59). Cytoskeletal systems do undergo periodic oscillations and these provide an important window into how the complex system is regulated (60). For example, mechanical oscillations of spindle poles, observed in asymmetrically dividing cells, have been postulated to occur because of the interaction of astral microtubules and cortical force generators (61). Hair cells undergo spontaneous oscillations that are thought to arise from the interplay of mechanosensitive ion channels, myosin motors, and a calcium-mediated feedback mechanism that regulates contractility (62). More closely related to the work presented here, Sheetz and co-workers (63) found that advancing cells exhibit periodic lamellipodial contractions (period ∼24 s) that correlate with retrograde actin waves. These workers speculated that the waves transported a signal from the tip of the lamellipod to its base which then activated the next contraction cycle. Ponti et al. (64) found a similar periodicity in slowly advancing cells but the period was ∼100 s.
To fully understand such complex cellular behavior requires mathematical modeling. Therefore, our goal was to develop a mechano-chemical model for the oscillatory behavior of spreading cells after microtubule depolymerization. The model was used to interpret basic experimental observations (9):
Nonmuscle cells such as spreading fibroblast and epithelial cells oscillate when treated by colcemid or nocodazole.
In addition to oscillations in cell morphology, intracellular calcium concentrations were also observed to oscillate.
Inhibition of Rho kinase terminated the oscillations.
These observations led Pletjushkina et al. (9) to hypothesize that both the calcium and Rho pathways were involved in generating the observed oscillations. Later, the hypothesis was initially checked for feasibility by a new course-grained approach, causal mapping (CMAP) (10), which predicted a negative feedback from cell contractility to membrane stretching. This analysis motivated the development of a detailed mechanochemical model based on ordinary differential equations. Our experimental results indicated that, during the oscillations, opposite ends of the cell oscillate exactly out-of-phase. This observation allowed us to only consider one end of the cell, thereby reducing the number of equations needed to model the oscillations (see Figs. 1 and 2). The model includes only the basic elements we believe are necessary for oscillatory behavior.
Our model predicts that the period of cortical oscillations positively correlates with free calcium influx. Consistent with this prediction, when streptomycin, a known inhibitor of SAC activity, was removed from the medium, we observed an increase in the oscillation period. Streptomycin is commonly used in cell culture media, but very little is known about its role in the regulation of fibroblast ion channels. Therefore, to model the effect of removing streptomycin, we simply increased the activity of the SAC channels by 10. This change did not fully capture the experimentally observed increase in the period, but the good qualitative agreement provides strong evidence to support the role of SACs in cortical oscillations.
Robustness
The model consists of 36 parameters that (except for two, Kcyt and Kcont) were taken from the literature (Table 1). The model accurately captures the oscillation frequency and produces behavior consistent with other experimental observations. We performed sensitivity analysis to confirm that the oscillatory regime does not requite a specific choice of parameters but, instead, fills an essential volume in the parameter space.
ODE model as CMAP validation
While the description and explanation of existing experimental data was the main goal of this article, our results have another important implication. The scheme shown in Fig. 3 was predicted by a new coarse-grained approach called CMAP (10). Therefore, validation of this novel method is of great importance. The CMAP approach is easier to use than mechano-chemical modeling in that it treats all model elements the same way. It only requires the causal relationships between components of the model. That is, the CMAP only takes into account which elements influences which other elements, and to what extent. The price of such simplifications is the loss of detailed information about the system's behavior. Nevertheless, it is a useful tool for generating hypotheses and testing ideas and should have broad applicability in complex cell biological systems. In this work we validated the CMAP approach using a traditional, ordinary differential model. The two approaches give consistent descriptions of cortical oscillations. Final validation of the model will require further experimental investigation, including testing predictions of the model, which are in progress.
Our model successfully describes current experimental data on cortical oscillations but, like any mathematical model, has its limitations and room for further development. First, even though most of the parameters were taken from literature, the sources often give different values for the same parameters and the final choice is up to the modeler. Even so, the robustness analysis gives fair confidence that qualitatively the model remains correct but, to be completely compelling, will require that the model predictions be tested. Second, we took advantage of the experimentally observed symmetry of the system (see 2-D scheme in Fig. 2) and reduced the modeling to a dimensionless case by considering only one part of the oscillating cell. In the future, the spatial aspect of the oscillation should be accounted for. This includes diffusion of the components as well as the role of the cell membrane shape. Third, we limited the source of calcium to the extracellular space. It is not clear whether SACs could significantly change the Ca2+ concentration inside the cell.
Future experiments and modeling are necessary to more quantitatively determine the calcium concentration and the role of endoplasmic reticulum Ca2+ stores in the oscillatory behavior. Finally, we have observed behavior (not shown) that suggests that cell-substrate interactions play an important role in the phenomenon and should be included in the future modeling.
SUPPLEMENTARY MATERIAL
To view all of the supplemental files associated with this article, visit www.biophysj.org.
Supplementary Material
Acknowledgments
This work was supported by National Institutes of Health No. GM073180 and Cell Migration Consortium No. GM64346.
APPENDIX: MODEL EQUATIONS
In this Appendix we present the full set of mathematical equations that describes the model of cortical oscillations. A description of all the model parameters and the values used in the simulations is given in Table 1.
The equation for the concentration of free Ca2+, [Ca], is given by
 |
(17) |
In the above equation, the flux through the ATP-dependent calcium pumps, JPMCA, has the form
 |
(18) |
and the flux through the stretch-activated channels, JSAC, is given by
 |
(19) |
where the membrane tension is calculated as
 |
(20) |
The calcium/calmodulin/myosin light chain kinase complexes considered in the model are shown in Fig. 4. This figure also lists the rate constants for transitions between the various chemical states. The following equations govern the concentrations of the various complexes.Concentration CaM with one pair of Ca2+ ions [Ca2NCaM]:
 |
(21) |
Concentration of CaM with two pairs Ca2+ and bound to MLCK [Ca2NCaM_MLCK]:
 |
(22) |
Concentration of CaM with two pairs of Ca2+ ions [Ca4CaM]:
 |
(23) |
Concentration of active MLCK [MLCKact]:
 |
(24) |
Calmodulin concentration [CaM]:
 |
(25) |
The equation for the concentration of active myosin, [p-MLC], is given by
 |
(26) |
and the equation for the effective radius, R, of region A is
 |
(27) |
In the above equations, the concentration of inactive MLCK is found from the conservation relationship
 |
(28) |
where MLCK0 is initial concentration of MLCK.
Editor: Alexander Mogilner.
References
- 1.Trinkaus, J. 1973. Surface activity and locomotion of Fundulus deep cells during blastula and gastrula stages. Dev. Biol. 30:69–103. [DOI] [PubMed] [Google Scholar]
- 2.Fishkind, D. J., L. G. Cao, and Y. L. Wang. 1991. Microinjection of the catalytic fragment of myosin light chain kinase into dividing cells: effects on mitosis and cytokinesis. J. Cell Biol. 114:967–975. [DOI] [PMC free article] [PubMed] [Google Scholar]
- 3.Mills, J. C., N. L. Stone, J. Erhardt, and R. N. Pittman. 1998. Apoptotic membrane blebbing is regulated by myosin light chain phosphorylation. J. Cell Biol. 140:627–636. [DOI] [PMC free article] [PubMed] [Google Scholar]
- 4.Charras, G. T., C.-K. Hu, M. Coughlin, and T. J. Mitchison. 2006. Reassembly of contractile actin cortex in cell blebs. J. Cell Biol. 175:477–490. [DOI] [PMC free article] [PubMed] [Google Scholar]
- 5.Cantiello, H. F., A. G. Prat, J. V. Bonventre, C. C. Cunningham, J. H. Hartwig, and D. A. Ausiello. 1993. Actin-binding protein contributes to cell volume regulatory ion channel activation in melanoma cells. J. Biol. Chem. 268:4596–4599. [PubMed] [Google Scholar]
- 6.Charras, G. T., J. C. Yarrow, M. A. Horton, L. Mahadevan, and T. J. Mitchison. 2005. Non-equilibration of hydrostatic pressure in blebbing cells. Nature. 435:365–369. [DOI] [PMC free article] [PubMed] [Google Scholar]
- 7.Paluch, E., C. Sykes, J. Prost, and M. Bornens. 2006. Dynamic modes of the cortical actomyosin gel during cell locomotion and division. Trends Cell Biol. 16:5–10. [DOI] [PubMed] [Google Scholar]
- 8.Bornens, M., M. Paintrand, and C. Celati. 1989. The cortical microfilament system of lymphoblasts displays a periodic oscillatory activity in the absence of microtubules: implications for cell polarity. J. Cell Biol. 109:1071–1083. [DOI] [PMC free article] [PubMed] [Google Scholar]
- 9.Pletjushkina, O., Z. Rajfur, P. Pomorski, T. Oliver, J. Vasiliev, and K. Jacobson. 2001. Induction of cortical oscillations in spreading cells by depolymerization of microtubules. Cell Motil. Cytoskeleton. 48:235–244. [DOI] [PubMed] [Google Scholar]
- 10.Weinreb, G. E., T. C. Elston, and K. Jacobson. 2006. The causal map as a tool to mechanistically interpret phenomena in cell motility: application to cortical oscillations in spreading cells. Cell Motil. Cytoskeleton. 63:523–532. [DOI] [PubMed] [Google Scholar]
- 11.Shen, M.-R., C. Y. Chou, and W. T. Chiu. 2003. Streptomycin and its analogues are potent inhibitors of the hypotonicity-induced Ca2+ entry and Cl− channel activity. FEBS Lett. 554:494–500. [DOI] [PubMed] [Google Scholar]
- 12.Schoenwaelder, S. M., and K. Burridge. 1999. Evidence for a calpeptin-sensitive protein-tyrosine phosphatase upstream of the small GTPase Rho—a novel role for the calpain inhibitor calpeptin in the inhibition of protein-tyrosine phosphatases. J. Biol. Chem. 274:14359–14367. [DOI] [PubMed] [Google Scholar]
- 13.Kimura, K., M. Ito, M. Amano, K. Chihara, Y. Fukata, M. Nakafuku, B. Yamamori, J. H. Feng, T. Nakano, K. Okawa, A. Iwamatsu, and K. Kaibuchi. 1996. Regulation of myosin phosphatase by Rho and Rho-Associated kinase (Rho-kinase). Science. 273:245–248. [DOI] [PubMed] [Google Scholar]
- 14.Yano, K., O. H. Petersen, and A. V. Tepikin. 2004. Dual sensitivity of sarcoplasmic/endoplasmic Ca2+-ATPase to cytosolic and endoplasmic reticulum Ca2+ as a mechanism of modulating cytosolic Ca2+ oscillations. Biochem. J. 383:353–360. [DOI] [PMC free article] [PubMed] [Google Scholar]
- 15.Silva, H. S., A. Kapela, and N. M. Tsoukias. 2007. A mathematical model of plasma membrane electrophysiology and calcium dynamics in vascular endothelial cells. Am. J. Physiol. Cell Physiol. 293:C277–C293. [DOI] [PubMed] [Google Scholar]
- 16.Keizer, J. 2005. Computational Cell Biology. C. Fall, E. Marland, J. Tyson, and J. Wagner, editors. Springer, New York.
- 17.Wagner, J., and J. Keizer. 1994. Effects of rapid buffers on Ca2+ diffusion and Ca2+ oscillations. Biophys. J. 67:447–456. [DOI] [PMC free article] [PubMed] [Google Scholar]
- 18.Fallon, J. L., and F. A. Quiocho. 2003. A closed compact structure of native Ca2+-calmodulin. Structure. 11:1303–1307. [DOI] [PubMed] [Google Scholar]
- 19.Johnson, J. D., R. J. Nakkula, C. Vasulka, and L. B. Smillie. 1994. Modulation of Ca2+ exchange with the Ca2+-specific regulatory sites of troponin-C. J. Biol. Chem. 269:8919–8923. [PubMed] [Google Scholar]
- 20.Gallagher, P. J., B. P. Herring, and J. T. Stull. 1997. Myosin light chain kinases. J. Muscle Res. Cell Motil. 18:1–16. [DOI] [PubMed] [Google Scholar]
- 21.Kato, S., T. Osa, and T. Ogasawara. 1984. Kinetic model for isometric contraction in smooth muscle on the basis of myosin phosphorylation hypothesis. Biophys. J. 46:35–44. [DOI] [PMC free article] [PubMed] [Google Scholar]
- 22.Johnson, J. D., C. Snyder, M. Walsh, and M. Flynn. 1996. Effects of myosin light chain kinase and peptides on Ca[IMAGE] exchange with the N- and C-terminal Ca. Binding sites of calmodulin. J. Biol. Chem. 271:761–767. [DOI] [PubMed] [Google Scholar]
- 23.Krueger, J. K., N. A. Bishop, D. K. Blumenthal, G. Zhi, K. Beckingham, J. T. Stull, and J. Trewhella. 1998. Calmodulin binding to myosin light chain kinase begins at substoichiometric Ca2+ concentrations: a small-angle scattering study of binding and conformational transitions. Biochemistry. 37:17810–17817. [DOI] [PubMed] [Google Scholar]
- 24.Geguchadze, R., G. Zhi, K. S. Lau, E. Isotani, A. Persechini, K. E. Kamm, and J. T. Stull. 2004. Quantitative measurements of Ca2+/calmodulin binding and activation of myosin light chain kinase in cells. FEBS Lett. 557:121–124. [DOI] [PubMed] [Google Scholar]
- 25.Isotani, E., G. Zhi, K. S. Lau, J. Huang, Y. Mizuno, A. Persechini, R. Geguchadze, K. E. Kamm, and J. T. Stull. 2004. Real-time evaluation of myosin light chain kinase activation in smooth muscle tissues from a transgenic calmodulin-biosensor mouse. Proc. Natl. Acad. Sci. USA. 101:6279–6284. [DOI] [PMC free article] [PubMed] [Google Scholar]
- 26.Wilson, D. P., C. Sutherland, and M. P. Walsh. 2002. Ca2+ activation of smooth muscle contraction - Evidence for the involvement of calmodulin that is bound to the triton-insoluble fraction even in the absence of Ca2+. J. Biol. Chem. 277:2186–2192. [DOI] [PubMed] [Google Scholar]
- 27.Brown, S. E., S. R. Martin, and P. M. Bayley. 1997. Kinetic control of the dissociation pathway of calmodulin-peptide complexes. J. Biol. Chem. 272:3389–3397. [DOI] [PubMed] [Google Scholar]
- 28.Fajmut, A., M. Brumen, and S. Schuster. 2005. Theoretical model of the interactions between Ca2+, calmodulin and myosin light chain kinase. FEBS Lett. 579:4361–4366. [DOI] [PubMed] [Google Scholar]
- 29.Heller, W. T., J. K. Krueger, and J. Trewhella. 2003. Further insights into calmodulin-myosin light chain kinase interaction from solution scattering and shape restoration. Biochemistry. 42:10579–10588. [DOI] [PubMed] [Google Scholar]
- 30.Lin, P.-J., K. Luby-Phelps, and J. T. Stull. 1997. Binding of myosin light chain kinase to cellular actin-myosin filaments. J. Biol. Chem. 272:7412–7420. [DOI] [PubMed] [Google Scholar]
- 31.Somlyo, A. P., and A. V. Somlyo. 2003. Ca2+ sensitivity of smooth muscle and nonmuscle myosin II: modulated by g proteins, kinases, and myosin phosphatase. Physiol. Rev. 83:1325–1358. [DOI] [PubMed] [Google Scholar]
- 32.Persechini, A., and B. Cronk. 1999. The relationship between the free concentrations of V and Ca2+calmodulin in intact cells. J. Biol. Chem. 274:6827–6830. [DOI] [PubMed] [Google Scholar]
- 33.Tran, Q.-K., D. J. Black, and A. Persechini. 2003. Intracellular coupling via limiting calmodulin. J. Biol. Chem. 278:24247–24250. [DOI] [PubMed] [Google Scholar]
- 34.Torok, K., D. J. Cowley, B. D. Brandmeier, S. Howell, A. Aitken, and D. R. Trentham. 1998. Inhibition of calmodulin-activated smooth-muscle myosin light-chain kinase by calmodulin-binding peptides and fluorescent (phosphodiesterase-activating) calmodulin derivatives. Biochemistry. 37:6188–6198. [DOI] [PubMed] [Google Scholar]
- 35.Lukas, T. J. 2004. A signal transduction pathway model prototype II: application to Ca2+-calmodulin signaling and myosin light chain phosphorylation. Biophys. J. 87:1417–1425. [DOI] [PMC free article] [PubMed] [Google Scholar]
- 36.Petrov, A. G., and P. N. R. Usherwood. 1994. Mechanosensitivity of cell membranes—ion channels, lipid matrix and cytoskeleton. Eur. Biophys. J. Biophys. Lett. 23:1–19. [DOI] [PubMed] [Google Scholar]
- 37.Zimmerberg, J., and M. M. Kozlov. 2006. How proteins produce cellular membrane curvature. Nat. Rev. Mol. Cell Biol. 7:9–19. [DOI] [PubMed] [Google Scholar]
- 38.Morris, C. E., and U. Homann. 2001. Cell surface area regulation and membrane tension. J. Membr. Biol. 179:79–102. [DOI] [PubMed] [Google Scholar]
- 39.Martinac, B. 2004. Mechanosensitive ion channels: molecules of mechanotransduction. J. Cell Sci. 117:2449–2460. [DOI] [PubMed] [Google Scholar]
- 40.Dai, J. W., and M. P. Sheetz. 1999. Membrane tether formation from blebbing cells. Biophys. J. 77:3363–3370. [DOI] [PMC free article] [PubMed] [Google Scholar]
- 41.Sheetz, M. P. 2001. Cell control by membrane-cytoskeleton adhesion. Nat. Rev. Mol. Cell Biol. 2:392–396. [DOI] [PubMed] [Google Scholar]
- 42.Herant, M., W. A. Marganski, and M. Dembo. 2003. The mechanics of neutrophils. Synthetic modeling of three experiments. Biophys. J. 84:3389–3413. [DOI] [PMC free article] [PubMed] [Google Scholar]
- 43.Bausch, A. R., F. Ziemann, A. A. Boulbitch, K. Jacobson, and E. Sackmann. 1998. Local measurements of viscoelastic parameters of adherent cell surfaces by magnetic bead microrheometry. Biophys. J. 75:2038–2049. [DOI] [PMC free article] [PubMed] [Google Scholar]
- 44.Drury, J. L., and M. Dembo. 2001. Aspiration of human neutrophils. Effects of shear thinning and cortical dissipation. Biophys. J. 81:3166–3177. [DOI] [PMC free article] [PubMed] [Google Scholar]
- 45.Guharay, F., and F. Sachs. 1984. Stretch-activated single ion channel currents in tissue-cultured embryonic chick skeletal-muscle. J. Phys. (London). 352:685–701. [DOI] [PMC free article] [PubMed] [Google Scholar]
- 46.Munevar, S., Y.-l. Wang, and M. Dembo. 2004. Regulation of mechanical interactions between fibroblasts and the substratum by stretch-activated Ca2+ entry. J. Cell Sci. 117:85–92. [DOI] [PubMed] [Google Scholar]
- 47.Sachs, F., and C. E. Morris. 1998. Mechanosensitive ion channels in nonspecialized cells. Rev. Physiol. Biochem. Pharmacol. 132:1–77. [DOI] [PubMed] [Google Scholar]
- 48.Sackin, H. 1995. Mechanosensitive channels. Annu. Rev. Physiol. 57:333–353. [DOI] [PubMed] [Google Scholar]
- 49.Markin, V. S., and F. Sachs. 2004. Thermodynamics of mechanosensitivity: lipid shape, membrane deformation and anesthesia. Biophys. J. 86:370A. [Google Scholar]
- 50.Zou, H., L. M. Lifshitz, R. A. Tuft, K. E. Fogarty, and J. J. Singer. 2002. Visualization of Ca2+ entry through single stretch-activated cation channels. Proc. Natl. Acad. Sci. USA. 99:6404–6409. [DOI] [PMC free article] [PubMed] [Google Scholar]
- 51.Sachs, F. 1988. Mechanical transduction in biological systems. CRC Crit. Rev. Biomed. Eng. 16:141–169. [PubMed] [Google Scholar]
- 52.Suchyna, T. M., S. E. Tape, R. E. Koeppe, O. S. Andersen, F. Sachs, and P. A. Gottlieb. 2004. Bilayer-dependent inhibition of mechanosensitive channels by neuroactive peptide enantiomers. Nature. 430:235–240. [DOI] [PubMed] [Google Scholar]
- 53.Hamill, O. P., and B. Martinac. 2001. Molecular basis of mechanotransduction in living cells. Physiol. Rev. 81:685–740. [DOI] [PubMed] [Google Scholar]
- 54.Charras, G. T., B. A. Williams, S. M. Sims, and M. A. Horton. 2004. Estimating the sensitivity of mechanosensitive ion channels to membrane strain and tension. Biophys. J. 87:2870–2884. [DOI] [PMC free article] [PubMed] [Google Scholar]
- 55.Sukharev, S. I., W. J. Sigurdson, C. Kung, and F. Sachs. 1999. Energetic and spatial parameters for gating of the bacterial large conductance mechanosensitive channel MscL. J. Gen. Physiol. 113:525–540. [DOI] [PMC free article] [PubMed] [Google Scholar]
- 56.Wolf, J., S. Becker-Weimann, and R. Heinrich. 2005. Analyzing the robustness of cellular rhythms. Syst. Biol. (Stevenage). 2:35–41. [DOI] [PubMed] [Google Scholar]
- 57.Pertz, O., L. H. Richard, L. Klemke, and K. M. Hahn. 2006. Spatiotemporal dynamics of RhoA activity in migrating cells. Nature. 440:1069–1072. [DOI] [PubMed] [Google Scholar]
- 58.Heidemann, S., and D. Wirtz. 2004. Towards a regional approach to cell mechanics. Trends Cell Biol. 14:160–166. [DOI] [PubMed] [Google Scholar]
- 59.Dobereiner, H.-G., B. Dubin-Thaler, G. Giannone, H. Xenias, and M. Sheetz. 2004. Dynamic phase transitions in cell spreading. Phys. Rev. Lett. 93:108105. [DOI] [PubMed] [Google Scholar]
- 60.Kruse, K., and F. Julicher. 2005. Oscillations in cell biology. Curr. Opin. Cell Biol. 17:20–26. [DOI] [PubMed] [Google Scholar]
- 61.Grill, S. W., J. Howard, E. Shaffer, E. H. Stelzer, and A. A. Hyman. 2003. The distribution of active force generators controls mitotic spindle position. Science. 301:518–521. [DOI] [PubMed] [Google Scholar]
- 62.Falcke, M., Y. Li, J. D. Lechleiter, and P. Camacho. 2003. Modeling the dependence of the period of intracellular Ca2+ waves on SERCA expression. Biophys. J. 85:1474–1481. [DOI] [PMC free article] [PubMed] [Google Scholar]
- 63.Giannone, G., G. Dubin-Thaler, H.-G. Dobereiner, N. Kieffer, A. Bresnick, and M. Sheetz. 2004. Periodic lamellipodial contractions correlate with rearward actin waves. Cell. 116:431–443. [DOI] [PubMed] [Google Scholar]
- 64.Ponti, A., M. Machacek, S. L. Gupton, C. M. Waterman-Storer, and G. Danuser. 2004. Two distinct actin networks drive the protrusion of migrating cells. Science. 305:1782–1786. [DOI] [PubMed] [Google Scholar]
- 65.Kasturi, R., C. Vasulka, and J. D. Johnson. 1993. Ca2+, caldesmon, and myosin light chain kinase exchange with calmodulin. J. Biol. Chem. 268:7958–7964. [PubMed] [Google Scholar]
- 66.Fajmut, A., M. Jagodic, and M. Brumen. 2005. Mathematical modeling of the myosin light chain kinase activation. J. Chem. Inf. Model. 45:1605–1609. [DOI] [PubMed] [Google Scholar]
- 67.Ikebe, M., S. Reardon, J. P. Schwonek, C. R. Sanders II, and R. Ikebe. 1994. Structural requirement of the regulatory light chain of smooth muscle myosin as a substrate for myosin light chain kinase. J. Biol. Chem. 269:28165–28172. [PubMed] [Google Scholar]
- 68.Lukas, T. J. 2004. A signal transduction pathway model prototype I: from agonist to cellular endpoint. Biophys. J. 87:1406–1416. [DOI] [PMC free article] [PubMed] [Google Scholar]
- 69.Feng, J., M. Ito, Y. Kureishi, K. Ichikawa, M. Amano, N. Isaka, K. Okawa, A. Iwamatsu, K. Kaibuchi, D. J. Hartshorne, and T. Nakano. 1999. Rho-associated kinase of chicken gizzard smooth muscle. J. Biol. Chem. 274:3744–3752. [DOI] [PubMed] [Google Scholar]
- 70.Ichikawa, K., K. Hirano, M. Ito, J. Tanaka, T. Nakano, and D. J. Hartshorne. 1996. Interactions and properties of smooth muscle myosin phosphatase. Biochemistry. 35:6313–6320. [DOI] [PubMed] [Google Scholar]
- 71.Kusters, J. M. A. M., M. M. Dernison, W. P. M. van Meerwijk, D. L. Ypey, A. P. R. Theuvenet, and C. C. A. M. Gielen. 2005. Stabilizing role of calcium store-dependent plasma membrane calcium channels in action-potential firing and intracellular calcium oscillations. Biophys. J. 89:3741–3756. [DOI] [PMC free article] [PubMed] [Google Scholar]
- 72.Weber, L. P., J. E. Van Lierop, and M. P. Walsh. 1999. Ca2+-independent phosphorylation of myosin in rat caudal artery and chicken gizzard myofilaments. J. Physiol. 516:805–824. [DOI] [PMC free article] [PubMed] [Google Scholar]
- 73.Somlyo, A., A. Khromov, M. Webb, M. Ferenczi, D. Trentham, Z.-H. He, S. Sheng, Z. Shao, and A. Somlyo. 2004. Smooth muscle myosin: regulation and properties. Philos. Trans. Roy. Soc. B Biol. Sci. 359:1921–1930. [DOI] [PMC free article] [PubMed] [Google Scholar]
Associated Data
This section collects any data citations, data availability statements, or supplementary materials included in this article.


