

Abstract
To maximize reward and minimize effort, animals must often execute multiple movements in a timely and orderly manner. Such movement sequences must be usually discovered through experience, and during this process, signals related to the animal's action, its ordinal position in the sequence, and subsequent reward need to be properly integrated. To investigate the role of the primate medial frontal cortex in planning and controlling multiple movements, monkeys were trained to produce a series of hand movements instructed by visual stimuli. We manipulated the number of movements in a sequence across trials, making it possible to dissociate the effects of the ordinal position of a given movement and the number of remaining movements necessary to obtain reward. Neurons in the supplementary and presupplementary motor areas modulated their activity according to the number of remaining movements, more often than in relation to the ordinal position, suggesting that they might encode signals related to the timing of reward or its temporally discounted value. In both cortical areas, signals related to the number of remaining movements and those related to movement direction were often combined multiplicatively, suggesting that the gain of the signals related to movements might be modulated by motivational factors. Finally, compared with the supplementary motor area, neurons in the presupplementary motor area were more likely to increase their activity when the number of remaining movements is large. These results suggest that these two areas might play complementary roles in controlling movement sequences.
Keywords: decision making, directional tuning, gain modulation, ordinal position, reinforcement learning, reward, sequence learning, temporal discounting
Introduction
To maximize future rewards, the animals must combine incoming sensory signals appropriately with the knowledge of their environment. Previous anatomical and neurophysiological studies suggest that Brodmann area 6 in the primate brain might be an important node in this process. Anatomically, area 6 lies between and connected to the prefrontal cortex and the primary motor cortex (Leichnetz, 1986; Barbas and Pandya, 1987), and includes the dorsal (F2 and F7) and ventral (F4 and F5) divisions of the premotor cortex as well as the supplementary motor area (SMA) (F3) and presupplementary motor area (pre-SMA) (F6) (Matelli et al., 1985, 1991). Studies based on neurophysiological recordings and lesions have also demonstrated that these areas contribute to multiple aspects of action planning and selection (Picard and Strick, 2001; Rushworth et al., 2004; Hoshi and Tanji, 2007).
The present study focuses on the role of the SMA and pre-SMA in encoding individual movements in a sequence. Lesions or pharmacological inactivation of these cortical areas impair the ability to produce a particular sequence of movements from memory (Luria, 1966; Shima and Tanji, 1998). Furthermore, imaging studies showed that the pre-SMA and SMA are commonly activated during the acquisition and production of sequential movements (Roland et al., 1980; Jenkins et al., 1994; Grafton et al., 1995). In addition, neurons in both cortical areas often change their activity according to the planned movement sequences (Tanji and Shima, 1994; Shima and Tanji, 2000). With respect to sequence learning, the pre-SMA may play a more important role in the learning of new movement sequences than the SMA (Nakamura et al., 1998; Hikosaka et al., 1999). Furthermore, during the planning and execution of movement sequences, neural activity related to the ordinal positions of individual movements in a sequence is more commonly found in the pre-SMA (Clower and Alexander, 1998; Shima and Tanji, 2000). Accordingly, it has been proposed that the pre-SMA might be more involved in regulating the process of linking individual movements in a correct order (Tanji, 2001). In previous studies, however, sequence-related activity in the SMA and the pre-SMA has been characterized with movement sequences of a fixed length, most commonly using sequences of three movements (Clower and Alexander, 1998; Shima and Tanji, 2000). Therefore, neural activity seemingly related to specific ordinal positions in a sequence might be related to the number of movements remaining in a sequence. Indeed, signals related to the number of movements remaining before reward delivery have been identified in several brain areas, including the anterior cingulate cortex (Shidara and Richmond, 2002) and the basal ganglia (Bowman et al., 1996), and might reflect the motivational significance of individual movements. In the present study, we examined the activity of neurons in the SMA and pre-SMA during a behavioral task that varied the number of remaining movements necessary to obtain reward separately from the ordinal position and movement direction. The results showed that neurons in these cortical areas often combine these different types of signals multiplicatively.
Materials and Methods
Animal preparation.
Two male rhesus monkeys (Macaca mulatta; 9–12 kg) were used in this study. For neurophysiological recording, a set of four titanium head posts were attached to the skull during an aseptic surgery for the purpose of fixing the head. After the animal was trained to perform the task with its head fixed, a second surgery was performed in which a titanium recording chamber (18 mm inside diameter) was placed over the skull along the midline ∼2 mm anterior to the genu of the arcuate sulcus. The position of the recording chamber was determined using magnetic resonance images, and was confirmed during the recording experiment according to the physiological criteria described below. All surgical and experimental procedures were approved by the University of Rochester Committee on Animal Research and conformed to the Public Health Service Policy on Humane Care and Use of Laboratory Animals and Guide for the Care and Use of Laboratory Animals.
Behavioral task.
The animals were trained in a manual serial reaction time task (Nissen and Bullemer, 1987; Lee and Quessy, 2003; Lee, 2004), in which they were required to capture a series of visual targets presented on a computer screen by manipulating a joystick (model J50; ETI Systems, Carlsbad, CA) with their right hands (Fig. 1). The number of targets that the animal was required to capture in a trial varied systematically, as described below. The position of the joystick was measured via a 16-bit A/D converter at a sampling rate of 250 Hz, and was shown to the animal with a green cursor (1.9° in diameter) on the screen. The animal's eye position was monitored using a video-based high-speed (225 Hz) eye-tracker (model ET49; Thomas Recording, Giessen, Germany).
Figure 1.

Serial reaction time task. A, Spatiotemporal sequence of the task. Each frame shows a visual target (gray disk) and the feedback cursor (black dot). B, Four different target paths and four rewarded locations (gray squares). The asterisk indicates the path shown in D. C, An example sequence consisting of six movements that ends in the rewarded location in the top left corner of the grid. The thick line corresponds to the first movement in the sequence. D, Another example sequence in which NRM for the first movement (thick arrow) remains ambiguous (1 or 7) before the onset of the third target.
Throughout the experiment, the computer screen displayed nine blue squares arranged in a 3 × 3 grid on a black background (Fig. 1A). The target for each movement was a red disc (4.8° in diameter), and was presented at the center of a blue square (9.1 × 9.1°). After the first target was presented in a given trial, the animal was required to capture it with the feedback cursor within 10 s. Otherwise, the same target appeared again after a 1 s intertrial interval. After the animal successfully kept the cursor within the target region for 0.5 s (hold time), it was extinguished and a new target was presented in one of the adjacent squares. The animal was required to capture the new target within 2 s and hold it for a 0.5 s hold time. This was repeated several times. If the animal failed to capture any target within 2 s time limit or to hold it for the 0.5 s hold time, the trial was aborted without reward, and the same sequence of targets was presented again in the next trial. When the animal completed the trial successfully by capturing all the targets in a given sequence, the animal was rewarded with a drop of apple juice (∼0.4 ml). Accordingly, the position of the last target in a given trial is referred to as the rewarded location.
In the present study, a series of targets presented in a given trial and the corresponding movements is referred to as a sequence. A sequence was determined by the following three factors; (1) rewarded location, which was chosen from one of the four corners of the grid; (2) sequence length, which was defined as the number of movements in a given trial; and (3) path, which was defined as one of four alternative cyclical patterns of target locations (Fig. 1B). Rewarded location and path were pseudorandomly chosen and fixed in a block of trials. In contrast, the sequence length could be 2, 4, 6, or 8, and varied pseudorandomly across trials in a given block. In most trials, sequence length was determined by the location of the first target in a trial, because the path and rewarded location were fixed for all trials in a given block. For example, if the first target appeared at the bottom left corner of the grid for the path shown in Figure 1C, the sequence length for this trial would be 6. However, if the first target appeared at the center square of the grid in some blocks (Fig. 1D), this could be consistent with two alternative sequences consisting of two and eight movements, respectively. Within a block, each sequence length was repeated five times, resulting in 20 trials in a block. In each session, all possible combinations of different rewarded locations and paths were presented, which corresponded to 16 blocks (320 trials) and 1600 movements. The order of blocks was randomized for each session, and block transitions were not signaled by any sensory cues.
Neurophysiological recording.
Single-unit activity was recorded extracellularly from the neurons in the SMA and pre-SMA of the left hemisphere in each animal, using a 16-channel multielectrode recording system (Thomas Recording). In most recording sessions, we used eight electrodes, and on average recorded 2.7 neurons simultaneously. Spikes were sorted on-line using a Plexon multichannel acquisition processor (Plexon, Dallas, TX). In one animal (monkey J), the border between the SMA and pre-SMA was determined based on the locations of electrode penetrations in which twitches in the orofacial muscles were evoked by microstimulation (pulse duration, 250 μs; train duration, 100 ms; current, 50 μA; repetition rate, 300 Hz) while the animal was lightly sedated with ketamine (<1.2 mg · kg−1 · h−1). This corresponded closely to the border that divides the neurons with visual and somatosensory responses identified during recording sessions (Mitz and Wise, 1987; Matsuzaka et al., 1992; Lee and Quessy, 2003). In the other animal (monkey D), the border between the SMA and pre-SMA was determined based solely on the distribution of neurons with somatosensory and visual responses. Neurons in the SMA were recorded 1–5 mm posterior to the SMA/pre-SMA border, whereas neurons in the pre-SMA were recorded 1–6 mm anterior to the border. Neurons were included in the analysis only if they were recorded for at least 90% of the complete data set (288 trials or 1440 movements).
Analysis of behavioral data.
Only the behavioral data obtained concurrently with neural data were included in the analysis. For each movement, reaction time was defined as the interval between the time of target onset and the time when the cursor exited from the previous target. We tested whether the animal's reaction time was influenced by the ordinal position (OP) of the movement, the number of remaining movements (NRM) that the animal was required to produce before reward after the current movement, and the distance (D) between the current target and the rewarded location. Because the movements toward the first targets were not controlled, they were excluded from this analysis, and the first movements (i.e., OP = 1) refer to the movements directed toward the second target in each sequence. Therefore, NRM  SL − OP, where SL is the sequence length. SL varied across trials, so the effects OP and NRM could be evaluated separately. The effects of these multiple variables on reaction time was evaluated using the following linear regression model:
where RTi is the reaction time for the ith movement in a given session, and NRMi and OPi are the number of remaining movements and the ordinal position of the same movement, respectively. Di refers to the distance between the target for the ith movement and the rewarded location in the same trial, normalized by the center-to-center distance between the two neighboring target locations in the grid. ΔDi refers to the change in the distance between the target and the rewarded location. In other words, denoting the normalized distance between the previous target and the rewarded location as Di
− 1, ΔDi
Di − Di
− 1. For example, for the movement indicated by the thick line in Figure 1C, NRM = 5, OP = 1, D = 1, and ΔD = −1. Finally, a0∼a4 denote the regression coefficients. This model was applied to the entire dataset as well as separately to the data obtained from individual sessions. The movements with ambiguous NRM (Fig. 1D) were excluded from this regression analysis.
Analysis of neural data.
To determine whether the activity of a given neuron changed significantly across different movement direction, a one-way ANOVA was applied to the spike counts during a 500 ms interval beginning 250 ms before target onset. Next, we evaluated the effects of NRM and OP on the activity of each neuron. As described in Results, reaction times varied systematically according to NRM and OP. Therefore, neural activity related to the variability in the movement kinematics could be potentially mistaken for signals related to NRM or OP. To control for this possibility, we analyzed the effects of NRM and OP on neural activity after the effects of kinematic variables, such as hand position and velocity, were factored out. Assuming a Poisson distribution for the spike counts, we applied the following generalized linear model (Christensen, 1997; Hatsopoulos et al., 2007):
where SCi(t) is the number of spikes between t and t + 50 ms relative to the onset of the target for the ith movement in a given recording session, E[x] is the expected value for x, and t changed in steps of 50 ms from 250 ms before target onset to 200 ms after target onset. The use of exponential function in the above equation reflects the assumption that the spike counts are distributed according to the Poisson distribution with the mean of mi(t). Xi(t) is a column vector consisting of kinematic data, including horizontal and vertical joystick positions at time t, horizontal and vertical joystick velocities sampled every 50 ms from t − 500 ms to t + 500 ms, horizontal and vertical eye positions at time t, and horizontal and vertical eye velocities sampled every 10 ms from t − 500 to t + 500 ms. The weight vector β was estimated with a maximum likelihood method using the glmfit function in Matlab 7 (Mathworks, Natick, MA). The residual spike count for the ith movement in a given recording session is denoted as RSCi, and was calculated as the sum of the residuals from this model for 10 successive 50 ms bins beginning 250 ms before target onset. In other words,
 |
The movements with ambiguous NRM (Fig. 1D) were excluded in this analysis and analyzed separately (see below).
To test whether the activity of neurons in the SMA and pre-SMA tended to change as a linear function of NRM and OP, a linear regression model was applied to the residual spike count obtained from the kinematic model. This model also included the reaction time to control for a possible effect of reaction time on neural activity. Namely,
To test whether the effect of NRM and OP might reflect the changes in neural activity related to the number of movements in a sequence, namely sequence length, we also tested the following model,
where SLi indicates the sequence length for the trial including the ith movement.
We then examined a series of linear and nonlinear regression models to investigate how serial order information, such as NRM and OP, is encoded in the activity of individual neurons together with information about movement direction. First, we constructed the null model by assuming that neural activity is simply a function of movement direction and reaction time. In other words,
where Di′ [dleft
dright
dup
ddown] is a vector of four dummy variables indicating the movement direction for the ith movement (dX = 1, if the movement was in the direction X, and 0 otherwise, where X = left, right, up, or down), RTi the reaction time for the same movement, and c and crt the corresponding regression coefficients.
We then examined 18 other models that can be grouped in two categories. Nine of these models are referred to as additive models, in which the effects of NRM, OP, and movement direction were combined linearly, whereas the remaining nine models are referred to as multiplicative models. Additive models can be expressed as the following:
where functions F1 and F2 describe how the neural activity is influenced by NRM and OP of the movement, respectively. We considered three different classes of models that included only the effect of NRM (δ1 = 1 and δ2 = 0), only the effect of OP (δ1 = 0 and δ2 = 1), or the effect of both variables (δ1 = δ2 = 1). These three classes of models are referred to as N models, O models, and NO models, respectively. For each class of models, we then considered three different functional forms for F1 and F2. First, for linear models, it was assumed that the activity changed as a linear function of NRM and OP. Namely,
 |
Second, for Gaussian models, the activity was modeled as a Gaussian function of NRM and OP.
 |
Finally, for factor models, it was assumed that the activity was determined independently for each NRM and OP.
 |
Ni′ = [n0 n1 .. n6] is a vector of seven dummy variables indicating the NRM for the ith movement in a given recording session, namely, nk = 1, if NRMi = k, and 0 otherwise. Similarly, Oi′ = [o0 o1 .. o6] is a vector of seven dummy variables indicating the OP for the ith movement in a given recording session, namely, ok = 1, if OPi = k + 1, and 0 otherwise. p and q are the vectors of corresponding regression coefficients.
For multiplicative models, it was assumed that the effects of NRM, OP, or both are combined multiplicatively with the effect of movement direction.
in which c and r are the vectors of regression coefficients. Similar to the additive models, we considered nine different multiplicative models by assuming that the neural activity is affected only by the NRM (δ1 = 1 and δ2 = 0), only by the OP (δ1 = 0 and δ2 = 1), or by both (δ1 = δ2 = 1) and by assuming that F1 and F2 take one of the three functional forms described above. In these multiplicative models, therefore, the individual elements of the vector r can be considered as gains modulating the effect of NRM or OP for each movement direction separately.
In the following, each of these 18 different models is identified by a set of adjectives that specify its attributes in the three dimensions described above. For example, multiplicative Gaussian NO model refers to the model in which the neural activity is influenced by both NRM and OP (NO model) via Gaussian functions (Gaussian model), and in which these effects are combined multiplicatively with the effect of movement direction (multiplicative model). For each of the 18 models as well as the null model, model parameters were estimated in Matlab 7 (Mathworks) by minimizing the sum of squared errors between the residual spike count and the value predicted by the model.
Model comparisons.
We compared the performance of the above 19 models using twofold cross-validation. For each model, one-half of the movements examined for each neuron were randomly selected and used for estimating the model parameters (training set), and the other one-half (test set) were used for calculating the sum of squared errors for the model. Then, we switched the roles of the two datasets. We repeated this procedure 50 times to improve the reliability of evaluating the performance of each model. For each repetition, the model with the minimum average sum of squared errors was picked as the best model, and the model that was chosen most frequently across 50 repetitions was selected as the best model for a given neuron. For each cortical area, we then counted the neurons for which a particular model was chosen as the best model. In rare cases when multiple models are chosen equally often as the best model, the count was incremented by the reciprocal of the number of the models that tied. For example, if two models tied for a given neuron, then the neuron count was incremented by 0.5 for each model. This happened for <5% of the neurons in each cortical area.
We then examined how much variability in the spike count during the 500 ms interval used in the above analyses was accounted for by the kinematic model and the best model that also included variables related to the serial position of each movement. First, we computed the sum of the squared deviance of the spike count from its mean (SStotal), the sum of squared residuals from the kinematic model (RSSkin, from Eq. 3), and the sum of squared residuals from the best model (RSSbest). Second, the fraction of variance accounted for by the kinematic (FVkin) or by the best model (FVbest) was computed as follows:
where X = kin or best. RSSbest was computed from the residuals obtained by fitting the best model to the residuals from the kinematic model for all movements except those with ambiguous NRM. When multiple models tied as the best models, the model with the smallest sum of squared residuals was used.
Neural activity for movements with ambiguous NRM.
When the first target in a given trial was presented at the center of the grid, NRM for the first movement was always 3 in some blocks. In other blocks, NRM for the first movement starting from the center of the grid could be 1 or 7 with equal probabilities, and therefore was ambiguous (Fig. 1D). We examined whether activity for such movements with ambiguous NRM was similar to the activity observed for one of the two alternative values of NRM or whether it was intermediate between the amounts of activity observed for the alternative values of NRM. The results from such analysis would be difficult to interpret, unless the neuron in question clearly modulates its activity according to NRM. Therefore, this analysis was performed for a subset of neurons that displayed significant correlation between NRM and the spike counts during the 500 ms interval beginning 250 ms before target onset (t test, p < 0.05). For each neuron, the spike counts during this interval were first standardized to z scores, and then averaged separately according to whether NRM for each movement was ambiguous or not. For movements with unambiguous NRM, the average z score was calculated separately for each NRM. We used a t test to determine whether the average z score for the movements with ambiguous NRM was significantly different from the value obtained for each NRM. This was done separately according to whether a given neuron displayed positive or negative correlation with NRM.
Results
Behavioral performance
Behavioral data were obtained from 86 daily recording sessions (49 and 37 for monkeys D and J, respectively). A total of 70,420 and 53,280 movements were analyzed for monkeys D and J, respectively. Both animals performed this task with few errors, and the percentages of correct trials across all recording sessions were 98.4 and 99.4% for monkeys D and J, respectively. Although the animals performed the task reliably, their reaction times were systematically affected by several factors. Among them, the NRM had the largest effect. The regression coefficient for NRM was positive and significantly different from zero in both monkeys (Table 1), indicating that the reaction times decreased for relatively small NRM (Fig. 2). Reaction times were also affected by the OP. In both animals, the regression coefficient for OP was negative, indicating that the reaction times decreased with OP. The effect of distance between the movement target and the rewarded location was also significant in both monkeys, indicating that the reaction decreased for the targets relatively close to the rewarded location. The effect of change in the distance between the movement target and the rewarded location was different for the two animals, although this was significant in both animals. Significant effects of NRM and OP were found in >90% of the sessions in both animals (Table 2). The effect of distance between the movement target and rewarded location on reaction times was significant in all the sessions for monkey J, but it was significant in 36.7% of the sessions in monkey D. The effect of change in the distance between the target and rewarded location was also significant in a majority of sessions in both animals (Table 2). Finally, when the first target appeared at the center of the grid and NRM for the first movement was ambiguous, it could be 1 or 7. We found that, for both animals, the reaction times for such movements with ambiguous NRM were relatively similar to the value expected for the movements with NRM = 7 (Fig. 2). The average reaction time for the movements with ambiguous NRM was 378.9 and 298.0 ms for monkeys D and J, respectively. This was closer to the average reaction time for NRM = 7 (362.4 and 324.9 ms for monkeys D and J) than to the average reaction time for NRM = 1 (271.5 and 200.0 ms for monkeys D and J).
Table 1.
Raw (standardized) regression coefficients from a linear regression model that tested the effects of multiple variables on reaction times
| Variable | Monkey D | Monkey J |
|---|---|---|
| NRM | 12.09 (0.23) | 14.28 (0.22) |
| OP | −8.38 (−0.17) | −7.94 (−0.13) |
| Distance | 4.83 (0.04) | 37.73 (0.26) |
| ΔDistance | 12.50 (0.08) | −21.72 (−0.11) |
All regression coefficients were significantly different from zero at the significance level of 10−8.
Figure 2.

Effects of the NRM and the OP on reaction times. The average reaction times were computed separately for each combination of NRM and OP, and are connected by a line for each sequence length (SL = 2, 4, 6, or 8). The error bars (SEM) (data not shown) are all smaller than the symbols. The horizontal dotted line and the empty circles correspond to the average reaction time for movements with ambiguous NRM (Fig. 1D).
Table 2.
Number (percentage) of sessions in which the reaction time was significantly affected by the variables included in a regression analysis
| Variable | Monkey D | Monkey J |
|---|---|---|
| NRM | 48 (98.0) | 37 (100.0) |
| OP | 48 (98.0) | 35 (94.6) |
| Distance | 18 (36.7) | 37 (100.0) |
| ΔDistance | 29 (59.2) | 29 (78.4) |
Linear effects of NRM and ordinal position
A total of 114 and 117 neurons recorded from the SMA and pre-SMA, respectively, were included in the analysis. Excluding the movements with ambiguous NRM, the average number of movements examined for each neuron was 1437 and 1438 for SMA and pre-SMA, respectively. Approximately 94% (107 of 114) and 96% (112 of 117) of the neurons in the SMA and pre-SMA changed their activity significantly across different movement directions (ANOVA, p < 0.05).
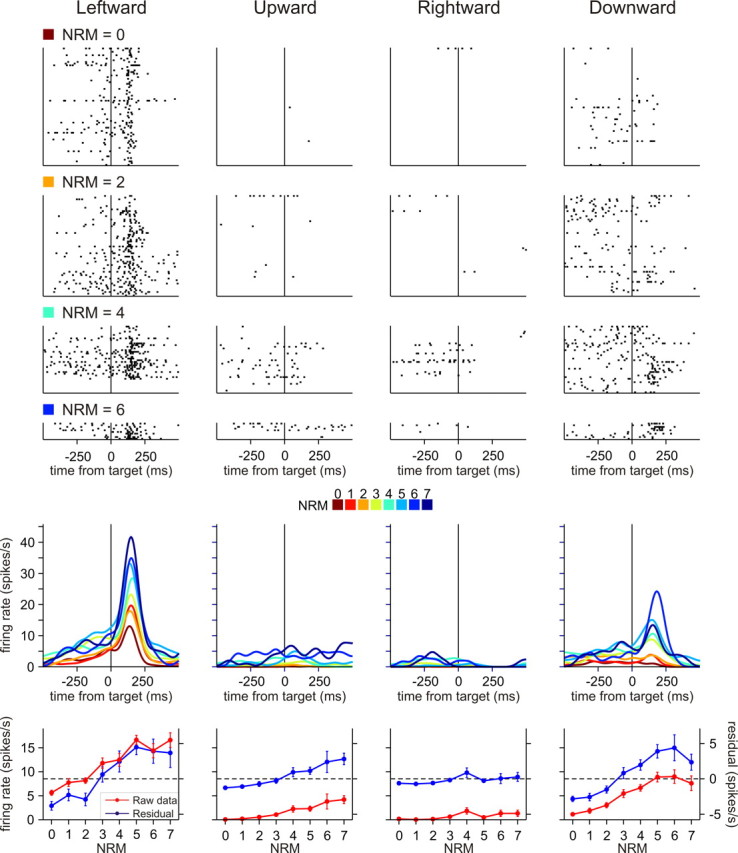
Many neurons in both the SMA and pre-SMA also modulated their activity according to NRM. For example, the SMA neuron shown in Figure 3 began to increase its activity shortly after target onset. In addition, the activity of this neuron was greater for small NRM, namely, when the reward was more imminent. The change in activity of this neuron related to NRM was maintained throughout the hold and reaction time periods (Fig. 3, top and middle). The spike counts during a 500 ms interval centered at the time of target onset also showed the same trend (Fig. 3, bottom). In contrast, for some neurons, the activity increased for large NRM (Fig. 4). To determine whether these changes in neural activity seemingly related to NRM might have resulted from the activity changes related to the kinematic variability, we factored out the effects of the position and velocity of hand and eye movements with a generalized linear model, and used the residuals from this kinematic model for additional analyses (see Materials and Methods). For both neurons described above, the residuals displayed similar effects of NRM compared with the results based on the raw spike counts (Figs. 3, 4, bottom), suggesting that the effect of NRM on the activity of these neurons was mostly independent of kinematic signals. All the results described below are based on the analyses performed on the residuals from the kinematic model, unless noted otherwise.
Figure 3.
An example neuron in SMA showing activity negatively correlated with NRM. Activity of this neuron was best accounted for by the additive NO factor model. Top, Raster plots showing the activity separately for different movement directions and NRM (0, 2, 4, and 6). Middle, Spike density functions (convolved with a Gaussian kernel, σ = 40 ms) estimated separately for different NRM and different movement directions. Bottom, Average firing rates (red) during a 500 ms window centered at target onset plotted as function of NRM separately for different movement directions and residual spike counts (blue) obtained from the kinematic model during the same period. Error bars indicate SEM.
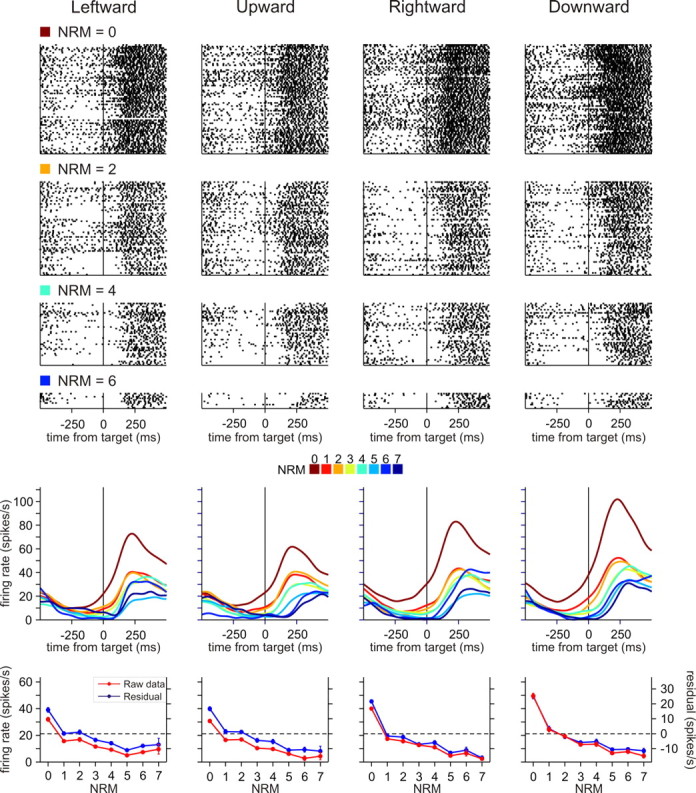
Figure 4.
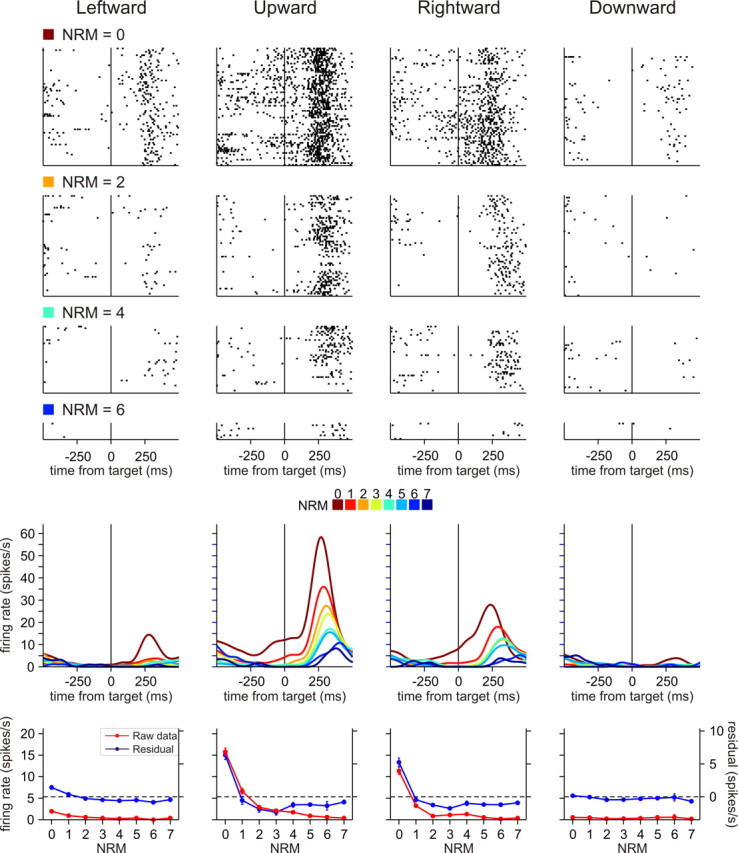
An example neuron in pre-SMA showing activity positively correlated with NRM. Activity of this neuron was best accounted for by the multiplicative N linear model. The format is the same as in Figure 3.
In the present study, NRM and OP were manipulated separately by changing the number of movements in a sequence across trials. To compare the effects of these two variables, we applied a linear regression model that included NRM, OP, and reaction time as independent variables (Eq. 4). Overall, 70.2 and 77.8% of the neurons in the SMA and pre-SMA displayed significant effects of NRM (Table 3, Fig. 5. This difference between the two cortical areas was not statistically significant (∤2 test, p = 0.19). However, neurons in the pre-SMA were more likely to display significant positive correlation between their activity and NRM (47.0%), compared with the neurons in the SMA (30.7%; ∤2 test, p < 0.05). The overall percentages of neurons that showed significant effects of OP were 58.8% in the SMA, and this was not significantly different from the proportion of such neurons in the pre-SMA (47.9%; ∤2 test, p=0.10) (Table 3). In the pre-SMA, the activity was more frequently affected by NRM than by OP (z test, p < 10-5), whereas activity of the neurons in the SMA was affected by NRM and OP more or less equally often (p > 0.4). Neurons in the SMA were more likely to display significant positive correlation between their activity and OP (37.7%), compared with the neurons in the pre-SMA (21.4%; ∤2 test, p < 0.05). Although this regression analysis was applied to the residuals from the kinematic model, the effect of reaction time was still significant for many neurons in both cortical areas. Neurons in the SMA showed significant effects of reaction time on their activity significantly more frequently (66.7%) than those in the pre-SMA (53.0%; ∤2 test, p < 0.05) (Table 3). In addition, compared with the neurons in the pre-SMA, neurons in the SMA were more likely to show negative effect of reaction time on their activity (∤2 test, p < 0.05). Consistent with the results based on the fraction of neurons that showed significant effects of NRM and OP, the magnitude of regression coefficients associated with NRM was on average larger than that of regression coefficients associated with OP. For SMA neurons, the average magnitude of the regression coefficients was 0.198 and 0.136 spikes/s for NRM and OP, respectively, whereas for pre-SMA neurons, the average value was 0.292 and 0.114 spikes/s for NRM and OP, respectively. The difference between NRM and OP was statistically significant in both cortical areas (paired t test, p < 0.005).
Table 3.
Number (percentage) of neurons that showed significant effects of NRM, OP, and RT on their activity in a linear regression model
| Positive | Negative | Not significant | ||
|---|---|---|---|---|
| SMA | NRM | 35 (30.7) | 45 (39.5) | 34 (29.8) |
| OP | 43 (37.7) | 24 (21.0) | 47 (41.2) | |
| RT | 25 (21.9) | 51 (44.7) | 38 (33.3) | |
| Pre-SMA | NRM | 55 (47.0) | 36 (30.8) | 26 (22.2) |
| OP | 25 (21.4) | 31 (26.5) | 61 (52.1) | |
| RT | 32 (27.4) | 30 (25.6) | 55 (47.0) |
Figure 5.

Distribution of regression coefficients associated with NRM and OP. The different symbols indicate whether the effect of NRM or OP was statistically significant or not (t test, p < 0.05). Numbers indicate the figures that illustrate the corresponding neurons.
By definition, the number of movements in a given sequence, namely the sequence length, was always equal to the sum of NRM and OP. Therefore, it is possible that neural activity related to NRM and OP might have reflected the changes in neural activity related to the sequence length. To test this, we compared the performance of the regression model that includes only the sequence length and reaction time as the independent variable against the model that includes both NRM and OP in addition to reaction time. For each neuron, the model that showed the minimum sum of squared errors more frequently in 50 repetitions of twofold cross-validation was chosen as the better model (see Materials and Methods). For the majority of neurons in both the SMA (91 neurons; 79.8%) and pre-SMA (101 neurons; 86.3%), the model with NRM and OP was chosen as the better model. Therefore, the activity related to NRM and OP did not merely reflect the activity related to the sequence length.
Nonlinear effects of NRM and ordinal position
The results described above revealed that for many neurons in SMA and pre-SMA, their activity tended to change gradually according to NRM and OP. These analyses, however, did not consider the possibility that the activity might change nonlinearly as a function of NRM and OP or the possibility that the effect of NRM and OP might vary according to the direction of the movement. For the SMA neuron shown in Figure 3, for example, the effects of NRM were relatively similar for different movement directions. In contrast, for the pre-SMA neuron shown in Figure 4, the effect of NRM was much stronger for leftward movements than for upward and rightward movements, and intermediate for downward movements. To examine how signals related to NRM and OP were combined with directional signals, each neuron was first tested using the null model in which the activity was determined as a function of movement direction and reaction time (see Materials and Methods). Against this null model, we then tested nine different additive models in which the effects of NRM and OP were combined additively with the effect of movement direction and nine multiplicative models in which these effects were combined multiplicatively. The effects of NRM and OP were modeled as a linear function, as a Gaussian function, or by treating the activity for each NRM and OP as a separate factor. Some of these models included only NRM (N model) or OP (O model), whereas others include both variables (NO model). The results showed that the null model was selected as the best model only for a small number of neurons in both cortical areas, suggesting that activity in these cortical areas was commonly influenced by NRM and OP (Table 4)
Table 4.
Percentages of neurons best described by the null model and other models that combine directional signals additively or multiplicatively with different functions of NRM (N), OP (O), or combination of NRM and OP (NO)
| N | O | NO | Null | All | ||
|---|---|---|---|---|---|---|
| SMA | ||||||
| Additive | ||||||
| Linear | 0.9 | 0.9 | 7.0 | 8.8 | ||
| Gaussian | 1.8 | 0.4 | 3.1 | 5.3 | ||
| Factor | 3.9 | 0.9 | 14.9 | 19.7 | ||
| Multiplicative | ||||||
| Linear | 6.6 | 2.6 | 7.9 | 17.1 | ||
| Gaussian | 0.0 | 0.0 | 5.3 | 5.3 | ||
| Factor | 10.5 | 0.0 | 21.9 | 32.5 | ||
| Null | 11.4 | 11.4 | ||||
| All | 23.7 | 4.8 | 60.1 | 11.4 | 100.0 | |
| Pre-SMA | ||||||
| Additive | ||||||
| Linear | 0.9 | 0.0 | 2.6 | 3.4 | ||
| Gaussian | 2.1 | 0.0 | 3.0 | 5.1 | ||
| Factor | 7.7 | 1.3 | 14.5 | 23.5 | ||
| Multiplicative | ||||||
| Linear | 6.8 | 0.4 | 5.1 | 12.4 | ||
| Gaussian | 1.7 | 0.0 | 3.4 | 5.1 | ||
| Factor | 8.5 | 0.0 | 31.6 | 40.2 | ||
| Null | 10.3 | 10.3 | ||||
| All | 27.8 | 1.7 | 60.3 | 10.3 | 100.0 | |
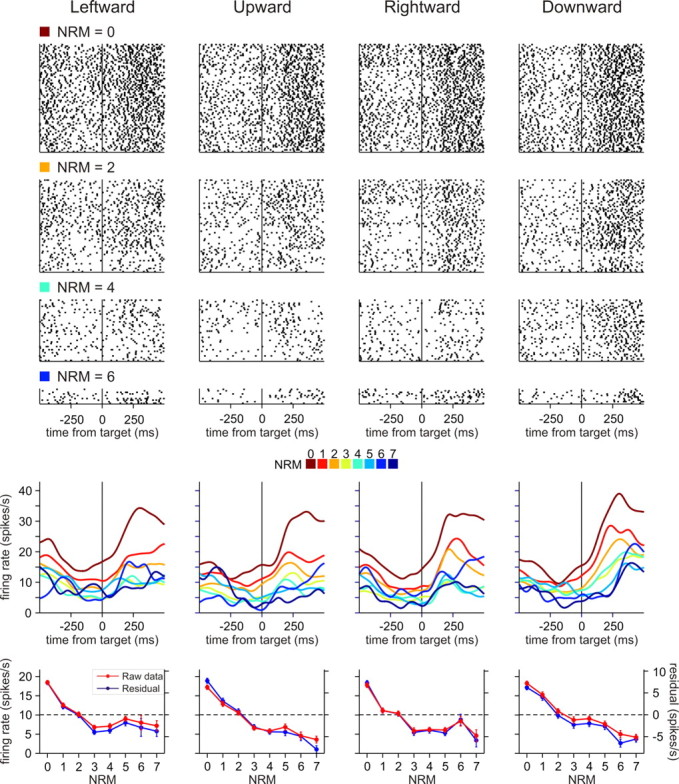
For some neurons in both SMA and pre-SMA, the effect of NRM and OP was combined linearly with the changes in activity related to movement direction. For example, the best models for the SMA neuron shown in Figure 3 and the pre-SMA neuron shown in Figure 6 were additive models. Both of these neurons increased their activity for small NRM similarly across different movement directions. For the majority of neurons in both SMA and pre-SMA, however, the effect of NRM varied significantly across movement directions. For example, the pre-SMA neuron shown in Figure 7 increased its activity for small NRM, but this effect was most pronounced for upward movements. The effect was weaker, but still stronger for rightward movements than for leftward and downward movements. For this neuron, multiplicative factor model that includes only NRM was most favored, indicating that the effect of NRM was best modeled by treating the activity for each NRM as a separate factor. Similarly, the effects of NRM and movement direction were combined multiplicatively for the pre-SMA neuron shown in Figure 4, and this neuron favored multiplicative linear model that includes only NRM.
Figure 6.
An example neuron in pre-SMA showing activity negatively correlated with NRM. Activity of this neuron was best accounted for by the additive NO factor model. The format is the same as in Figure 3.
Figure 7.
An example neuron in pre-SMA showing activity negatively correlated with NRM. Activity of this neuron was best accounted for by the multiplicative N factor model. The format is the same as in Figure 3.
To understand how the serial information influenced directional signals in the population of neurons in the SMA and pre-SMA, we counted the number of neurons in each cortical area that favored different models. Collapsed over the dimension of functional forms, multiplicative models were chosen more frequently than additive models. Overall, for 54.8 and 57.7% of the neurons in SMA and pre-SMA, changes in activity were better accounted for by multiplicative models than by additive models (Table 4). This difference between the two areas was not significantly different (χ2 test, p > 0.7). Thus, signals related to NRM and OP tended to have multiplicative or modulatory effect on activity related to movement direction in both cortical areas. Collapsed over the dimension of multiplicative versus additive models, the factor models were chosen in the majority of neurons in both SMA (52.2%) and pre-SMA (63.7%). This was followed by the linear model, which was chosen for 25.9 and 15.8% of the neurons in SMA and pre-SMA, respectively. The distribution of neurons across three different functional forms was not significantly different for the SMA and pre-SMA (χ2 test, p > 0.1). When the results were combined regardless of whether a given neuron was best fit by N, O, or NO models, the multiplicative factor model was chosen as the best model most frequently (32.5 and 40.2% in SMA and pre-SMA, respectively). This was followed by the additive factor model (19.7 and 23.5% in SMA and pre-SMA). The distribution of neurons across such six different models was not significantly different for SMA and pre-SMA (χ2 test, p > 0.4).
We also examined how the effects of NRM and OP were combined in the activity of individual neurons in the SMA and pre-SMA. The effects of NRM and OP were visualized by plotting the spike counts averaged separately for each combination of NRM and OP (Fig. 8). These plots revealed that the activity of some neurons was modulated by both NRM and OP (Fig. 8A), whereas other neurons modulated their activity almost exclusively according to NRM (Fig. 8B). The results from model comparison showed that many neurons in both SMA and pre-SMA displayed the effects of both NRM and OP (NO models) (Table 4). Overall, 60.1 and 60.3% of the neuron in the SMA and pre-SMA were best described by NO models, respectively. In addition, a substantial fraction of neurons in both SMA and pre-SMA were best explained by N model (23.7% in SMA; 27.8% in pre-SMA). Only a small fraction of neurons in both areas were best described by O models (4.8% in SMA; 1.7% in pre-SMA). In both cortical areas, multiplicative factor NO model was chosen as the best model most frequently (21.9% in SMA; 31.6% in pre-SMA). The distribution of neurons across 19 different models examined in this study was not significantly different for the two cortical areas (χ2 test, p > 0.6). In addition, regardless of which model was chosen as the best model, the models that include the variables related to the serial information about the movement, such as NRM and OP, accounted for a substantial proportion of the variability in neural activity (Fig. 9). The kinematic model that included only the information about the positions and velocities of hand and eye movements accounted for 19.4 and 18.8% of the variability in the spike counts in the SMA and pre-SMA, respectively. The fraction of variance accounted for by the best model was 27.2 and 29.1% in the SMA and pre-SMA, respectively.
Figure 8.

An example neuron encoding both NRM and OP (A) and another neuron encoding only NRM (B). The average firing rates for each combination of NRM and OP during a 500 ms window centered at the time of target onset are plotted as a function of NRM (top) or OP (bottom). The values obtained from the trials of the same sequence length (SL) are connected by a line. These two neurons are the same neurons illustrated in Figures 3 (A) and 7 (B), respectively. Error bars indicate SEM.
Figure 9.

Fraction of variance in the spike counts during the 500 ms window beginning 250 ms before target onset that was accounted for by the kinematic model (abscissa) and by the best model that incorporated the effect of NRM and OP (ordinate). The different symbols indicate whether the best model included NRM or OP. Numbers indicate the figures that illustrate the corresponding neurons.
Effect of uncertainty in NRM on neural activity
For the results described so far, the movements with ambiguity in NRM (Fig. 1D) were excluded. To gain insights into how this uncertainty in NRM affected the activity of neurons in the SMA and pre-SMA, we compared means of normalized neural activity for ambiguous movement to those for unambiguous movement at each NRM. This comparison was done separately according to whether the activity of a neuron was positively or negatively correlated with NRM. When NRM of a given movement was ambiguous, it was either 1 or 7. Therefore, if the animal estimated the value favoring one of these possibilities and neurons in the medial frontal encoded this estimated value, neural activity for ambiguous movements would be similar to that for movement with NRM of 1 or 7. The results showed that neural activity for ambiguous movement was mostly intermediate between these two extreme values (Fig. 10).
Figure 10.

Effect of uncertainty about NRM on neural activity. This analysis was performed separately according to whether the neurons showed significant negative (top) or positive (bottom) correlation with NRM. The number of neurons in each group is indicated in the plot. Within each group, normalized activity was averaged separately for unambiguous movements as a function of NRM (filled circles) and for movements with ambiguous NRM (empty circles). Error bars indicate SEM. *p < 0.05 (t test).
Discussion
Coding of ordinal information in the medial frontal cortex
A number of previous studies have examined the activity of neurons in different brain areas while the monkeys produced a sequence of eye or hand movements from memory. Many of these studies have found neurons encoding the ordinal positions of movements in a sequence, exclusively or in combination with other movement parameters. When tested with hand movements, such neurons were found in the lateral prefrontal cortex (Barone and Joseph, 1989; Averbeck et al., 2003), the dorsal anterior cingulate cortex (Procyk and Joseph, 2001), and the basal ganglia (Kermadi and Joseph, 1995; Mushiake and Strick, 1995). Neurons encoding ordinal positions during sequential hand movements were also found in the pre-SMA and the SMA (Clower and Alexander, 1998; Shima and Tanji, 2000). For memorized eye movement sequences, neurons encoding ordinal positions were found in the prefrontal cortex (Averbeck et al., 2006) and pre-SMA (Isoda and Tanji, 2004). Such neurons were also found frequently in the supplementary eye field, but rarely in the frontal eye field (Isoda and Tanji, 2003). In most of these studies, however, the number of movements in a sequence was usually three, and this was fixed throughout the experiment. Therefore, the activity seemingly related to the ordinal positions of the movements in a sequence might indeed encode the number of movements remaining in the sequence. In the present study, we varied the number of movements in a sequence to dissociate the effects of OP and the NRM. The results showed that neurons in the SMA were more or less equally likely to encode these two parameters. In contrast, neurons in the pre-SMA were more likely to encode NRM than OP, suggesting that the pre-SMA might encode the serial orders of movements in a sequence prospectively.
Implications for value encoding in the medial frontal cortex
Neural activity related to the ordinal position of a movement in a sequence can play an important role in assembling multiple movements in a correct order (Tanji, 2001). Signals related to NRM might be used for the same purpose, because individual movements in a sequence can be uniquely identified by either their ordinal positions or NRM. However, during the task used in the present study, NRM also reflected the immediacy of reward expected at the end of each trial and the amount of work necessary to obtain reward. Both of these factors are likely to change the subjective value of reward. For choices among asynchronous outcomes, many models of decision making, such as discounted utility theory (Samuelson, 1937) and reinforcement learning (Sutton and Barto, 1998), postulate that the value of a future reward is reduced according to its delay, even when the amount of work is held constant. This is referred to as temporal discounting. Indeed, during free-choice tasks, the preference for reward decreases with the delay expected before reward delivery (Frederick et al., 2002). Similarly, the animal's performance deteriorates when the number of movements before reward increases (Bowman et al., 1996) or if the delivery of reward is delayed (Perin, 1943). We previously found that the saccadic reaction times were more strongly influenced by NRM than by the ordinal positions of eye movements in an oculomotor sequence task (Sohn and Lee, 2006). Similarly, in the present study, we found that the reaction times for hand movements decreased as the NRM decreased, suggesting that the subjective value of expected reward increases across successive movements in a trial. In addition, signals related to reward delivery or its omission as well as reward expectancy have been found in the SMA (Campos et al., 2005), and other areas in the cingulate cortex that project to the SMA and pre-SMA (Shidara and Richmond, 2002; Amiez et al., 2006). Therefore, the activity in the SMA and pre-SMA related to the NRM might reflect the subjective value of reward expected as a consequence of a particular movement.
Currently, the exact nature of neural signals related to NRM remains unknown. This can be examined in future studies, for example, by manipulating the interval between successive movements so that the immediacy of reward and NRM can be dissociated. Whether activity related to NRM reflects the amount of work or effort necessary to obtain reward can be also tested by manipulating the amount of force necessary to acquire each target or other aspects of task difficulty. Finally, if the activity related to NRM encodes the value of each movement, it should vary not only with the NRM or immediacy of reward, but also with the probability and magnitude of reward. Signals related to the immediacy, probability, and magnitude of reward are broadly distributed in many brain areas (Platt and Glimcher, 1999; Roesch and Olson, 2003, 2005a,b; Sugrue et al., 2004; Tobler et al., 2005; Tsujimoto and Sawaguchi, 2005). Therefore, neural activity in the SMA and pre-SMA might be similarly influenced by such factors.
In the present study, neurons in the pre-SMA were more likely to increase their activity for movements with relatively large NRM than those in the SMA. This suggests that the pre-SMA might play a more important role in initiating a sequence of movements when reward is expected after multiple movements. The results from imaging studies in human subjects have shown that different regions in the basal ganglia might be specialized in selecting movements that can maximize the overall reward in different timescales. For example, the ventral striatum increases its metabolic activity when the subjects choose the options that can maximize the reward immediately (Tanaka et al., 2004; Hariri et al., 2006). It remains to be seen whether the pre-SMA and SMA are similarly specialized for reward maximization at different timescales during sequential decision making.
Multiplexing of reward and direction signals
Previous studies have identified neural signals related to reward values in different areas of the primate brain, including the lateral prefrontal cortex (Watanabe, 1996; Leon and Shadlen, 1999; Kobayashi et al., 2002; Barraclough et al., 2004; Seo et al., 2007), the orbitofrontal cortex (Tremblay and Schultz, 1999; Roesch and Olson, 2004; Padoa-Schioppa and Assad, 2006), the anterior cingulate cortex (Shidara and Richmond, 2002; Seo and Lee, 2007), the posterior parietal cortex (Platt and Glimcher, 1999; Dorris and Glimcher, 2004; Sugrue et al., 2004), the basal ganglia (Kawagoe et al., 1998; Cromwell and Schultz, 2003; Samejima et al., 2005), and the amygdala (Paton et al., 2006). In addition, the timing of expected reward also influences the activity of neurons in these brain areas (Shidara and Richmond, 2002; Roesch and Olson, 2005a; Tsujimoto and Sawaguchi, 2005), indicating that neurons in these areas might encode the subjective value of reward discounted temporally according to its delay. Many neurons in the brain areas described above also modulate their activity according to the parameters of the animal's movement (Funahashi et al., 1989; Hikosaka et al., 1989; Andersen et al., 1990; Russo et al., 2002). However, how the signals related to the movement direction and expected reward are combined at the level of individual neurons is still poorly understood. In addition, whether neural signals correlated with various aspects of reward and attention reflect distinct processes needs to be investigated further (Maunsell, 2004; Bendiksby and Platt, 2006).
In the present study, the majority of neurons in SMA and pre-SMA modulated their activity according to both the NRM and movement direction. Furthermore, effects of these two variables were often combined multiplicatively, suggesting that NRM might modulate the gain of the signals related to movement direction. When the activity of a cortical neuron encodes more than one variable, the effects of multiple variables are often combined in a multiplicative manner (Salinas and Thier, 2000; Chance et al., 2002). For example, signals related to the retinotopic position of a visual stimulus are modulated by the animal's gaze direction as well as the position of the animal's body in the primate posterior parietal cortex, which might reflect the progression toward a stable representation of visual space (Andersen et al., 1997). Similarly, the signals related to stimulus parameter in the extrastriate cortex are modulated multiplicatively by the animal's attention, which might allow the attended stimulus to be selected for additional processing (McAdams and Maunsell, 1999; Treue and Martínez Trujillo, 1999; Ardid et al., 2007). By modulating the gain of movement-related signals, the signals related to NRM might provide a mechanism to allow the animal to choose a particular movement sequence that maximizes the overall reward (Lee, 2006). It is possible that this selection process might be facilitated by synchronized oscillatory activity (Lee, 2003, 2004; Averbeck and Lee, 2004; Tiesinga et al., 2004; Sejnowski and Paulsen, 2006). Multiplicative interaction between the signals related to reward and movement parameters has been also found in the basal ganglia (Pasquereau et al., 2007), and therefore might represent a general mechanism for action selection.
Footnotes
This work was supported by National Institute of Mental Health Grant MH059216. We are grateful to B. Averbeck for his help with the experiment and to L. Carr for technical assistance.
References
- Amiez C, Joseph J-P, Procyk E. Reward encoding in the monkey anterior cingulate cortex. Cereb Cortex. 2006;16:1040–1055. doi: 10.1093/cercor/bhj046. [DOI] [PMC free article] [PubMed] [Google Scholar]
- Andersen RA, Bracewell RM, Barash S, Gnadt JW, Fogassi L. Eye position effects on visual, memory, and saccade-related activity in areas LIP and 7a of macaque. J Neurosci. 1990;10:1176–1196. doi: 10.1523/JNEUROSCI.10-04-01176.1990. [DOI] [PMC free article] [PubMed] [Google Scholar]
- Andersen RA, Snyder LH, Bradley DC, Xing J. Multimodal representation of space in the posterior parietal cortex and its use in planning movements. Annu Rev Neurosci. 1997;20:303–330. doi: 10.1146/annurev.neuro.20.1.303. [DOI] [PubMed] [Google Scholar]
- Ardid S, Wang XJ, Compte A. An integrated microcircuit model of attentional processing in the neocortex. J Neurosci. 2007;27:8486–8495. doi: 10.1523/JNEUROSCI.1145-07.2007. [DOI] [PMC free article] [PubMed] [Google Scholar]
- Averbeck BB, Lee D. Coding and transmission of information by neural ensembles. Trends Neurosci. 2004;27:225–230. doi: 10.1016/j.tins.2004.02.006. [DOI] [PubMed] [Google Scholar]
- Averbeck BB, Chafee MV, Crowe DA, Georgopoulos AP. Neural activity in prefrontal cortex during copying geometrical shapes. I. Single cells encode shape, sequence, and metric parameters. Exp Brain Res. 2003;150:127–141. doi: 10.1007/s00221-003-1416-6. [DOI] [PubMed] [Google Scholar]
- Averbeck BB, Sohn J-W, Lee D. Activity in prefrontal cortex during dynamic selection of action sequences. Nat Neurosci. 2006;9:276–282. doi: 10.1038/nn1634. [DOI] [PubMed] [Google Scholar]
- Barbas H, Pandya DN. Architecture and frontal cortical connections of the premotor cortex (area 6) in the rhesus monkey. J Comp Neurol. 1987;256:211–228. doi: 10.1002/cne.902560203. [DOI] [PubMed] [Google Scholar]
- Barone P, Joseph J-P. Prefrontal cortex and spatial sequence in macaque monkey. Exp Brain Res. 1989;78:447–464. doi: 10.1007/BF00230234. [DOI] [PubMed] [Google Scholar]
- Barraclough DJ, Conroy ML, Lee D. Prefrontal cortex and decision making in a mixed-strategy game. Nat Neurosci. 2004;7:404–410. doi: 10.1038/nn1209. [DOI] [PubMed] [Google Scholar]
- Bendiksby MS, Platt ML. Neural correlates of reward and attention in macaque area LIP. Neuropsychologia. 2006;44:2411–2420. doi: 10.1016/j.neuropsychologia.2006.04.011. [DOI] [PubMed] [Google Scholar]
- Bowman EM, Aigner TG, Richmond BJ. Neural signals in the monkey ventral striatum related to motivation for juice and cocaine rewards. J Neurophysiol. 1996;75:1061–1073. doi: 10.1152/jn.1996.75.3.1061. [DOI] [PubMed] [Google Scholar]
- Campos M, Breznen B, Bernheim K, Andersen RA. Supplementary motor area encodes reward expectancy in eye-movement tasks. J Neurophysiol. 2005;24:1325–1335. doi: 10.1152/jn.00022.2005. [DOI] [PubMed] [Google Scholar]
- Chance FS, Abbott LF, Reyes AD. Gain modulation from background synaptic input. Neuron. 2002;35:773–782. doi: 10.1016/s0896-6273(02)00820-6. [DOI] [PubMed] [Google Scholar]
- Christensen R. Log-linear models and logistic regression. Ed 2. New York: Springer; 1997. [Google Scholar]
- Clower WT, Alexander GE. Movement sequence-related activity reflecting numerical order of components in supplementary and presupplementary motor areas. J Neurophysiol. 1998;80:1562–1566. doi: 10.1152/jn.1998.80.3.1562. [DOI] [PubMed] [Google Scholar]
- Cromwell HC, Schultz W. Effects of expectations for different reward magnitudes on neuronal activity in primate striatum. J Neurophysiol. 2003;89:2823–2838. doi: 10.1152/jn.01014.2002. [DOI] [PubMed] [Google Scholar]
- Dorris MC, Glimcher PW. Activity in posterior parietal cortex is correlated with the relative subjective desirability of action. Neuron. 2004;44:365–378. doi: 10.1016/j.neuron.2004.09.009. [DOI] [PubMed] [Google Scholar]
- Frederick S, Loewenstein G, O'Donoghue T. Time discounting and time preference: a critical review. J Econ Lit. 2002;40:351–401. [Google Scholar]
- Funahashi S, Bruce CJ, Goldman-Rakic PS. Mnemonic coding of visual space in the monkey's dorsolateral prefrontal cortex. J Neurophysiol. 1989;61:331–349. doi: 10.1152/jn.1989.61.2.331. [DOI] [PubMed] [Google Scholar]
- Grafton ST, Hazeltine E, Ivry R. Functional mapping of sequence learning in normal humans. J Cogn Neurosci. 1995;7:497–510. doi: 10.1162/jocn.1995.7.4.497. [DOI] [PubMed] [Google Scholar]
- Hariri AR, Brown SM, Williamson DE, Flory JD, de Wit H, Manuck SB. Preference for immediate over delayed rewards is associated with magnitude of ventral striatal activity. J Neurosci. 2006;26:13213–13217. doi: 10.1523/JNEUROSCI.3446-06.2006. [DOI] [PMC free article] [PubMed] [Google Scholar]
- Hatsopoulos NG, Xu Q, Amit Y. Encoding of movement fragments in the motor cortex. J Neurosci. 2007;27:5105–5114. doi: 10.1523/JNEUROSCI.3570-06.2007. [DOI] [PMC free article] [PubMed] [Google Scholar]
- Hikosaka O, Sakamoto M, Usui S. Functional properties of monkey caudate neurons. I. Activities related to saccadic eye movements. J Neurophysiol. 1989;61:780–798. doi: 10.1152/jn.1989.61.4.780. [DOI] [PubMed] [Google Scholar]
- Hikosaka O, Nakahara H, Rand MK, Sakai K, Lu X, Nakamura K, Miyachi S, Doya K. Parallel neural networks for learning sequential procedures. Trends Neurosci. 1999;22:464–471. doi: 10.1016/s0166-2236(99)01439-3. [DOI] [PubMed] [Google Scholar]
- Hoshi E, Tanji J. Distinctions between dorsal and ventral premotor areas: anatomical connectivity and functional properties. Curr Opin Neurobiol. 2007;17:234–242. doi: 10.1016/j.conb.2007.02.003. [DOI] [PubMed] [Google Scholar]
- Isoda M, Tanji J. Contrasting neuronal activity in the supplementary and frontal eye fields during temporal organization of multiple saccades. J Neurophysiol. 2003;90:3054–3065. doi: 10.1152/jn.00367.2003. [DOI] [PubMed] [Google Scholar]
- Isoda M, Tanji J. Participation of the primate presupplementary motor area in sequencing multiple saccades. J Neurophysiol. 2004;92:653–659. doi: 10.1152/jn.01201.2003. [DOI] [PubMed] [Google Scholar]
- Jenkins IH, Brooks DJ, Nixon PD, Frackowiak RSJ, Passingham RE. Motor sequence learning: a study with positron emission tomography. J Neurosci. 1994;14:3775–3790. doi: 10.1523/JNEUROSCI.14-06-03775.1994. [DOI] [PMC free article] [PubMed] [Google Scholar]
- Kawagoe R, Takikawa Y, Hikosaka O. Expectation of reward modulates cognitive signals in the basal ganglia. Nat Neurosci. 1998;1:411–416. doi: 10.1038/1625. [DOI] [PubMed] [Google Scholar]
- Kermadi I, Joseph JP. Activity in the caudate nucleus of monkey during spatial sequencing. J Neurophysiol. 1995;74:911–933. doi: 10.1152/jn.1995.74.3.911. [DOI] [PubMed] [Google Scholar]
- Kobayashi S, Lauwereyns J, Koizumi M, Sakagami M, Hikosaka O. Influence of reward expectation on visuospatial processing in macaque lateral prefrontal cortex. J Neurophysiol. 2002;87:1488–1498. doi: 10.1152/jn.00472.2001. [DOI] [PubMed] [Google Scholar]
- Lee D. Coherent oscillations in neuronal activity of the supplementary motor area during a visuomotor task. J Neurosci. 2003;23:6798–6809. doi: 10.1523/JNEUROSCI.23-17-06798.2003. [DOI] [PMC free article] [PubMed] [Google Scholar]
- Lee D. Behavioral context and coherent oscillations in the supplementary motor area. J Neurosci. 2004;24:4453–4459. doi: 10.1523/JNEUROSCI.0047-04.2004. [DOI] [PMC free article] [PubMed] [Google Scholar]
- Lee D. Neural basis of quasi-rational decision making. Curr Opin Neurobiol. 2006;16:191–198. doi: 10.1016/j.conb.2006.02.001. [DOI] [PubMed] [Google Scholar]
- Lee D, Quessy S. Activity in the supplementary motor area related to learning and performance during a sequential visuomotor task. J Neurophysiol. 2003;89:1039–1056. doi: 10.1152/jn.00638.2002. [DOI] [PubMed] [Google Scholar]
- Leichnetz GR. Afferent and efferent connections of the dorsolateral precentral gyrus (area 4, hand/arm region) in the macaque monkey, with comparisons to area 8. J Comp Neurol. 1986;254:460–492. doi: 10.1002/cne.902540403. [DOI] [PubMed] [Google Scholar]
- Leon MI, Shadlen MN. Effect of expected reward magnitude on the response of neurons in the dorsolateral prefrontal cortex of the macaque. Neuron. 1999;24:415–425. doi: 10.1016/s0896-6273(00)80854-5. [DOI] [PubMed] [Google Scholar]
- Luria AR. Human brain and psychological processes. New York: Harper and Row; 1966. [Google Scholar]
- Matelli M, Luppino G, Rizzolatti Patterns of cytochrome oxidase activity in the frontal agranular cortex of macaque monkey. Behav Brain Res. 1985;18:125–137. doi: 10.1016/0166-4328(85)90068-3. [DOI] [PubMed] [Google Scholar]
- Matelli M, Luppino G, Rizzolatti G. Architecture of superior and mesial area 6 and the adjacent cingulate cortex in the macaque monkey. J Comp Neurol. 1991;311:445–462. doi: 10.1002/cne.903110402. [DOI] [PubMed] [Google Scholar]
- Matsuzaka Y, Aizawa H, Tanji J. A motor area rostral to the supplementary motor area (presupplementary motor area) in the monkey: neuronal activity during a learned motor task. J Neurophysiol. 1992;68:653–662. doi: 10.1152/jn.1992.68.3.653. [DOI] [PubMed] [Google Scholar]
- Maunsell JHR. Neuronal representations of cognitive state: reward or attention? Trends Cogn Sci. 2004;8:261–265. doi: 10.1016/j.tics.2004.04.003. [DOI] [PubMed] [Google Scholar]
- McAdams CJ, Maunsell JHR. Effects of attention on orientation-tuning functions of single neurons in macaque cortical area V4. J Neurosci. 1999;19:431–441. doi: 10.1523/JNEUROSCI.19-01-00431.1999. [DOI] [PMC free article] [PubMed] [Google Scholar]
- Mitz AR, Wise SP. The somatotopic organization of the supplementary motor area: intracortical microstimulation mapping. J Neurosci. 1987;7:1010–1021. doi: 10.1523/JNEUROSCI.07-04-01010.1987. [DOI] [PMC free article] [PubMed] [Google Scholar]
- Mushiake H, Strick PL. Pallidal neuron activity during sequential arm movements. J Neurophysiol. 1995;74:2754–2758. doi: 10.1152/jn.1995.74.6.2754. [DOI] [PubMed] [Google Scholar]
- Nakamura K, Sakai K, Hikosaka O. Neuronal activity in medial frontal cortex during learning of sequential procedures. J Neurophysiol. 1998;80:2671–2687. doi: 10.1152/jn.1998.80.5.2671. [DOI] [PubMed] [Google Scholar]
- Nissen MJ, Bullemer P. Attentional requirements of learning: evidence from performance-measures. Cognit Psychol. 1987;19:1–32. [Google Scholar]
- Padoa-Schioppa C, Assad JA. Neurons in the orbitofrontal cortex encode economic value. Nature. 2006;441:223–226. doi: 10.1038/nature04676. [DOI] [PMC free article] [PubMed] [Google Scholar]
- Pasquereau B, Nadjar A, Arkadir D, Bezard E, Goillandeau M, Bioulac B, Gross CE, Boraud T. Shaping of motor responses by incentive values through the basal ganglia. J Neurosci. 2007;27:1176–1183. doi: 10.1523/JNEUROSCI.3745-06.2007. [DOI] [PMC free article] [PubMed] [Google Scholar]
- Paton JJ, Belova MA, Morrison SE, Salzman CD. The primate amygdala represents the positive and negative value of visual stimuli during learning. Nature. 2006;439:865–870. doi: 10.1038/nature04490. [DOI] [PMC free article] [PubMed] [Google Scholar]
- Perin CT. A quantitative investigation of the delay-of-reinforcement gradient. J Exp Psychol. 1943;32:37–51. [Google Scholar]
- Picard N, Strick PL. Imaging the premotor areas. Curr Opin Neurobiol. 2001;11:663–672. doi: 10.1016/s0959-4388(01)00266-5. [DOI] [PubMed] [Google Scholar]
- Platt ML, Glimcher PW. Neural correlates of decision variables in parietal cortex. Nature. 1999;400:233–238. doi: 10.1038/22268. [DOI] [PubMed] [Google Scholar]
- Procyk E, Joseph JP. Characterization of serial order encoding in the monkey anterior cingulate cortex. Eur J Neurosci. 2001;14:1041–1046. doi: 10.1046/j.0953-816x.2001.01738.x. [DOI] [PMC free article] [PubMed] [Google Scholar]
- Roesch MR, Olson CR. Impact of expected reward on neuronal activity in prefrontal cortex, frontal and supplementary eye fields and premotor cortex. J Neurophysiol. 2003;90:1766–1789. doi: 10.1152/jn.00019.2003. [DOI] [PubMed] [Google Scholar]
- Roesch MR, Olson CR. Neuronal activity related to reward value and motivation in primate frontal cortex. Science. 2004;304:307–310. doi: 10.1126/science.1093223. [DOI] [PubMed] [Google Scholar]
- Roesch MR, Olson CR. Neuronal activity dependent on anticipated and elapsed delay in macaque prefrontal cortex, frontal and supplementary eye fields, and premotor cortex. J Neurophysiol. 2005a;94:1469–1497. doi: 10.1152/jn.00064.2005. [DOI] [PubMed] [Google Scholar]
- Roesch MR, Olson CR. Neuronal activity in primate orbitofrontal cortex reflects the value of time. J Neurophysiol. 2005b;94:2457–2471. doi: 10.1152/jn.00373.2005. [DOI] [PubMed] [Google Scholar]
- Roland PE, Larsen B, Lassen NA, Skinhøj E. Supplementary motor area and other cortical areas in organization of voluntary movements in man. J Neurophysiol. 1980;43:118–136. doi: 10.1152/jn.1980.43.1.118. [DOI] [PubMed] [Google Scholar]
- Rushworth MFS, Walton ME, Kennerley SW, Bannerman DM. Action sets and decisions in the medial frontal cortex. Trends Cogn Sci. 2004;8:410–417. doi: 10.1016/j.tics.2004.07.009. [DOI] [PubMed] [Google Scholar]
- Russo GS, Backus DA, Ye S, Crutcher MD. Neural activity in monkey dorsal and ventral cingulate motor areas: comparison with the supplementary motor area. J Neurophysiol. 2002;88:2612–2629. doi: 10.1152/jn.00306.2002. [DOI] [PubMed] [Google Scholar]
- Salinas E, Thier P. Gain modulation: a major computational principle of the central nervous system. Neuron. 2000;27:15–21. doi: 10.1016/s0896-6273(00)00004-0. [DOI] [PubMed] [Google Scholar]
- Samejima K, Ueda Y, Doya K, Kimura M. Representation of action-specific reward values in the striatum. Science. 2005;310:1337–1340. doi: 10.1126/science.1115270. [DOI] [PubMed] [Google Scholar]
- Samuelson P. A note on measurement of utility. Rev Econ Stud. 1937;4:155–161. [Google Scholar]
- Sejnowski TJ, Paulsen O. Network oscillations: emerging computational principles. J Neurosci. 2006;26:1673–1676. doi: 10.1523/JNEUROSCI.3737-05d.2006. [DOI] [PMC free article] [PubMed] [Google Scholar]
- Seo H, Lee D. Temporal filtering of reward signals in the dorsal anterior cingulate cortex during a mixed-strategy game. J Neurosci. 2007;27:8366–8377. doi: 10.1523/JNEUROSCI.2369-07.2007. [DOI] [PMC free article] [PubMed] [Google Scholar]
- Seo H, Barraclough DJ, Lee D. Dynamic signals related to choices and outcomes in the dorsolateral prefrontal cortex. Cereb Cortex. 2007;17:i110–i117. doi: 10.1093/cercor/bhm064. [DOI] [PubMed] [Google Scholar]
- Shidara M, Richmond BJ. Anterior cingulate: single neuronal signals related to degree of reward expectancy. Science. 2002;296:1709–1711. doi: 10.1126/science.1069504. [DOI] [PubMed] [Google Scholar]
- Shima K, Tanji J. Both supplementary and presupplementary motor areas are crucial for the temporal organization of multiple movements. J Neurophysiol. 1998;80:3247–3260. doi: 10.1152/jn.1998.80.6.3247. [DOI] [PubMed] [Google Scholar]
- Shima K, Tanji J. Neuronal activity in the supplementary and presupplementary motor areas for temporal organization of multiple movements. J Neurophysiol. 2000;84:2148–2160. doi: 10.1152/jn.2000.84.4.2148. [DOI] [PubMed] [Google Scholar]
- Sohn J-W, Lee D. Effects of reward expectancy on sequential eye movements in monkeys. Neural Netw. 2006;19:1181–1191. doi: 10.1016/j.neunet.2006.04.005. [DOI] [PubMed] [Google Scholar]
- Sugrue LP, Corrado GS, Newsome WT. Matching behavior and the representation of value in the parietal cortex. Science. 2004;304:1782–1787. doi: 10.1126/science.1094765. [DOI] [PubMed] [Google Scholar]
- Sutton RS, Barto AG. Reinforcement learning: an introduction. Cambridge, MA: MIT; 1998. [Google Scholar]
- Tanaka SC, Doya K, Okada G, Ueda K, Okamoto Y, Yamawaki S. Prediction of immediate and future rewards differentially recruits cortico-basal ganglia loops. Nat Neurosci. 2004;7:887–893. doi: 10.1038/nn1279. [DOI] [PubMed] [Google Scholar]
- Tanji J. Sequential organization of multiple movements: involvement of cortical motor areas. Annu Rev Neurosci. 2001;24:631–651. doi: 10.1146/annurev.neuro.24.1.631. [DOI] [PubMed] [Google Scholar]
- Tanji J, Shima K. Role for supplementary motor area cells in planning several movements ahead. Nature. 1994;371:413–416. doi: 10.1038/371413a0. [DOI] [PubMed] [Google Scholar]
- Tiesinga PHE, Fellous J-M, Salinas E, José JV, Sejnowski TJ. Synchronization as a mechanism for attentional gain modulation. Neurocomputing. 2004;58(60):641–646. doi: 10.1016/j.neucom.2004.01.108. [DOI] [PMC free article] [PubMed] [Google Scholar]
- Tobler PN, Fiorillo CD, Schultz W. Adaptive coding of reward value by dopamine neurons. Science. 2005;307:1642–1645. doi: 10.1126/science.1105370. [DOI] [PubMed] [Google Scholar]
- Tremblay L, Schultz W. Relative reward preference in primate orbitofrontal cortex. Nature. 1999;398:704–708. doi: 10.1038/19525. [DOI] [PubMed] [Google Scholar]
- Treue S, Martínez Trujillo JC. Feature-based attention influences motion processing gain in macaque visual cortex. Nature. 1999;399:575–579. doi: 10.1038/21176. [DOI] [PubMed] [Google Scholar]
- Tsujimoto S, Sawaguchi T. Neuronal activity representing temporal prediction of reward in the primate prefrontal cortex. J Neurophysiol. 2005;93:3687–3692. doi: 10.1152/jn.01149.2004. [DOI] [PubMed] [Google Scholar]
- Watanabe M. Reward expectancy in primate prefrontal neurons. Nature. 1996;382:629–632. doi: 10.1038/382629a0. [DOI] [PubMed] [Google Scholar]