

Abstract
Background and Objectives
Optical coherence tomography (OCT) is a depth resolved imaging modality that may aid in identifying sun damaged skin and the precancerous condition actinic keratosis (AK).
Study Design/Materials and Methods
OCT images were acquired of 112 patients at 2 sun protected and 2 sun exposed sites, with a subsequent biopsy. Each site received a dermatological evaluation, a histological diagnosis, and a solar elastosis (SE) score. OCT images were examined visually and statistically analyzed.
Results
Characteristic OCT image features were identified of sun protected, undiseased, sun damaged, and AK skin. A statistically significant difference (P < 0.0001) between the average attenuation values of skin with minimal and severe solar elastosis was observed. Significant differences (P < 0.0001) were also found between undiseased skin and AK using a gradient analysis. Using image features, AK could be distinguished from undiseased skin with 86% sensitivity and 83% specificity.
Conclusion
OCT has the potential to guide biopsies and provide non-invasive measures of skin sun damage and disease state, possibly increasing efficiency of chemopreventive agent trials.
Keywords: actinic keratosis, imaging, skin cancer, image processing
INTRODUCTION
OCT as an Aid in Chemoprevention
Chemoprevention is the process of using various agents to reduce the risk or delay the development of cancer [1]. The current method of assessing chemopreventive agent efficacy in skin relies on invasive biopsy with histological analysis. Optical coherence tomography (OCT) is a non-invasive imaging modality that can visualize skin structure, and may be useful for evaluating the degree of sun damage in skin and identifying pre-cancerous lesions. This study was undertaken to find image features and statistics that differentiated sun protected skin, sun damaged skin, and precancerous skin with the goal of aiding the assessment of chemopreventive agent efficacy.
A continuum has been observed from normal skin to sun damage, to actinic keratosis (AK), ending with squamous cell carcinoma (SCC). AK is a premalignant condition characterized by partial-thickness epidermal dysplasia, hyperkeratosis, parakeratosis, and solar elastosis. An actinic keratosis commonly ranges between 2 and 6 mm in diameter, and can be tan, pink, red, a combination of these, or the same pigment as adjacent skin. AKs of type I are flat with a pink macule on sun damaged skin, and are without roughness or hyperkeratosis [2]. AKs of type II have a pink to red papule and may be rough with a hyperkeratotic surface. AKs of type III are red, scaly hardened plaques on sun damaged skin. AKs are most common in fair-skinned people who are frequently exposed to the sun. Between 0.1% and 10% of AK will progress to SCC; therefore AK can be used as a marker for assessment of treatment or chemopreventive activity. SCC accounts for about 20% of the non-melanoma skin cancers (basal cell carcinoma is about 80%), but it is clinically significant because of its ability to metastasize [3]. In this study we compared OCT images of skin along a continuum: sun protected skin to sun damaged skin to actinic keratosis.
Background on Optical Coherence Tomography
OCT is a low coherence interferometry technique that produces cross-sectional images of tissue with a high resolution. Signal arises from light backscattered at index of refraction mismatches in the sample. OCT is analogous to ultrasound, in which sound waves are delivered into the body and the echo time and reflected signal magnitude are measured. However, OCT has a much higher resolution of about 5−15 μm although the penetration depth is limited to about 2 mm.
OCT has been previously used in ophthalmology, gastroenterology, urology, dentistry, and cardiology among other disciplines. In dermatology, OCT has been used in various clinical studies. These studies have shown that OCT is able to visualize the stratum corneum of glabrous skin in palmoplantar locations, the epidermis and the upper dermis of skin [4], and skin appendages and blood vessels [5]. OCT has been shown to be useful in non-invasive monitoring of cutaneous inflammation [6], hyperkeratotic conditions, and photoadaptive processes [7–9]. While diagnosis based on OCT images is normally made on the basis of image features, texture analysis of OCT images has also been used to classify the tissue type [10]. OCT has shown promise as a diagnostic tool for the detection of skin cancer. Previous experiments concluded that UV exposure can induce significant thickening of the viable epidermis and/or stratum corneum [9]. In a comparison of OCT to histology, three patients with basal cell carcinoma and three patients with melanocytic nevi were investigated [7]. Similar morphological structures were found in both OCT and histology. When examining superficial basal cell carcinoma, a subepidermal highly reflecting band was found in the OCT image that corresponded to the tumor in histological sections. OCT has also identified specific conditions of the skin, such as hyperkeratosis, parakeratosis, and formation of intradermal cavities [11].
We previously performed a pilot study suggesting that OCT is useful for identifying actinic keratosis. OCT images were taken of 20 patients, and images were grouped according to a dermatological assessment of the forearms. Images of sun damaged skin were characterized by increased signal in the epidermis and rapid attenuation of light. Images of AKs were varied and heterogeneous, with dark bands in the epidermis possibly corresponding to hyperkeratosis. In the current study, we address the main limitation of the pilot study, which is that no biopsies were taken, and therefore there was no proof that an image identified as “normal,” “sun damaged,” or “AK” was correctly designated. As well, the study population was small. The current study includes a large number of patients and histological diagnosis.
MATERIALS AND METHODS
Patient Selection
A flow chart describing the major steps in this study is shown in Figure 1. One hundred and twelve patients were selected based on a dermatologic assessment of the skin on their forearm: normal, sun damaged, or actinic keratosis. Their age ranged from 40 to 86 years old (median age 63), with 45 females and 69 males. Each patient underwent a dermatological evaluation, during which the dermatologist circled four sites of interest, one each on the left lateral and right lateral forearm, and two sites on the upper inner right arm. The dermatologist also made a dermatological evaluation of the patient's forearms, specifically the circled site. Early AKs of type I and II were selected by the dermatologist; the obvious hypertrophic type III were avoided as this type is diagnosed with less difficulty, and because early AKs can be preferred in chemopreventive studies since they present initial genetic modifications.
Fig. 1.
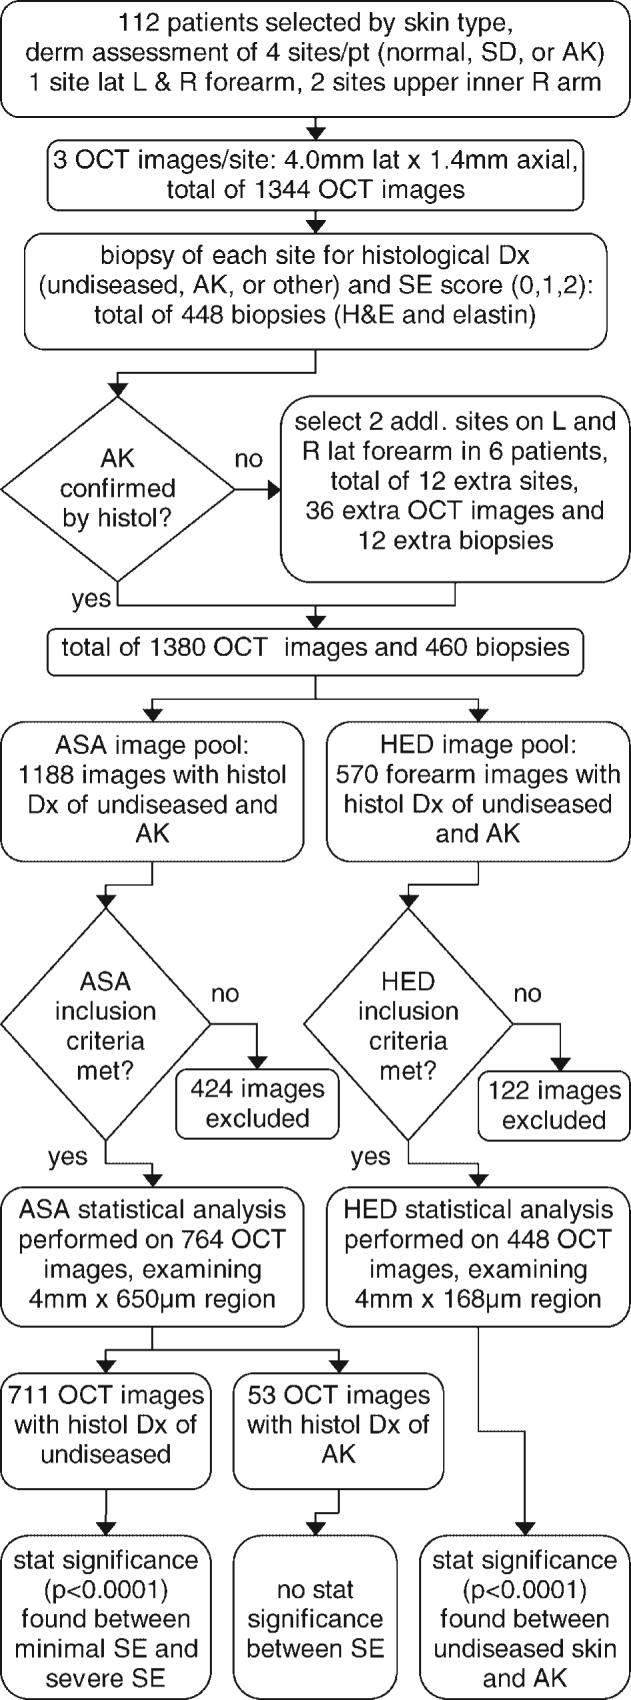
Flow chart showing the major steps in the study, including numbers of patients, images, and biopsies obtained, types of statistical image analysis, images excluded, and analysis results. Exclusion criteria for ‘average skin attenuation’ statistical analysis was (1) instrument or operator error resulting in failure to acquire images with proper settings or imaging depth, and (2) severe artifacts such as saturation or shadowing from hair/skin debris. Exclusion criteria for ‘horizontal edge detection’ was the same plus (3) severe artifacts from the surface detection procedure. addl, additional; AK, actinic keratosis; ASA, average skin attenuation; derm, dermatological; Dx, diagnosis; histol, histology; H&E, Hematoxylin & Eosin stain; HED, horizontal edge detection; L, left; lat, lateral; OCT, optical coherence tomography; pt, patient; R, right; SD, sun damaged; SE, solar elastosis; stat, statistical.
Three OCT images 1 mm apart were taken at each site. With 112 patients, 4 sites/patient, and 3 images/site, a total of 1,344 OCT images were acquired. A subsequent biopsy was performed at each site, and sections were stained with Hematoxylin & Eosin (H&E) and elastin. The elastin stain provides information used for categorization of the degree of solar elastosis (SE), a condition characterized by degradation of elastin and/or collagen. A pathologist assigned a histological diagnosis of AK or undiseased, and a solar elastosis score ranging from 0 to 2, with 0 representing minimal sun damage and 2 representing severe sun damage. With 112 patients and 4 sites/patient, 448 biopsies were taken. Six patients with an obvious dermatological presentation of AK returned for imaging and biopsy at two additional sites, one each on the left lateral and right lateral forearm because their dermato-logically assessed AKs were histologically identified as undiseased. This resulted in 12 extra sites, 36 extra OCT images and 12 extra biopsies. At the end of the study there were 1,380 OCT images and 460 biopsies. Out of these images, 1,188 images were taken of skin with a histological diagnosis of undiseased or AK; 615 undiseased images from the upper inner arm, 450 undiseased images of forearm skin, and 120 AK images of forearm skin, and 3 AK images of upper inner arm skin. The remaining images could not be linked to histological diagnosis due to biopsy processing problems, or they were obtained from sites diagnosed with non-AK pathology.
Optical Coherence Tomography System
The OCT system used in this study is shown in Figure 2. The system used an amplified fiber source (BBS1310, JDS Uniphase, Ontario, Canada) with a center wavelength λ = 1310 nm, full width half maximum spectral bandwidth 50 nm, and output power of 11.5 mW. A Fourier domain optical delay line was used to achieve axial scanning at 200 a-scans per second. The axial resolution, which depends on the center wavelength and bandwidth of the source, was theoretically calculated to be 16 μm and measured to be approximately 17 μm in air. Assuming an average tissue refractive index of 1.4, the corresponding axial resolution in tissue was 12 μm. The lateral spot size (lateral resolution) was measured to be 12 μm.
Fig. 2.
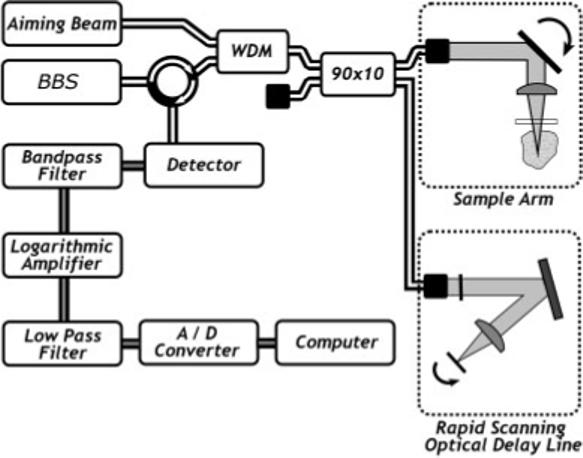
Block diagram of the optical coherence tomography system. BBS, broadband source, 90 × 10, 90 × 10 fiber coupler; A/D, analog to digital converter; RSOD, Fourier domain rapid scanning optical delay line (path length modulation).
The optical signal was detected with a solid state InGaAs detector with integrated amplifier and bandpass filters. A logarithmic amplifier circuit demodulated and amplified the signal. The demodulated signal was sampled by a data acquisition board. The board also generated a synchronized control waveform for the delay line galvanometer and the sample arm galvanometer. The sampled signal was processed and displayed as an image on the computer monitor. An image consisting of 800 a-scans required 4 seconds to acquire.
Imaging Parameters and Protocol
In preparation for imaging, hair at each forearm site was trimmed with scissors. The upper inner arm sites did not require trimming because there was minimal hair in this area. A few drops of glycerine were placed on the skin and the patient rested their arm against a thin glass plate mounted at the distal end of the sample arm optics, both to stabilize the limb and to minimize specular reflection from the skin surface. Three images at each site were obtained. The images were approximately parallel and 1 mm apart. Each image was 4.0 mm (lateral)×1.4 mm (axial) in size, and consisted of 800×625 pixels. Qualitative and quantitative assessment of each image was performed. Qualitatively, each image was analyzed based on our experience with the pilot study [8]. The following were noted: visibility of epidermis, dermis, and subcutaneous fat, presence of dark bands in the epidermis, presence of hypointense structure in the dermis, dermal texture, and depth of imaging. The resolution limitations of OCT precluded direct visualization of nuclear morphology and connective tissue matrix organization, features used for histological diagnosis and SE scoring. Therefore, analysis of OCT images was performed to determine if image features or grayscale value statistics correlated with disease status or SE score.
Image Analysis
For quantitative assessment, the usually uneven skin surface was digitally flattened. To detect the surface of the skin, a 25×25 median filter was first passed over each image. Sobel edge detection was then used to create a gradient edge map of the data set, and skeletonization was performed on this gradient edge map to create a one pixel wide thinned map. Any gaps were filled in by linear interpolation. If multiple edges were found near the top of the image, the deeper one was selected, since it was likely that the more superficial edge was a skin flake or hair. The coordinates of the edge map were used to create a new box image. The box image was created column by column, by copying all pixels between 11 and 290 pixels below the edge map (skin surface) and pasting them into an array 800 pixels wide by 280 pixels deep. The top 10 pixels below the detected skin surface were neglected because they frequently contained artifacts of the surface detection process and/or strong surface reflections. The resultant images were 4 mm lateral by 650 μm deep.
Statistics were computed of each box image. First, the mean grayscale intensity and standard deviation were computed. Second, all the columns of the box image were averaged and the image grayscale values fit to a line. The slope of this fitted line is proportional to the average skin attenuation. Fitting to a line was considered appropriate because an exponential decrease in backscattered light intensity with depth occurred, yet the demodulation electronics performed a logarithmic function on the detected signal. Because previous studies have found differences in skin with age [12,13], the data were analyzed to determine whether sorting by age or sex was necessary. Images on both the forearm and upper inner arm were evaluated. If the OCT images met any of the following criteria, as determined by consensus of two investigators, they were excluded prior to the beginning of analysis:
instrument or operator error resulting in failure to acquire images with proper settings or imaging depth (371 images).
severe artifacts such as saturation or shadowing from hair/ skin debris (53 images).
Of 1188 undiseased or AK images, 711 undiseased and 53 AK images, or 764 images in total were statistically evaluated.
A second type of analysis was performed on the image in an attempt to quantify the characteristic feature of horizontal banding seen in AK images. The top 75 pixels of the box image, which corresponds to 168 μm, were analyzed because our primary interest was in evaluating the epidermis, where disease develops. A 10×10 median filter was passed over each box image to reduce impulsive noise. Images were contrast enhanced and Sobel edge detection with a vertical gradient was performed to find horizontal edges. Any edges less than a length of 18 pixels were ignored because they were frequently generated by speckle or artifacts. The total number of pixels in the remaining edges was computed for all AK and undiseased images used in the analysis, and called ‘horizontal edge detection’. This metric was computed for all forearm images with a histologically confirmed diagnosis of AK or undiseased. Upper inner arm images were not included because it is extremely rare for an AK to occur on the upper inner arm (there was only 1 in this study). Five hundred seventy forearm images were histologically confirmed to come from sites that were undiseased or AK. If any images met the following criteria as determined by consensus of two investigators, they were excluded prior to the beginning of analysis:
instrument or operator error resulting in failure to acquire images with proper settings or imaging depth (91 images).
severe artifacts such as saturation or shadowing from hair/ skin debris (19 images).
severe artifacts from the surface detection procedure (12 images).
Of 570 undiseased and AK forearm images 448 were statistically evaluated.
Statistical Analysis
The study design required the use of statistical methods that accommodate correlated outcome measurements. Each study participant was imaged at multiple sites, which are likely to be correlated with each other (i.e., participant A's sites are likely to resemble each other more closely than they resemble sites on participant B). Within each site three images were taken, and these images were also likely to be correlated with each other. To account for the nesting of images within sites within participants, mixed effects models were used for the continuous outcomes of ‘average skin attenuation’ and ‘horizontal edge detection.’ In those models, participants and sites were treated as random effects, while SE score and disease status were treated as fixed effects. SE was coded as 0 (minimal), 1 (moderate), or 2 (severe). AK status was coded as 0 (undiseased) or 1 (AK). Hypothesis testing involved comparing the ‘average skin attenuation’ and ‘horizontal edge detection’ coefficients for SE and AK status to the null hypothesis of zero.
RESULTS AND DISCUSSION
Image Characteristics
Figures 3–8 show typical OCT images and corresponding histology of various skin types. Figure 3a is an OCT image of the upper inner arm. In this example, as well as nearly all upper inner arm images, there was minimal sun damage. Figures 4a and 5a are OCT image examples from undis-eased forearms, with minimal and severe sun damage, respectively. Figures 6a, 7a, and 8a show three example OCT images from AK sites, illustrating the heterogeneity of image appearance in this disease. Figures 3b–8b are histology obtained at the sites shown in the corresponding OCT image.
Fig. 3.
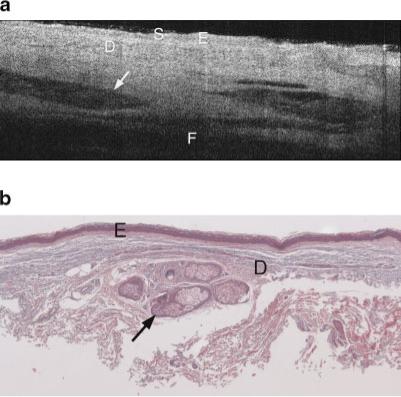
a: Example OCT image of upper inner arm of a 74-year-old male. Image shows high penetration depth, with clearly visible layers of epidermis, dermis, and subcutaneous fat, and high-contrast dermal structures. S, stratum corneum; E, epidermis; D, dermis; F, subcutaneous fat. Arrow points to hair follicle. b: Histology from same upper inner arm site as (a), with a histological diagnosis of undiseased and an SE score of 0. Arrow points to hair follicle. Symbols defined in (a).
Fig. 8.
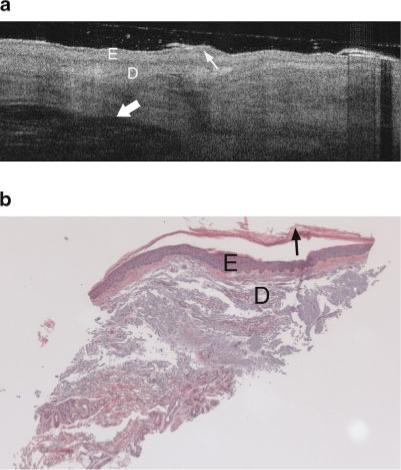
a: Example OCT image of an AK on the lateral forearm of a 64-year-old female. Increased epidermal thickness and strong signal attenuation are seen in this image. Arrow points to keratinized region. Symbols defined in Figure 6a. b: Histology from same region as Figure 8a, with thickened epidermis, a histological diagnosis of AK and SE score of 2. Symbols defined in Figure 6a.
Fig. 4.
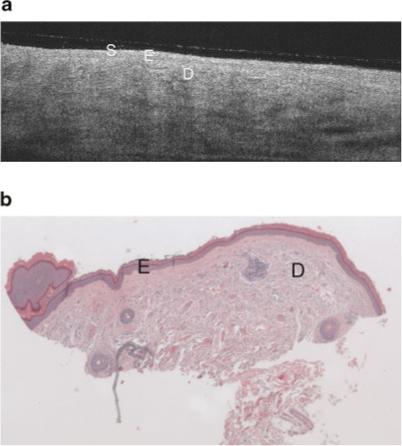
a: Example OCT image of minimal sun damaged lateral forearm of a 56-year-old female. This image shares similar epidermal characteristics the sun protected skin image (Fig. 3a), however there is lower grayscale contrast in the dermis (less visibility of dermal structures), and the subcutaneous fat layer is generally not seen. Symbols defined in Figure 3a. b: Histology from same site as (a), with a histological diagnosis of undiseased and an SE score of 0. Symbols defined in Figure 3a.
Fig. 5.
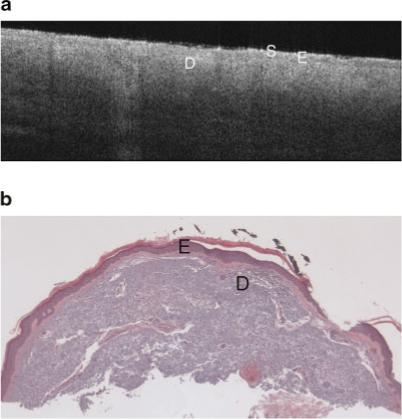
a: Example OCT image of severely sun damaged lateral forearm of a 65-year-old female. The image penetration depth is lower than seen in the minimal sun damaged skin image (Fig. 4a). Symbols defined in Figure 3a. b: Histology from same site as Figure 5a with a histological diagnosis of undiseased and an SE score of 2. Symbols defined in Figure 3a.
Fig. 6.
a: Example OCT image of an AK on the lateral forearm of a 77-year-old male. This AK image includes a thick dark band in the stratum corneum, which appears to be correspond to the thick keratin layer seen in corresponding histology. b: The vertical shadowing is caused by skin flaking within the keratinized region. Strong signal attenuation in the dermis is seen, similar to severely sun damaged sites (Fig. 5a). E, epidermis; D, dermis. Arrow points to keratinized region. b: Histology from same site as (a), with a very thick keratin layer, histological diagnosis of AK and an SE score of 2. Symbols defined in (a).
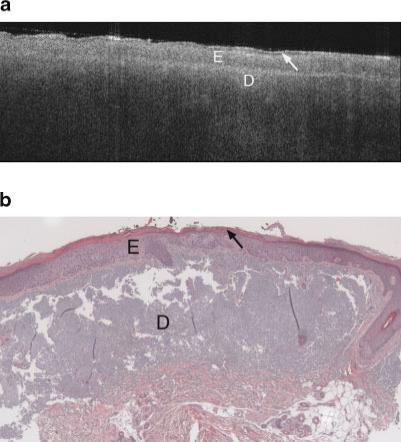
Fig. 7.
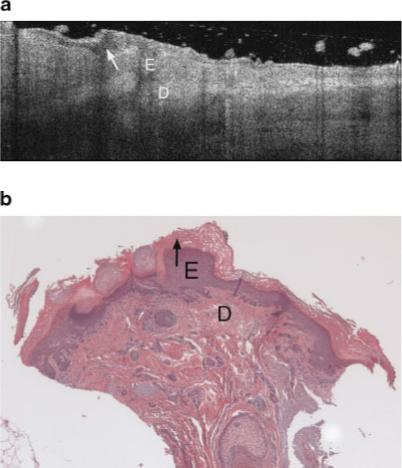
a: Example OCT image of an AK on the lateral forearm of a 74-year-old male. An increase in epidermal thickness compared to undiseased skin is seen in both OCT image and histology. Dermal structures such as a hair follicle are clearly seen (thick arrow), although wavy banding in the dermis is distinctly unusual compared to the undiseased skin case (Fig. 4a,b). Thin arrow points to keratinized region. Symbols defined in Figure 6a. b: Histology from same site as (a), with a thickened epidermis, histological diagnosis of AK and SE score of 2. Symbols defined in Figure 6a.
In general, the image characteristics in this clinical trial agree with the findings from our previous pilot study. Although glycerine was used to index-match the glass plate and the patient's skin, and the glass plate was tilted slightly to further suppress this reflection, it is still visible in some images as a thin line slightly above the skin surface. The image of the upper inner arm (Fig. 3a) shows a high penetration depth, with clearly visible layers of epidermis, dermis, and subcutaneous fat, similar to the characteristics found in the pilot study. The boundary between the glycerine and the skin appears bright, then the first tissue layer, the epidermis, appears relatively homogeneous and hypointense. A deeper brightly reflecting layer is seen below the epidermis. By comparing OCT images with confocal microscopy images, it has been shown that this hyperintense layer in OCT images is not the epidermal-dermal junction [12]. Rather, it appears to be caused by a layer of fibrous structure in the dermis that may be due to the transition from the papillary to the reticular dermis. Therefore in general in OCT images, the papillary ridges are not well defined. This effect may be heightened in our study because of the demographics of our patient population; age has been shown to flatten the dermoepidermal junction [12]. While individual collagen and elastin bundles cannot be seen, their cumulative backscattering and attenuation creates a characteristic texture. Various hypointense regions are visualized in the dermis, which appear to correspond to blood vessels, hair follicles, and glands. The deepest layer is the subcutaneous fat, which is weakly backscattering and thus nearly absent of signal. In all upper inner arm images, the penetration depth and contrast was high.
A change in image characteristics was seen in sun exposed forearm OCT images as sun damage progressed from minimal to severe (SE = 0 and 2, shown in Figs. 4a and 5a, respectively). The sun exposed forearm images share similar epidermal characteristics as those from sun protected sites, but the subcutaneous fat layer is not seen in forearm images. The signal is generally attenuated more rapidly with increasing severity of sun damage, leading to decreased image penetration depth. This decrease could be a result of an increase in melanin, which scatters light effectively due to its high index of refraction [14], or increased attenuation caused by the dermal solar elastosis. The difference in depth of penetration was subtle but highly repeatable. In general, lower dermal grayscale contrast was also seen in more severely sun damaged sites.
The AK images were very heterogeneous. The majority of images showed a dark band in the stratum corneum, which appears to be associated with hyperkeratosis since compacted keratin is weakly scattering, and a thickened keratin layer was seen in corresponding histology. The epidermis in AK images often exhibited bright horizontal reflections due to flaking within the keratinized region. In cases where a thick keratinized layer was present, a distinct boundary was observed between the keratinized region and underlying epidermis. These image characteristics are similar to our previous findings [8]. An increase in epidermal thickness compared to undiseased skin was usually observed in both OCT images and histology. Unlike undiseased skin, the epidermis in AK images could appear relatively hyperintense, possibly because of increased backscatter from the dysplastic cells or parakeratosis. In many cases, a distinct boundary at a depth consistent with the epidermal-dermal junction was observed. Vertical shadowing from skin flakes was common. Attenuation in the dermis, however, was often strong, similar to severely sun damaged sites. However, a great deal of variability existed from site to site. Figure 6a shows an AK image with a very thick keratin layer, also seen in the corresponding histology (Fig. 6b). This image has significant vertical shadowing caused by skin flakes. Figures 7a and 8a show OCT images of AK sites with less prominent dark bands, but a significantly thickened epidermis as verified in the corresponding histology Figures 7b and 8b. In Figure 7a, dermal structures such as a hair follicle are clearly seen, although the wavy banding in the dermis is distinctly unusual compared to the undiseased skin case. In Figure 8a the signal is attenuated quickly.
Statistical Results
Analysis showed that there was no relationship between the image metrics of grayscale mean or grayscale standard deviation and either SE or disease status. Therefore these image metrics will not be discussed further. For no metric was a significant difference seen between male and female. For ‘average skin attenuation,’ a trend of lower magnitude was seen with increasing age. However this result was not statistically significant so no stratification by age was performed. Results of ‘average skin attenuation’ and ‘horizontal edge detection’ analysis for SE and disease status are given below.
A mixed model nesting site within participant was fit for the OCT image metric ‘average skin attenuation.’ Exploratory analysis showed that the relationship between ‘average skin attenuation’ and SE status differed between undiseased and AK sites, so separate models were conducted for each. This difference may be attributed to anatomy—the AKs have a thick and variable keratin layer that attenuates relatively little light, thus possibly increasing the amount of light collected from reflections deep in the tissue, and altering the OCT image metric ‘average skin attenuation.’ The SE variable was recoded as three indicator variables: minimal SE, moderate SE, and severe SE. Each of those variables took on a value of 1 if the image fit that category and 0 otherwise. Results show that for AK images, SE status had no relationship with ‘average skin attenuation.’ However, in undiseased images, there was a relationship.
The predicted means of the indicator variables for ‘average skin attenuation’ in undiseased images and their 95% confidence intervals are graphed in Figure 9. While there is no statistically significant difference in the predicted value of ‘average skin attenuation’ between moderate SE and minimal SE, there is a significant difference ( p < 0.0001) between severe SE and minimal SE. It can be seen that a monotonic trend for ‘average skin attenuation’ exists from minimal SE through severe SE, suggesting that the overall relationship may be one with biological significance. A test for trend in the ‘average skin attenuation’ measurements for biopsies with a normal histologic diagnosis showed a highly statistically signifi-cant ( p < 0.0001) decreasing trend as a function of increasing SE. It is not unexpected that the confidence intervals for the SE categories overlap, since SE is a continuum and there is variation in pathologist categorical assignment. The increasing negativity of ‘average skin attenuation’ with more severe SE may be correlated to tissue optical properties—for example, increased scattering from melanin and degraded collagen/elastin will cause an increase in the overall skin attenuation coefficient, leading to less light reflected from deep in the tissue and a more rapid fall-off of image grayscale values.
Fig. 9.
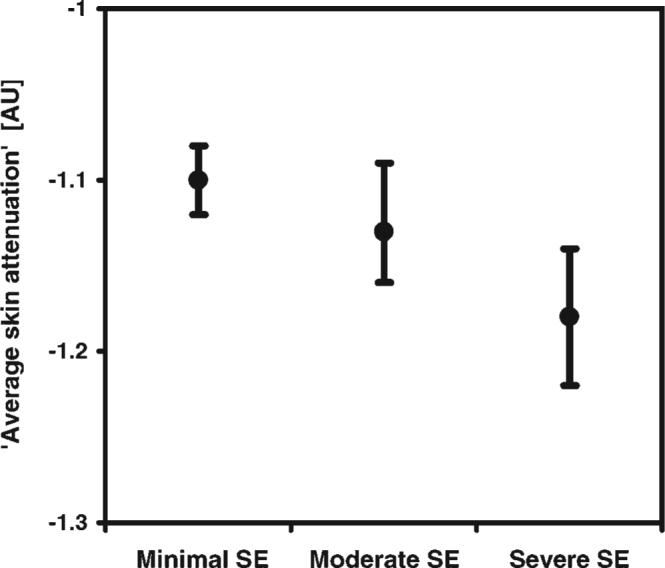
Predicted means of ‘average skin attenuation’ (arbitrary units) and 95% confidence intervals versus solar elastosis score for undiseased skin. Statistical significance (p < 0.0001) was found between severe SE and minimal SE images, where N = 764 images.
A similar mixed model was conducted for the outcome ‘horizontal edge detection.’ Preliminary analysis showed that solar elastosis damage did not contribute to understanding the relationship between ‘horizontal edge detection’ and AK status, and so the SE variables were omitted from the final model. Otherwise, the models were constructed in parallel fashion. There was a statistically significant difference in ‘horizontal edge detection’ values between undiseased and AK images (P < 0.0001). The predicted means along with their confidence intervals are graphed in Figure 10.
Fig. 10.
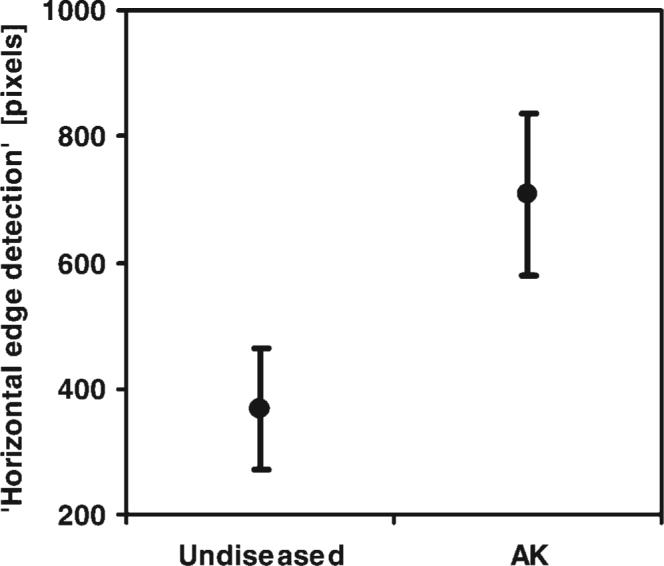
Predicted means of ‘horizontal edge detection’ (pixels) and 95% confidence intervals versus histologic diagnosis. A statistically significant difference between undiseased and AK images was found (p < 0.0001), where N = 448 images.
The sensitivity and specificity of AK diagnosis were calculated using two different OCT image measures. Using the ‘horizontal edge detection’ image metric, a Receiver Operating Characteristic (Fig. 11) was generated by varying the threshold of ‘horizontal edge detection’ for diagnosis of disease. The boxed value illustrates one compromise between sensitivity and specificity, 73% and 65% respectively. Greater sensitivity and specificity were obtained, albeit not in an automatic fashion, by evaluating image features. The presence of a dark band in the epidermis enabled detection of AK with 86% sensitivity and 83% specificity. In comparison, for dermatological assessment the sensitivity and specificity were 98% and 62% respectively.
Fig. 11.

Receiver Operating Characteristic of AK diagnosis using ‘horizontal edge detection.’ The chart was created as its discrimination threshold of ‘horizontal edge detection’ for diagnosis of disease was varied. The boxed data point illustrates one compromise between sensitivity and specificity; 73% and 65%, respectively.
This analysis points out the strengths and weaknesses of dermatological assessment and OCT diagnosis. The dermatological assessment had very high sensitivity, with only one false negative (a site assessed as undiseased by the dermatologist having a histological diagnosis of AK). However, the specificity was poor, and there were many more false positive than true positive diagnoses. The calculated dermatological positive predictive value (PPV) was only 37%. As mentioned previously, early AKs of type I and II with more subtle presentation were desired for this chemoprevention study; this fact may contribute to the low PPV. OCT, while having worse sensitivity, had only about half the number of false positives compared to dermato-logical assessment. When the dermatologically identified AK sites were imaged with OCT, the positive predictive value was increased to 46%. It is important to note that histological diagnosis of AK by a trained pathologist may not be perfectly accurate, which may confound these calculated values.
The high number of dermatological false positives helps explain why the OCT dark band feature sensitivity performed more poorly in this study than in the pilot study, where it was 100% sensitive and 80% specific compared with dermatological assessment. The vast majority of OCT false positives (82%) were also dermatological false positives. It is possible that ultrahigh resolution OCT would allow visualization of additional anatomical details that could be related to SE score (or to AK determination), therefore improving sensitivity. However, it is unlikely that the resolution would be high enough to visualize cell nuclei and connective tissue bundles, which are the features examined for diagnosis of AK and grading of sun damage in gold standard histology. Achieving high resolution may be difficult based on the experiences of reflectance confocal microscopy, where imaging of AK was often compromised by the thick hyperkeratotic layers [15].
OCT as a Biomarker
We have shown that there are qualitative and statistically significant quantitative differences in OCT image features of skin with varying degrees of sun damage, and between undiseased skin and AK. Image grayscale ‘average skin attenuation’ is monotonically associated with SE score and has a statistically significant difference between minimal and severe SE. Moreover, a high value for ‘horizontal edge detection,’ presence of an epidermal dark band, and large epidermal thickness are all associated with AK. A short-term goal is to use OCT to better target sites for biopsy in chemoprevention studies. From a practical standpoint, reducing the number of false positive diagnoses can reduce the number of patients (thus time and cost) needed for a study. The ultimate goal, however, is to use OCT as a biomarker, with the ability to bring in a patient, measure an image characteristic and determine if sun damage has increased or decreased, or if an AK has emerged or regressed at a given site. This would obviate the need for biopsies completely.
We have noted that variability in OCT image characteristics for sites with the same SE score and disease status is much smaller intra-patient than inter-patient. For example, three images from the same forearm sites of 10 randomly chosen patients with undiseased skin and severe SE had on average a maximum percent difference of 6% between highest and lowest measures of ‘average skin attenuation,’ whereas the maximum percent difference between patients was on average 31%. If repeated images can be obtained within a few millimeters of each other, through measurements from anatomical landmarks, OCT performance may be improved in longitudinal studies. We are currently conducting a longitudinal study to test this hypothesis. Future work will also include using texture analysis to evaluate OCT images, as we have shown in previous work that texture analysis can distinguish between tissue types even in the absence of visible OCT image features [10].
ACKNOWLEDGMENTS
This research was partially supported by a grant from the National Institutes of Health (P01 CA27502).
Contract grant sponsor: National Institutes of Health; Contract grant number: P01 CA27502.
REFERENCES
- 1.Stratton SP, Dorr RT, Alberts DS. The state-of-the-art in chemoprevention of skin cancer. Eur J Cancer. 2000;36:1292–1297. doi: 10.1016/s0959-8049(00)00108-8. [DOI] [PubMed] [Google Scholar]
- 2.Cockerell CJ. Histopathology of incipient intraepidermal squamous cell carcinoma (“Actinic Keratosis”). J Am Acad Dermatol. 2000;42:S11–S17. doi: 10.1067/mjd.2000.103344. [DOI] [PubMed] [Google Scholar]
- 3.Salasche SJ. Epidemiology of actinic keratoses and squamous cell carcinoma. J Am Acad Dermatol. 2000;42:S4–S7. doi: 10.1067/mjd.2000.103342. [DOI] [PubMed] [Google Scholar]
- 4.Welzel J, Lankenau E, Birngruber R, Engelhardt R. Optical coherence tomography of the human skin. J Am Acad Dermatol. 1997;37:958–963. doi: 10.1016/s0190-9622(97)70072-0. [DOI] [PubMed] [Google Scholar]
- 5.Gambichler T, Moussa G, Sand M, Sand D, Altmeyer P, Hoffmann K. Applications of optical coherence tomography in dermatology. J Dermatol Sci. 2005;40:85–94. doi: 10.1016/j.jdermsci.2005.07.006. [DOI] [PubMed] [Google Scholar]
- 6.Welzel J, Bruhns M, Wolff HH. Optical coherence tomography in contact dermatitis and psoriasis. Arch Dermatol Res. 2003;295:50–55. doi: 10.1007/s00403-003-0390-y. [DOI] [PubMed] [Google Scholar]
- 7.Bechara FG, Gambichler T, Stucker M, Orlikov A, Rotterdam S, Altmeyer P, Hoffmann K. Histomorphologic correlation with routine histology and optical coherence tomography. Skin Res Technol. 2004;10:169–173. doi: 10.1111/j.1600-0846.2004.00038.x. [DOI] [PubMed] [Google Scholar]
- 8.Barton JK, Gossage KW, Xu W, Ranger-Moore JR, Saboda K, Brooks CA, Duckett LD, Salasche SJ, Warneke JA, Alberts DS. Investigating sun-damaged skin and actinic keratosis with optical coherence tomography: A pilot study. Technol Cancer Res Treat. 2003;2:525–535. doi: 10.1177/153303460300200605. [DOI] [PubMed] [Google Scholar]
- 9.Gambichler T, Kunzlberger B, Paech V, Kreuter A, Boms S, Bader A, Moussa G, Sand M, Altmeyer P, Hoffmann K. UVA1 and UVB irradiated skin investigated by optical coherence tomography in vivo: A preliminary study. Clin Exp Dermatol. 2005;30:79–82. doi: 10.1111/j.1365-2230.2004.01690.x. [DOI] [PubMed] [Google Scholar]
- 10.Gossage KW, Tkaczyk TS, Rodriguez JJ, Barton JK. Texture, analysis of optical coherence tomography images: Feasibility for tissue classification. J Biomed Opt. 2003;8:570–575. doi: 10.1117/1.1577575. [DOI] [PubMed] [Google Scholar]
- 11.Gladkova ND, Petrova GA, Nikulin NK, Radenska-Lopovok SG, Snopova LB, Chumakov YP, Nasonova VA, Gelikonov VM, Gelikonov GV, Kuranov RV, Sergeev AM, Feldchtein FI. In vivo optical coherence tomography imaging of human skin: Norm and pathology. Skin Res Technol. 2000;6:6–16. doi: 10.1034/j.1600-0846.2000.006001006.x. [DOI] [PubMed] [Google Scholar]
- 12.Neerken S, Lucassen GW, Bisschop MA, Lenderink E, Nuijs TAM. Characterization of age-related effects in human skin: A comparative study that applies confocal laser scanning microscopy and optical coherence tomography. J Biomed Opt. 2004;9:274–281. doi: 10.1117/1.1645795. [DOI] [PubMed] [Google Scholar]
- 13.Leveque JL, Corcuff P, Derigal J, Agache P. In vivo studies of the evolution of physical-properties of the human-skin with age. Int J Dermatol. 1984;23:322–329. doi: 10.1111/j.1365-4362.1984.tb04061.x. [DOI] [PubMed] [Google Scholar]
- 14.Rajadhyaksha M, Grossman M, Esterowitz D, Webb RH. In-vivo confocal scanning laser microscopy of human skin—Melanin provides strong contrast. J Invest Dermatol. 1995;104:946–952. doi: 10.1111/1523-1747.ep12606215. [DOI] [PubMed] [Google Scholar]
- 15.Aghassi D, Anderson RR, Gonzalez S. Confocal laser microscopic imaging of actinic keratoses in vivo: A preliminary report. J Am Acad Dermatol. 2000;43:42–48. doi: 10.1067/mjd.2000.105565. [DOI] [PubMed] [Google Scholar]