Abstract
We monitored survival and reproduction of 1000 individuals of Caenorhabditis elegans wild type (N2) and 800 individuals of clk-1 and daf-2, and used biodemographic analysis to address fitness as the integrative consequence of the entire age-specific schedules of survival and reproduction. Relative to N2, the mutants clk-1 and daf-2 extended average life span by 27% and 111%, respectively, but reduced net reproductive rate by 44% and 18%. The net result of differences in survival and fertility was a significant differential in fitness, with both clk-1 (λ = 2.74) and daf-2 (λ = 3.78) at a disadvantage relative to N2 (λ = 3.85). Demographic life table response experiment (LTRE) analysis revealed that the fitness differentials were due to negative effects in mutants on reproduction in the first 6–7 days of life. Fitness costs in clk-1 and daf-2 of C. elegans are consistent with the theory of antagonistic pleiotropy for the evolution of senescence.
The nematode Caenorhabditis elegans has become a widely used model organism for studies of aging and biodemography (1–10). Its developmental biology and genetics are being intensively studied. There exist many genetically characterized longevity mutants of C. elegans, and their study is an important and growing part of gerontology (10–12). There has been a huge amount of work undertaken on longevity genes relative to longevity extension and other traits including aspects of reproduction, competitive ability, and survival relative to environment and stresses (3,4,9,10,13–18).
Here we focus on two of these longevity mutants that are particularly well characterized and understood: clk-1 and daf-2. The clk-1 gene codes an enzyme required for coenzyme Q synthesis, and mutations in clk-1 influence metabolic activity and lead to reduced respiration, slowed developmental and physiological processes, and extended longevity that may be due in part to reduced production of reactive oxygen species (5,7,9,12,19–21). The gene daf-2 codes for an insulin/insulin-like growth factor type I (IGF-I) receptor involved in an insulin-like signaling cascade, and mutants are temperature-sensitive dauer-constitutive with extended longevity (1,3,7,10). Insulin/IGF-I signaling is part of a signaling cascade that influences life span; this signaling pathway has been reviewed by Kenyon (10).
In this article, we extend the analysis of clk-1 and daf-2; our focus is on the demographic differences among genotypes and their fitness consequences (22–26). Studies of the evolution, as opposed to the mechanisms, of aging require estimates of the fitness consequences, but they have seldom been estimated for C. elegans. This is an important and potentially confusing point; fitness is an integrative consequence of the entire age-specific (or, more generally, stage-specific) schedules of survival and reproduction. Comparisons of survival alone, or of fertility alone, do not reveal fitness differences. Nor do comparisons of summary indices of survival and fertility (e.g., median longevity, total brood size, average reproductive output, generation time). It might appear that the fitness effects of longevity mutants have been documented, but much of the research has addressed effects of mutations on fitness components, not on fitness itself. For example, measurements of realized population growth [e.g, (14,16)] allow the population itself to integrate survival and fertility, and thus do provide an index of fitness. They have the drawback, however, of providing no information on the causation of the putative fitness differences revealed (i.e., are differences due to differences in survival, or fertility, in what proportions, at what ages?).
Biodemographic studies of aging must address the evolution of life span, which requires estimates of fitness. Senescence (the increase of mortality rate with age) has long been a particularly difficult evolutionary problem (22,27,28). One explanation views the evolution of senescence as resulting from an indirect effect of selection for genes with favorable effects on fitness at early ages but negative effects at later ages—an explanation termed “antagonistic pleiotropy” (22,29). Studies of mortality in general, and senescence in particular, must include complete measures of fitness, including survival, fertility, and the timing of events in the life cycle, as only then will the pleiotropic effects on fitness of longevity mutants be revealed.
Especially when dealing with longevity as a trait, analysis of fitness is rendered more powerful by the use of large cohorts, because such cohorts provide sufficient numbers for the actuarial properties of the cohort to be measured, including those of the oldest individuals (30). Such large-cohort studies exist for the Mediterranean fruit fly Ceratitis capitata (26), Drosophila melanogaster (31), and C. elegans (9). However, most studies of the life span of C. elegans have used relatively small cohorts (32,33).
Here we subject a large cohort data set to demographic analysis, and report on deleterious fitness consequences of extended life span in C. elegans longevity mutants clk-1 and daf-2. Our goals are to: 1) analyze the relationship of reproduction and longevity, 2) quantify the fitness of each strain, 3) document the demographic bases of fitness differences in terms of tradeoffs between survival and reproduction, and 4) explore the relationships between life span and age-specific fertility at the individual level. We do this using a combination of survival analyses, event history diagrams, matrix population models, and life table response experiment (LTRE) analyses. Our results provide, for the first time, a quantitative analysis of the fitness tradeoffs associated with longevity mutations in C. elegans.
METHODS
Genotypes
Strains used in the study were: 1) N2, wild type, 2) MQ 130, clk-1(qm30) III, and 3) DR1572, daf-2(e1368) III (a class 1 allele of daf-2). The wild-type (N2 var Bristol; DR subclone of CB original, Tc1 pattern I), clk-1, and daf-2 worms were obtained from the Caenorhabditis Genetic Center at the University of Minnesota, St. Paul in October 2000. All experimental cohorts were two generations removed from a frozen culture maintained at −80°C (34).
Experiments
Experiments were based on cohorts followed until the death of the last individual. To initiate cohorts, frozen stock was placed on nematode growth medium (NGM) seeded with Escherichia coli strain OP-50 (35) at 20°C. Four days later, the eggs laid on the plate were transferred onto new NGM with OP-50. In 3 days, these eggs developed into mature hermaphrodites laying eggs. First-stage juveniles, newly hatched from the eggs, were used to initiate cohorts. Cohorts were followed 200 worms at a time, and all experiments were conducted in the same laboratory using the same equipment under the same conditions, with the same personnel, to provide consistency.
Worms were transferred individually onto 60 mm × 15 mm NGM plates seeded with 1-day-old OP-50 and then maintained in the dark at 20°C in a constant temperature incubator. Worm survival was monitored daily. Survival was determined by observing worms for movement. If no movement was observed for 5–10 seconds, the plate was gently tapped to elicit movement; absent motion, the worm was gently touched near the head with a small piece of agar and then a nematode pick (8). Worms that failed to move were considered dead.
During the time that a worm was laying eggs it was transferred each day to new NGM. To avoid mechanical damage, a small block of agar was cut from beneath the worm and transferred, with the worm, to new medium. After the worm had crawled off of the agar block, the block was removed from the plate. Each day, individual worm survival was assessed, and progeny were counted as juveniles emerging from eggs (1 day after eggs were laid) (8). Because facultative vivipary is a life-history trait in C. elegans (36,37), the few adults that died because of the internal hatch of eggs were included in this study. Experiments were initiated with 200 individual worms, with new experiments started at 2-week intervals to yield a total of 2600 individual worms. The experimental cohorts included wild-type (1000 individual worms total) and two longevity mutant strains (800 individual worms each).
Demographic Analysis
Standard life table parameters were calculated as described by Carey (24,26). Age-specific survivorship lx was calculated as the proportion of individuals surviving to age x. The expectation of life (e0; the average days remaining to an individual at birth) is defined as:
In practice, we calculated it from the fundamental matrix [(38), eq. 3.5]. The force of mortality at age x was calculated as:
The maternity function mx was measured as the mean number of juvenile progeny produced per worm per day at age x. The survival and reproduction history of each individual was depicted using a color-coded event history chart (39).
The cohort generation time is the mean age of the parents of the offspring produced by a cohort over its lifetime. It is defined as:
in practice, we computed it from the fundamental matrix (38).
For analysis of population growth and fitness, the survival and maternity data were combined to construct an age-classified matrix population model [birth-flow, projection interval of 1 day; see (25)]
where n is a vector giving the abundance of the age classes, and A is a population projection matrix which contains age-specific survival probabilities Pi on the subdiagonal and age-specific fertilities Fi in the first row. Such a population will eventually grow exponentially at a rate λ given by the dominant eigenvalue of A. This rate is a measure of fitness that integrates survival, reproduction, and the effects of the timing of reproduction; it can be interpreted as either a measure of mean fitness (23) or as the invasion exponent (40). We also calculated the net reproductive rate R0 (the average number of offspring produced by an individual over its lifetime) and the sensitivity of population growth rate to changes in age-specific survival and fertility.
To determine the sources of the differences in fitness among genotypes, we performed an LTRE analysis [(25) Section 10.1 (41)]. Let AN2, Aclk-1, and Adaf-2 be the projection matrices for the three genotypes. Using AN2 as a reference, the fitness difference between wild type (N2) and the strain of interest (here clk-1) can be written as follows:
where the superscripts denote genotypes. The terms in the first summation are the contributions to the fitness effect of differences in age-specific survival. The terms in the second summation are the contributions of differences in age-specific fertility. The partial derivatives are the sensitivities of λ to age-specific survival and fertility, and are calculated from A following Caswell [(25), Section 9.1].
Statistical Analysis
Confidence intervals were computed on all estimated quantities using bootstrap resampling methods (42), following [(25), Section 12.1]. Each individual, with its age at death and its history of reproduction, was treated as a unit. Bootstrap data sets were created by randomly sampling 1000 individuals (for N2) or 800 individuals (for clk-1 and daf-2), with replacement, from the real data sets. Bootstrap estimates of all demographic parameters were created by applying to the bootstrap data set the same algorithm used for the real data. The 95% confidence intervals were computed using the percentile method [because all quantities were nearly median-unbiased, no bias correction was applied; cf. (42)].
Significance tests were carried out using nonparametric randomization tests (25,43). Comparisons of N2 with clk-1 and daf-2 were conducted for survival (lx), reproduction (mx), age at death (dx), mortality (µx), lambda (λ), life expectancy (ex), and generation time. Test statistics, measuring the differences between strains, were defined for each estimated quantity, as follows.
1. For all scalar measures (life expectancy, λ, generation time), the absolute value of the difference between strains.
2. Survivorship. Let l be the vector of age-specific survivorship. The test statistic was the ∞-norm of the difference between the two functions,
This is equivalent to the test statistic used for the 2-sample Kolmogorov–Smirnov test of the difference between two cumulative probability distributions.
3. Age at death. Let d be the vector giving the probability of death at each age. The test statistic was the 1-norm of the difference between the two distributions,
this is a standard measure of the difference between two probability distributions.
4. Fertility and the force of mortality. Let m be the vector giving age-specific fertility. The test statistic was the 2-norm of the difference between the two vectors,
which is appropriate as these are simply non-negative vectors. This test statistic was also used for mortality (µx).
To obtain the distribution of the test statistics under the null hypothesis, individuals (with their complete record of reproduction and age at death) were randomly permuted between treatments, maintaining sample sizes. The permuted data were then subjected to the same analyses as the original data, and the relevant test statistic calculated for each of 2000 permuted data sets. The statistical significance of the observed test statistic is the proportion of the permutation statistics greater than or equal to the observed value.
RESULTS
Survival (lx), reproduction (mx), age at death (dx), mortality (µx), lambda (λ), life expectancy (ex), and generation time were significantly different (p ≤ 0005) between N2 and clk-1 and between N2 and daf-2 (p = .002 for the comparison of µx between N2 and clk-1).
Survival
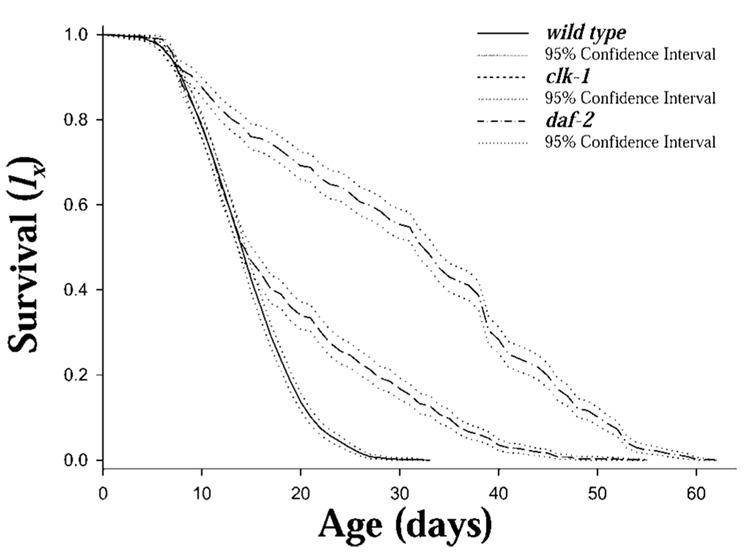
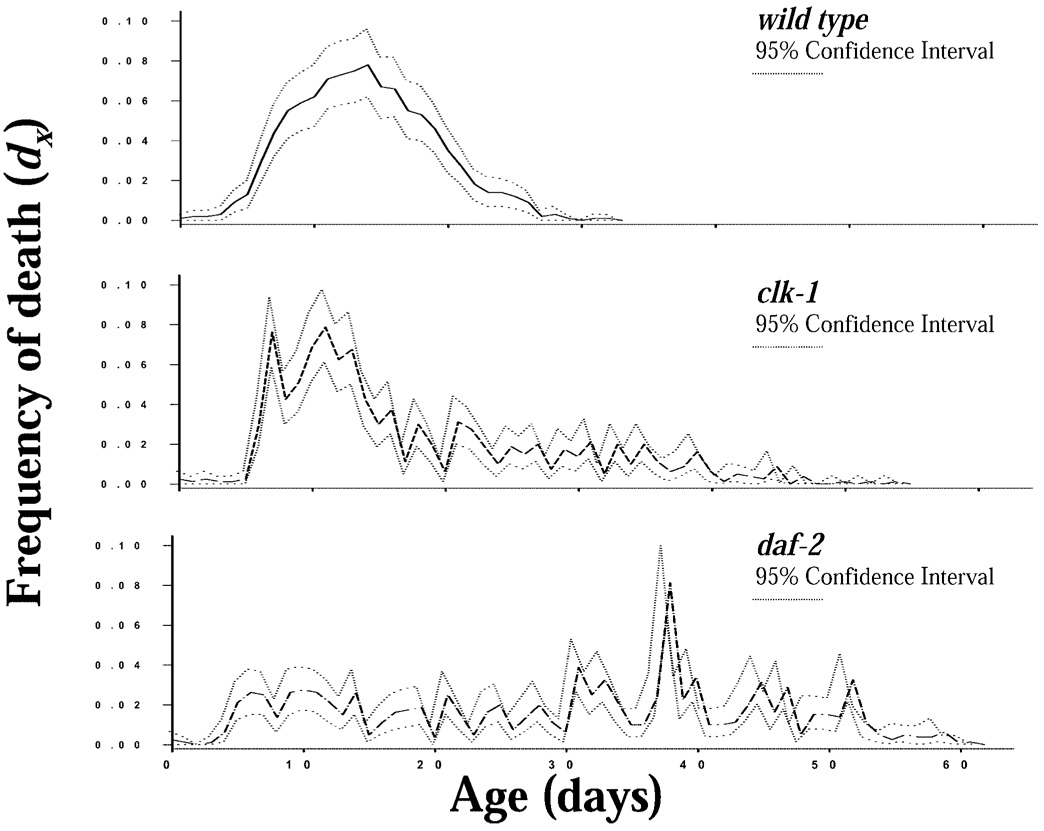
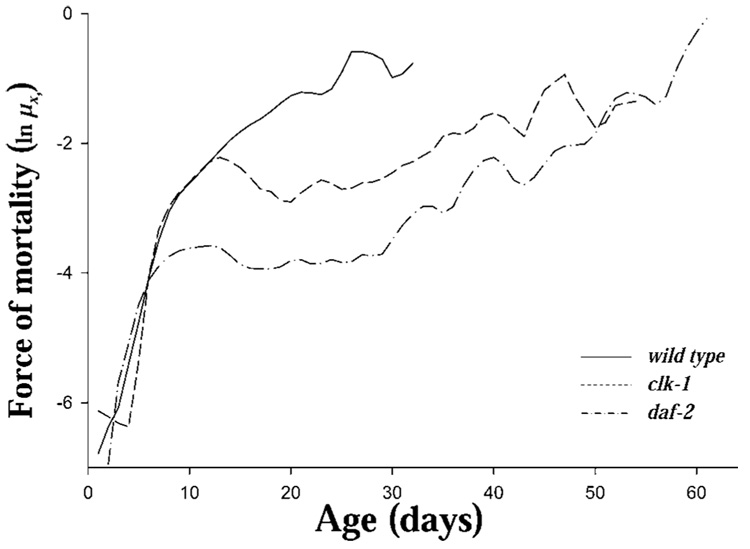
The clk-1 and daf-2 mutants both increased survival relative to N2 (Figure 1). Life expectancies at birth (e0) for N2, clk-1, and daf-2 were 14.3, 18.3, and 30.3 days, respectively (Table 1). The distribution of age at death (dx) (Figure 2) is concentrated between 5 and 20 days for N2, between 5 and 15 days with a long tail extending to 50 days in clk-1, and nearly uniformly distributed between 5 and 60 days, with fluctuation, in daf-2. The age patterns of the mortality (ln µx Figure 3) were different among the strains. N2 exhibited a generally increasing mortality, with the slope changing at about Day 8, with a decreasing slope until approximately Day 23, whereas clk-1 and daf-2 showed an increase until Day 6 to Day 8, followed by a decline and a period of essentially no age-related increase in mortality until approximately Day 30 followed by increasing, fluctuating mortality (Figure 3).
Figure 1.
Cohort survival (lx) of Caenorhabditis elegans (strains N2, clk-1, and daf-2) maintained as individuals on nematode growth medium and OP-50 at 20°C (n=1000, 800, and 800 for N2, clk-1, and daf-2, respectively) with survival and reproduction monitored daily (bootstrap 95% confidence intervals shown).
Table 1.
Demographic Parameter in a Large Cohort of Individually Maintained Caenorhabditis elegans (N2, clk-1, and daf-2)
| Parameter | N2 | clk-1 | daf-2 |
|---|---|---|---|
| Fitness* (95% CI)† | 3.85 (3.83, 3.87) | 2.74 (2.73, 2.76) | 3.78 (3.76, 3.80) |
| Net reproductive rate (R0) (95% CI)† | 285.6 (281.8, 289.5) | 160.8 (158.0, 163.6) | 233.5 (230.3, 237.0) |
| Life expectancy (e0) (95% CI)† | 14.33 (14.02, 14.62) | 18.25 (17.57, 18.93) | 30.26 (29.22, 31.33) |
| Generation time (d) | 3.85 (3.84, 3.87) | 4.42 (4.40, 4.44) | 3.73 (3.71, 3.75) |
| Prereproductive life span (d) | 3.01 ± 0.01‡ | 3.76 ± 0.02 | 3.01 ± 0.01 |
| Change relative to N2 | +24.9% | +0.0% | |
| Reproductive life span (d) | 6.04 ± 0.05 | 5.15 ± 0.07 | 6.43 ± 0.09 |
| Change relative to N2 | −14.7% | +6.5% | |
| Worms with interrupted reproductive period§ | 14% | 26% | 40% |
| Prereproductive and reproductive life span (d) | 9.05 ± 0.05 | 8.91 ± 0.07 | 9.44 ± 0.09 |
| Change relative to N2 | −1.5% | +4.3% | |
| Postreproductive life span (d) | 5.77 ± 0.16 | 9.83 ± 0.37 | 21.3 ± 0.53 |
| Change relative to N2 | +70.4% | +269% |
Notes: Fitness calculated as λ, the dominant eigenvalue of the population projection matrix A, determined from cohorts of 1000, 800, and 800 individual worms (N2, clk-1, and daf-2, respectively).
95% confidence intervals (CI) were calculated from 2000 bootstrap samples.
Days ± standard error.
Worms in which egg-laying was not continuous after initiation.
Figure 2.
Frequency of death (dx) for cohorts of Caenorhabditis elegans (strains N2, clk-1, and daf-2) individuals maintained on nematode growth medium and OP-50 at 20°C (n=1000, 800, and 800 for N2, clk-1, and daf-2, respectively) with survival and reproduction monitored daily (bootstrap 95% confidence intervals shown).
Figure 3.
Force of mortality (µ x) for cohorts of Caenorhabditis elegans (strains N2, clk-1, and daf-2) individuals maintained on nematode growth medium and OP-50 at 20°C (n = 1000, 800, and 800 for N2, clk-1, and daf-2, respectively) with survival and reproduction monitored daily. The smoothed mortality rate curves were obtained using a locally weighted regression (LOESS) procedure.
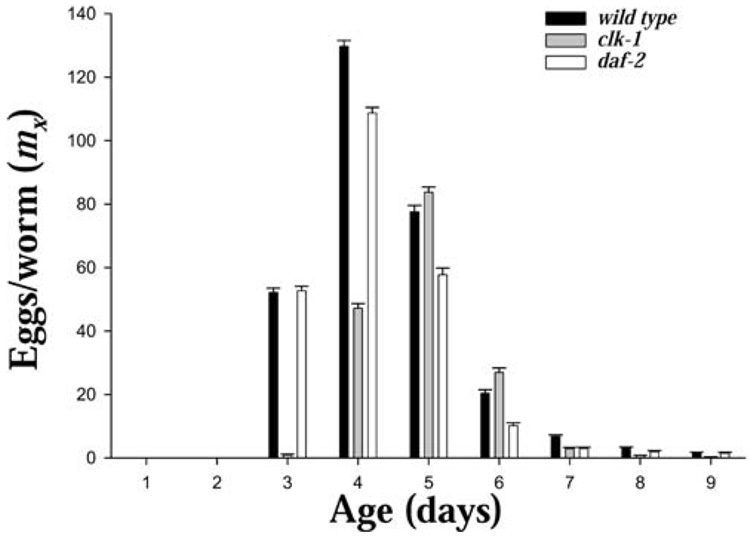
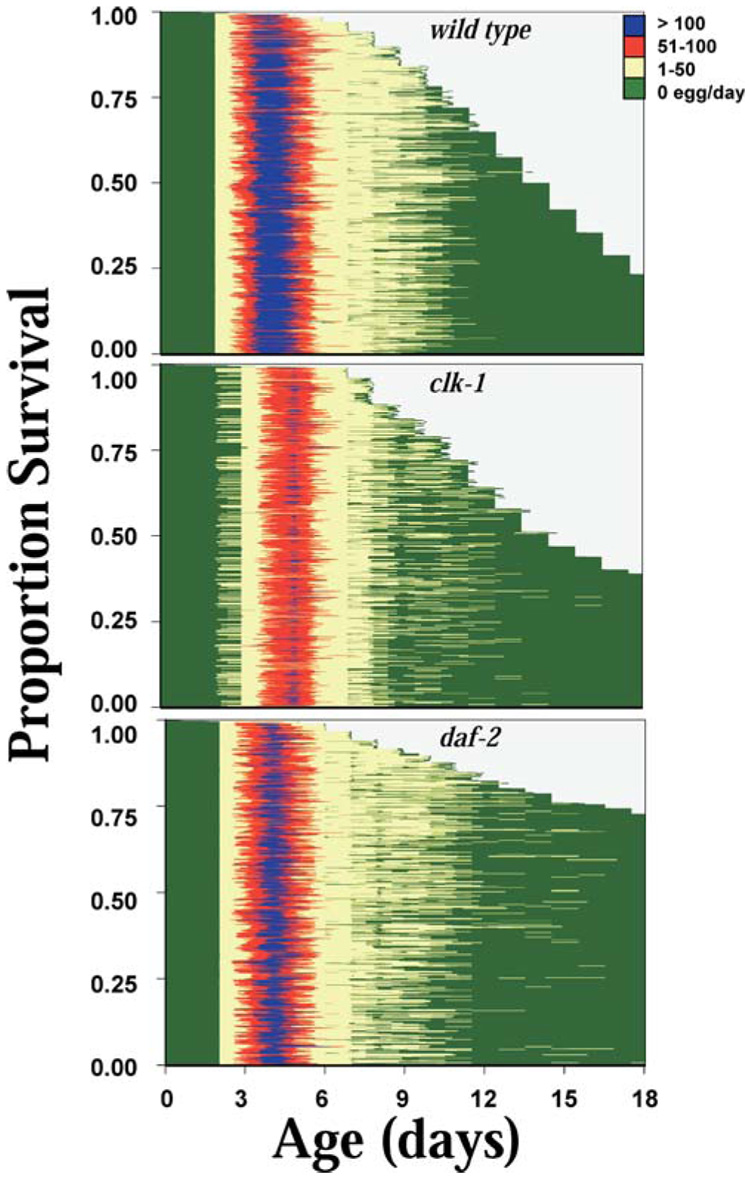
The period of most intense reproduction was between Days 3 and 6 in N2 and daf-2 and Days 4 and 6 for clk-1, with the reproductive period essentially ended by about Day 9 for all three strains (Figure 4 and Figure 5, and Table 1). About 10% of daf-2 worms had died by this time, compared to about 16% for the N2 and clk-1 (Table 2). Mortality was relatively low during the prereproductive period, with only 4.0%, 3.8%, and 6.4% of N2, clk-1, and daf-2 individuals, respectively, dying prior to reproduction.
Figure 4.
Age-specific reproduction (mx) from cohorts of Caenorhabditis elegans (strains N2, clk-1, and daf-2) maintained as individuals on nematode growth medium and OP-50 at 20°C (n = 1000, 800, and 800 for N2, clk-1, and daf-2, respectively) with survival and reproduction monitored daily (bootstrap 95% confidence intervals shown).
Figure 5.
Event history diagrams showing daily survival versus age for Caenorhabditis elegans cohorts, with individual reproduction at each age indicated by color. Individuals of C. elegans (strains N2, clk-1, and daf-2) were maintained separately on nematode growth medium and OP-50 at 20°C (n = 1000, 800, and 800 for N2, clk-1, and daf-2, respectively) with survival and reproduction monitored daily.
Table 2.
Demographic Parameters for Cohorts of Individual Caenorhabditis elegans (N2, clk-1, and daf-2) Over Three Successive Age Intervals
| Age Interval (d) |
|||||||||
|---|---|---|---|---|---|---|---|---|---|
| 0–9 |
10–18 |
18–ω* |
|||||||
| Demographic Trait | N2 | clk-1 | daf-2 | N2 | clk-1 | daf-2 | N2 | clk-1 | daf-2 |
| % Worms dying in interval | 15.8 | 16.0 | 9.75 | 60.6 | 45.0 | 17.5 | 23.6 | 39.0 | 72.8 |
| Average daily mortality | 0.026 | 0.025 | 0.014 | 0.148 | 0.083 | 0.023 | 0.365 | 0.159 | 0.143 |
| Life expectancy at end of interval† | 6.68 | 11.3 | 23.8 | 3.32 | 11.2 | 19.6 | 2.25 | 8.04 | 13.9 |
| No. of eggs per hermaphrodite | 292.6 | 167.4 | 237.3 | 0.59 | 0.54 | 1.37 | 0 | 0 | 0 |
Notes: The mean prereproductive and reproductive life span is approximately 9 days for all three genotypes (n = 1000, 800, and 800 for N2, clk-1, and daf-2, respectively). Day 18 is the last day for egg production among 2600 worms in three strains.
Day ω is the day the last surviving worm died within each strain.
Life expectancy e9, e18, e27.
Differences in survival after most reproduction was completed (i.e., after age 9) accounted for the differences in total life span among strains (Table 1). The expectation of life at Day 9 for N2, clk-1, and daf-2 worms was 6.7, 11.3, and 23.8 days, respectively. Between Days 10 and 18, both longevity mutants exhibited reduced average daily mortality (0.08 for clk-1 and 0.02 for daf-2; 0.15 for N2). By Day 18, when the last daf-2 worm had finished reproduction, about 76% of N2 worms had died, compared to 61% for clk-1, and about 27% for daf-2 (Table 2). Life expectancy on Day 18 was 3.3, 11.2, and 19.6 days for N2, clk-1, and daf-2, respectively. The remaining life expectancy on Day 33, when the last N2 worm died, was 5.6 days for clk-1 and 10.4 days for daf-2.
Reproduction
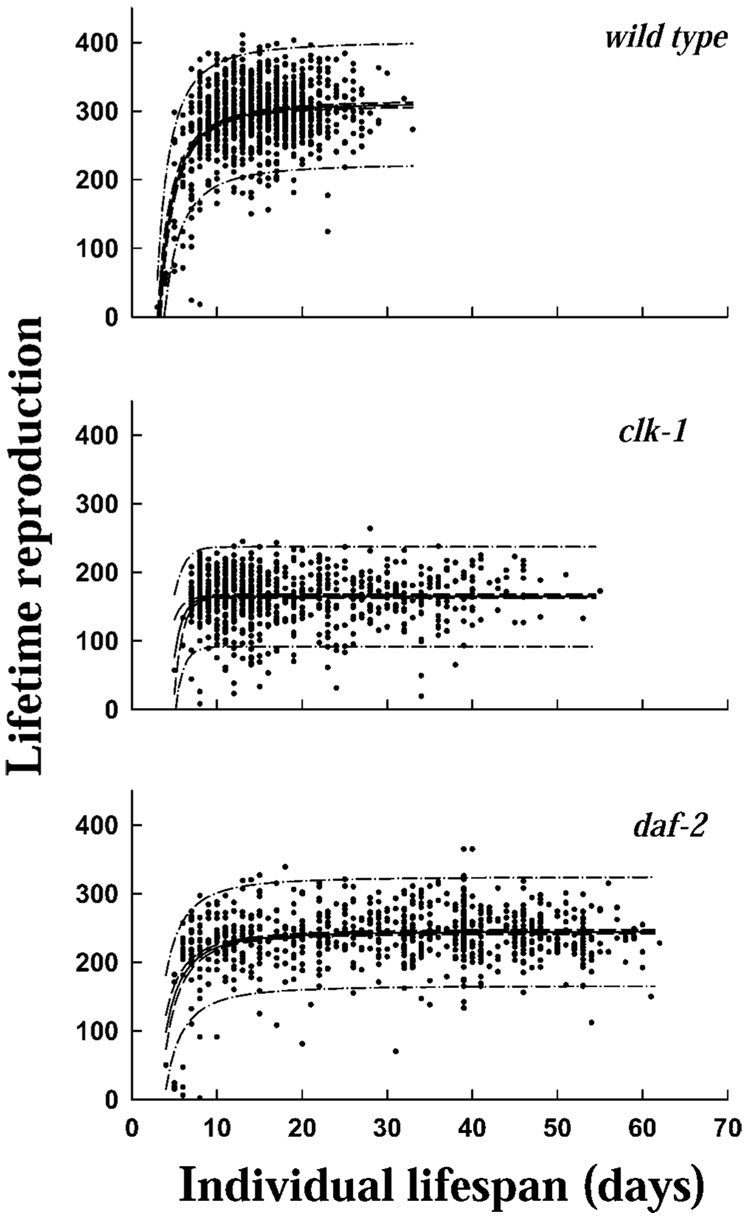
Individual life span and lifetime reproduction were not correlated (Table 3 and Figure 6), and lifetime egg production (mean ± standard error) was 293 ± 1.6 for N2, 168 ± 1.3 for clk-1, and 239 ± 1.7 for daf-2. In all the strains, fertility (mx) was concentrated in a limited reproductive window between Days 3 and 7 (Table 1, Figure 4 and Figure 5). Reproduction was initiated by Day 3 in N2 and daf-2, but was delayed until Day 4 in most clk-1 individuals (Table 1, Figure 4 and Figure 5).
Table 3.
Mean and Coefficient of Variation (CV) for Life History Components of Long-Lived and Wild-Type Caenorhabditis elegans
| Strains |
||||||
|---|---|---|---|---|---|---|
| Wild Type |
clk-1 |
daf-2 |
||||
| Life History Components | Mean | CV | Mean | CV | Mean | CV |
| Life span (d) | 14.8 | 34.5 | 18.7 | 55.1 | 30.7 | 48.9 |
| First day of reproduction | 3.01 | 5.55 | 3.76 | 13.4 | 3.01 | 6.53 |
| Last day of reproduction | 9.05 | 17.7 | 8.91 | 21.2 | 9.44 | 25.6 |
| No. of days in reproductive period | 6.04 | 26.7 | 5.15 | 36.4 | 6.43 | 37.6 |
| Total egg production | 293 | 17.6 | 168 | 22.8 | 239 | 18.3 |
Figure 6.
Individual life span (in days) versus lifetime total reproduction for Caenorhabditis elegans (strains N2, clk-1, and daf-2) individuals maintained separately on nematode growth medium and OP-50 at 20°C (n=1000, 800, and 800 for N2, clk-1, and daf-2, respectively) and survival and reproduction monitored daily. Curves depicted include fit, 95% confidence intervals, and 95% prediction intervals (N2: y=312 − 3201/x2, Fit Standard Error=45.4; clk-1: y=164 − 13045e−x, Fit Standard Error = 37.1; daf-2: y = 245 − 2346/x2, Fit Standard Error = 40.4).
The pattern of reproduction among individuals is shown in the event history graph (Figure 5). The peak of daily egg production occurred at Day 4 in both N2 and daf-2, but was delayed to Day 5 in clk-1 (Figure 4 and Figure 5). Egg-laying continued at a greatly reduced rate after Day 7, and had ceased completely by Day 14 in N2, Day 16 in clk-1, and Day 18 in daf-2. After egg-laying started, it usually continued without stopping, but interruptions in reproduction were observed in 14%, 26%, and 40% of N2, clk-1, and daf-2 worms, respectively (Table 1 and Figure 5). No individual worms were observed to produce progeny at times later than the average total life span of their strain.
In N2 and clk-1 worms that lived longer than 18 days, there was no relationship between remaining lifetime and total reproduction. However, in daf-2 nematodes that lived longer than 18 days, there was a negative relationship between remaining lifetime and egg production during Days 10–18, although only about 0.5% of the reproduction occurred during this time interval.
Fitness
Fitness was highest for N2 (λ = 3.85), and lower for clk-1 (λ = 2.74) and daf-2 (λ - 3.78). Net reproductive rates (R0) were 286, 161, and 233 for N2, clk-1, and daf-2, respectively.
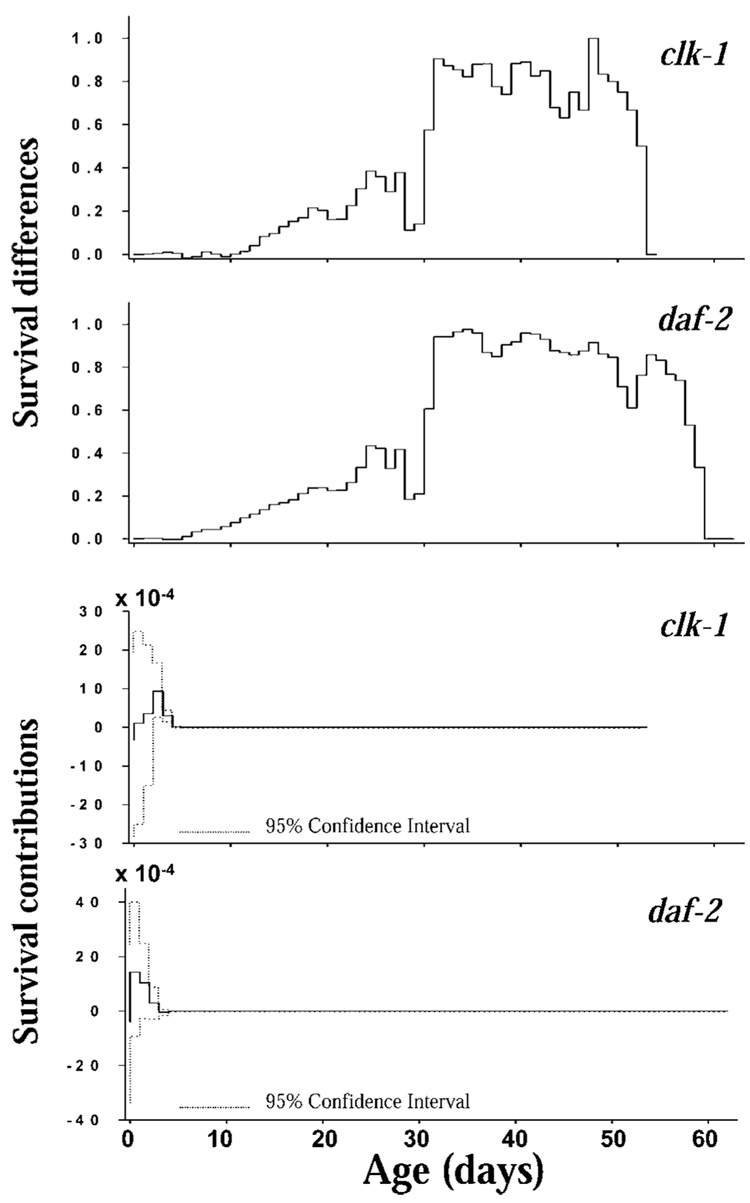
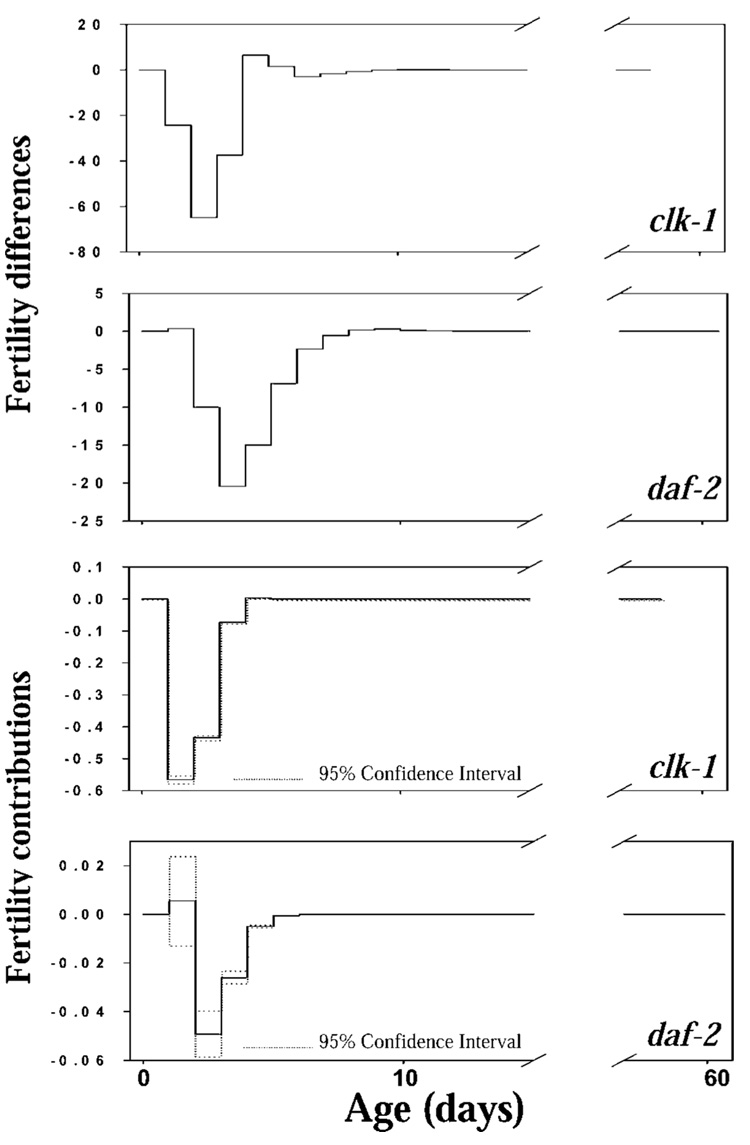
LTRE analysis decomposed the fitness differential between the mutant strains and N2 into contributions from differences in age-specific survival probability and fertility (Figure 7 and Figure 8). There were large differences in survival after age 5 (and especially after age 30) between clk-1, daf-2, and N2, but these survival differences contributed nothing to the fitness differential (Figure 7). There are small positive contributions from very small survival differences in the first 8 days of life, but the confidence intervals on these contributions overlap zero, so the contribution of survival differences to the fitness differential is essentially zero. Fertility differences between the mutants and N2, which were limited to the first 10 days of life, made large contributions to the fitness differentials between the strains (Figure 8).
Figure 7.
Life table response experiment analysis of the survival differences and survival contributions to fitness in clk-1 and daf-2 relative to N2 (bootstrap 95% confidence intervals shown).
Figure 8.
Life table response experiment analysis of the fertility differences and fertility contributions to fitness in clk-1 and daf-2 relative to N2 (bootstrap 95% confidence intervals shown).
Summing the contributions over age gives the overall contributions of survival and fertility to the fitness differential. Comparing clk-1 and N2, the contributions are 1.37 × 10⁻³ for survival and −1.07 for fertility. Comparing daf-2 and N2, the contributions are 2.34 × 10⁻³ for survival and −7.53 × 10⁻² for fertility. Thus the contributions of fertility differences to fitness costs were between one and 2 orders of magnitude larger than were the contributions of survival differences.
DISCUSSION
The longevity mutants clk-1 and daf-2 reduce age-specific mortality and increase postreproductive survival, relative to wild type (N2) C. elegans. These mutations, although exerting a positive effect in later life, carry costs due to effects on other demographic parameters, and hence reduce fitness. These costs may be considered to act as tradeoffs influencing the evolution of life histories; they put the antagonism into the antagonistic pleiotropy theory of senescence. The small increases in early reproduction in the wild type more than make up for its reduced late survival relative to these two mutants.
Our analysis of fitness using an assessment of λ is new. The only reported estimates of population growth rate for C. elegans that we are aware of were obtained by measurement of food consumption (13) or from the slope of a linear regression of the log of population size versus time (44), not by demographic calculation. An estimate obtained through regression does not provide insight on how fitness is related to specific differences in survival and fertility. The same general limitation applies to the estimates of relative (not absolute) fitness of C. elegans strains reported by Walker and colleagues (16) and Jenkins and colleagues (14) that were obtained by following changes in the relative abundance of populations over time. In addition, those estimates appear to have been obtained in a serial transfer environment that could be expected to fundamentally alter the selection regime on longevity mutants. Although such studies provide insights, they are not a substitute for demographic analysis as a method for understanding the survival and fertility components of fitness.
The antagonistic pleiotropy theory of aging suggests that senescence results from genes with positive effects on fitness early in life but negative effects later in life (22,29). Relatively few genes have been demonstrated to have beneficial effects early in life and detrimental effects later in life (45), but the nematode life-span extension mutants age-1 and daf-2 have influences on life span and estimated fitness consistent with antagonistic pleiotropy (14,16).
These longevity mutants change the slope of postreproductive age-specific mortality rates. The leveling of mortality after reproduction that was observed in clk-1 and daf-2 did not occur as clearly in N2. All three strains exhibited mortality trajectories that differed slightly from the two-stage Gompertz patterns reported by Johnson and colleagues (9), but generally agree with those patterns in having an initial exponential mortality increase followed by a lower rate of increase. It is intriguing to consider C. elegans behaviors governed through group interactions (e.g., pheromone influence on dauer formation) relative to the role of postreproductive survival in contributing to the evolution of senescence, given that in social species intergenerational transfers may shape senescence (46).
In our experiments, the clk-1 and daf-2 mutants extend average life span relative to the wild type by 27% and 111%, respectively. However, they reduced reproduction in early life, leading to significant fitness costs. The magnitude of these costs can be appreciated by noting that the fitness differentials are sufficient to produce a decline in the frequency, relative to the wild type, of clk-1 of 29% per day and of daf-2 of 1.8% per day.
The fitness costs are due to negative effects of the mutations on reproduction in the first 6–7 days of life, as shown by the LTRE analysis. The dramatic improvements in late survival make no contribution to fitness. The positive contributions of increases in early survival are 2 orders of magnitude smaller than the negative contributions of fertility differences during this same period. This is a clear quantitative documentation of the age-specific demographic basis of antagonistic pleiotropic effects on survival and reproduction. Our results are consistent with the quite different study of Hodgkin and Barnes (13), who compared food consumption rates of populations of several strains differing in sperm production, and thus in reproductive rate. They emphasized the importance of changes in the age at first reproduction; our LTRE analysis quantifies this effect, especially for clk-1 (see Figure 8). Our results are also consistent with the determination that longevity genes influence relative fitness and survival under stressful environmental conditions or under competition with wild-type worms (14,16).
A key aspect of these effects we report is that, whereas life span is extended by clk-1 and daf-2, the duration of the reproductive window is not. The event history diagram (Figure 6) shows that the beginning and the end of this window are both tightly controlled in N2. In clk-1 the beginning is delayed by 1 day, but the end is even more tightly controlled. In daf-2, both the beginning and end of the reproductive window are very similar to N2, and a linear relationship between life span and postreproductive life span arises from the relatively fixed reproductive schedule.
The developing reproductive system influences life span, and laser ablation of germ line precursor cells, eliminating reproduction, may extend the life span of C. elegans (6). Interestingly, both the clk-1 and daf-2 mutations dramatically increase the frequency of breaks in individual reproduction. This phenomenon suggests an effect, unknown at this point, on the genetic regulation of reproduction. It is interesting that two different mutations both show this disruption. Because the mutants increased longevity by extending postreproductive survival, there was no direct relationship between lifetime reproductive output and life span. In general, the results appear to represent tradeoffs relative to extended life span—with reduction in total fertility in longevity mutants.
Any estimate of fitness is conditional on the environment in which it is carried out. Our measurements were carried out in controlled laboratory conditions with surplus food. Even under these unstressed conditions, the fitness costs of the longevity mutants were apparent. Stress, for example due to periodic starvation, can exacerbate these effects (14,16); large-cohort demographic data collected under such conditions would permit a detailed analysis of these effects.
The ecology of C. elegans is poorly known (47,48). Studies under conditions more ecologically realistic than standard laboratory conditions could provide insights into the selection pressures on life history traits in C. elegans. Van Voorhies and colleagues (18), for example, compared survivorship in soil and sand with that on agar for a wild-type strain (fer-1 wv01) and a daf-2 mutant, although reproduction and fitness were not assessed. Survivorship was drastically reduced in soil, more so for the daf-2 than for the wild type (18). This line of research merits elaboration through experiments that would include monitoring of the introduced bacterial food, given that food concentration can alter life span (49). We anticipate that our N2 1000-worm cohort data will serve as a reference data set for further exploration of C. elegans aging in the wild (50).
Our cohorts exhibited considerable interindividual variation in life span. Given the genetic homogeneity of the cohorts and the controlled culture environment, such variation may reflect the epigenetic stochastic elements described by Finch, Kirkwood, and colleagues (51,52), perhaps including senescent decline at the ultrastructural level and decreased gene regulation in the postreproductive period of life (53). Although discussions of longevity mutants often emphasize the unusually long-lived individuals, not all individuals experience long life. This variation in life span has ramifications relative to possible genetic therapies oriented toward life-span extension, that although life-span extension may be achieved through a given genetic pathway, the maximum possible increases in life span are only realized by a few individuals.
ACKNOWLEDGMENTS
This work was supported in part by grants from the Center for the Demography and Economics of Aging at the University of California, Berkeley, National Institutes of Health (NIH) Grant P01-AG022500-01, and National Science Foundation grants DEB-0235692 and DEB-0343820.
Strains used in this work were provided by the Caenorhabditis Genetics Center, which is funded by the NIH National Center for Research Resources.
We thank Ed Lewis and two anonymous reviewers for helpful comments on the manuscript, William Moore for discussion and assistance in the laboratory, and K. Kaplan, A. Foster, M. Olsen, D. Raju, R. Ramirez, J. Shinen, T. Wasilchen, and K. Sanchez for laboratory assistance.
REFERENCES
- 1.Kenyon C, Chang J, Gensch E, Rudner A, Tabtiang R. A C. elegans mutant that lives twice as long as wild type. Nature. 1993;366:461–464. doi: 10.1038/366461a0. [DOI] [PubMed] [Google Scholar]
- 2.Wang JL, Muller HG, Capra WB, Carey JR. Rates of mortality in populations of Caenorhabditis elegans. Science. 1994;266:827–828. doi: 10.1126/science.7973642. [DOI] [PubMed] [Google Scholar]
- 3.Gems D, Sutton AJ, Sundermeyer ML, et al. Two pleiotropic classes of daf-2 mutation affect larval arrest, adult behavior, reproduction and longevity in Caenorhabditis elegans. Genetics. 1998;150:129–155. doi: 10.1093/genetics/150.1.129. [DOI] [PMC free article] [PubMed] [Google Scholar]
- 4.Apfeld J, Kenyon C. Regulation of lifespan by sensory perception in Caenorhabditis elegans. Nature. 1999;402:804–809. doi: 10.1038/45544. [DOI] [PubMed] [Google Scholar]
- 5.Felkai S, Ewbank JJ, Lemieux J, Labbe JC, Brown GG, Hekimi S. CLK-1 controls respiration, behavior and aging in the nematode Caenorhabditis elegans. EMBO J. 1999;18:1783–1792. doi: 10.1093/emboj/18.7.1783. [DOI] [PMC free article] [PubMed] [Google Scholar]
- 6.Hsin H, Kenyon C. Signals from the reproductive system regulate the lifespan of C. elegans. Nature. 1999;399:362–366. doi: 10.1038/20694. [DOI] [PubMed] [Google Scholar]
- 7.Vanfleteren JR, Braeckman BP. Mechanisms of life span determination in Caenorhabditis elegans. Neurobiol Aging. 1999;20:487–501. doi: 10.1016/s0197-4580(99)00087-1. [DOI] [PubMed] [Google Scholar]
- 8.Chen J, Carey JR, Ferris H. Comparative demography of isogenic populations of Caenorhabditis elegans. Exp Gerontol. 2001;36:431–440. doi: 10.1016/s0531-5565(00)00225-4. [DOI] [PubMed] [Google Scholar]
- 9.Johnson TE, Wu D, Tedesco P, Dames S, Vaupel JW. Age-specific demographic profiles of longevity mutants in Caenorhabditis elegans show segmental effects. J Gerontol Biol Sci. 2001;56A:B331–B339. doi: 10.1093/gerona/56.8.b331. [DOI] [PubMed] [Google Scholar]
- 10.Kenyon C. The plasticity of aging: insights from long-lived mutants. Cell. 2005;120:449–460. doi: 10.1016/j.cell.2005.02.002. [DOI] [PubMed] [Google Scholar]
- 11.Boehm M, Slack F. A developmental timing microRNA and its target regulate life span in C. elegans. Science. 2005 310;:1954–1957. doi: 10.1126/science.1115596. [DOI] [PubMed] [Google Scholar]
- 12.Hamilton B, Dong Y, Shindo M, Liu W, Odell I, Ruvkun G. A systematic RNAi screen for longevity genes in C. elegans. Genes Dev. 2005;19:1544–1555. doi: 10.1101/gad.1308205. [DOI] [PMC free article] [PubMed] [Google Scholar]
- 13.Hodgkin J, Barnes TM. More is not better: brood size and population growth in a self-fertilizing nematode. Proc R Soc Lond Ser B. 1991;246:19–24. doi: 10.1098/rspb.1991.0119. [DOI] [PubMed] [Google Scholar]
- 14.Jenkins NL, McColl G, Lithgow GJ. Fitness cost of extended lifespan in Caenorhabditis elegans. Proc R Soc Lond Ser B. 2004;271:2523–2526. doi: 10.1098/rspb.2004.2897. [DOI] [PMC free article] [PubMed] [Google Scholar]
- 15.Johnson TE, Hutchinson EW. Absence of strong heterosis for life span and other life history traits in Caenorhabditis elegans. Genetics. 1993;134:465–474. doi: 10.1093/genetics/134.2.465. [DOI] [PMC free article] [PubMed] [Google Scholar]
- 16.Walker DW, McColl G, Jenkins NL, Harris J, Lithgow GJ. Evolution of lifespan in C. elegans. Nature. 2000;405:296–297. doi: 10.1038/35012693. [DOI] [PubMed] [Google Scholar]
- 17.Van Voorhies WA, Ward S. Genetic and environmental conditions that increase longevity in Caenorhabditis elegans decrease metabolic rate. Proc Natl Acad Sci U S A. 1999;96:11399–11403. doi: 10.1073/pnas.96.20.11399. [DOI] [PMC free article] [PubMed] [Google Scholar]
- 18.Van Voorhies WA, Fuchs J, Thomas S. The longevity of Caenorhabditis elegans in soil. Biol Lett. 2005;1:247–249. doi: 10.1098/rsbl.2004.0278. [DOI] [PMC free article] [PubMed] [Google Scholar]
- 19.Lakowski B, Hekimi S. Determination of life-span in Caenorhabditis elegans by four clock genes. Science. 1996;272:1010–1013. doi: 10.1126/science.272.5264.1010. [DOI] [PubMed] [Google Scholar]
- 20.Hekimi S, Burgess J, Bussière F, Meng Y, Bénard C. Genetics of lifespan in C. elegans: molecular diversity, physiological complexity, mechanistic simplicity. Trends Gen. 2001;17:712–718. doi: 10.1016/s0168-9525(01)02523-9. [DOI] [PubMed] [Google Scholar]
- 21.Kurz CL, Tan MW. Regulation of aging and innate immunity in C. elegans. Aging Cell. 2004;3:185–193. doi: 10.1111/j.1474-9728.2004.00108.x. [DOI] [PubMed] [Google Scholar]
- 22.Rose M. Evolutionary Biology of Aging. New York: Oxford University Press; 1991. [Google Scholar]
- 23.Charlesworth B. Evolution in Age-Structured Populations. Cambridge, U.K.: Cambridge University Press; 1994. [Google Scholar]
- 24.Carey JR. Insect biodemography. Ann Rev Entomol. 2001;46:79–110. doi: 10.1146/annurev.ento.46.1.79. [DOI] [PubMed] [Google Scholar]
- 25.Caswell H. Matrix Population Models: Construction, Analysis, and Interpretation. 2nd ed. Sunderland, MA: Sinauer Associates, Inc.; 2001. [Google Scholar]
- 26.Carey JR. Longevity: The biology and demography of life span. Princeton, NJ: Princeton University Press; 2003. [Google Scholar]
- 27.Medawar PB. The Uniqueness of the Individual. London: Methuen; 1957. [Google Scholar]
- 28.Hamilton WD. The moulding of senescence by natural selection. J Theor Biol. 1966;12:12–45. doi: 10.1016/0022-5193(66)90184-6. [DOI] [PubMed] [Google Scholar]
- 29.Williams GC. Pleiotropy, natural selection, and the evolution of senescence. Evolution. 1957;11:398–411. [Google Scholar]
- 30.Carey JR, Liedo P, Muller HG, Wang JL, Chiou JM. Relationship of age patterns of fecundity to mortality, longevity, and lifetime reproduction in a large cohort of Mediterranean fruit fly females. J Gerontol Biol Sci. 1998;53:B245–B251. doi: 10.1093/gerona/53a.4.b245. [DOI] [PubMed] [Google Scholar]
- 31.Curtsinger JW, Fukui HH, Townsend DR, Vaupel JW. Demography of genotypes: failure of the limited life-span paradigm in Drosophila melanogaster. Science. 1992;258:461–463. doi: 10.1126/science.1411541. [DOI] [PubMed] [Google Scholar]
- 32.Vaupel JW, Carey JR, Christensen K, et al. Biodemographic trajectories of longevity. Science. 1998;280:855–860. doi: 10.1126/science.280.5365.855. [DOI] [PubMed] [Google Scholar]
- 33.Brooks A, Lithgow GJ, Johnson TE. Mortality rates in a genetically heterogeneous population of Caenorhabditis elegans. Science. 1994;263:668–671. doi: 10.1126/science.8303273. [DOI] [PubMed] [Google Scholar]
- 34.Stiernagle T. Maintenance of C. elegans. In: Hope IA, editor. C. elegans: A Practical Approach. Oxford: Oxford University Press; 1999. pp. 51–67. [Google Scholar]
- 35.Brenner S. The genetics of Caenorhabditis elegans. Genetics. 1974;77(1):71–94. doi: 10.1093/genetics/77.1.71. [DOI] [PMC free article] [PubMed] [Google Scholar]
- 36.Chen J, Caswell-Chen EP. Facultative vivipary is a life-history trait in C. elegans. J Nematol. 2004;36:107–113. [PMC free article] [PubMed] [Google Scholar]
- 37.Chen J, Caswell-Chen EP. Why Caenorhabditis elegans adults sacrifice their bodies to progeny. Nematology. 2003;5:641–645. [Google Scholar]
- 38.Caswell H. Applications of Markov chains in demography. In: Langville AN, Stewart WJ, editors. MAM2006: Markov Anniversary Meeting. Raleigh, North Carolina: Boson Books; 2006. pp. 319–334. [Google Scholar]
- 39.Carey JR, Liedo P, Muller HG, Wang JL, Vaupel JW. A simple graphical technique for displaying individual fertility data and cohort survival: case study of 1000 Mediterranean Fruit Fly females. Func Ecol. 1998;12:259–363. [Google Scholar]
- 40.Metz JAJ, Nisbet RM, Geritz SAH. How should we define ‘fitness’ for general ecological scenarios? Trends Ecol Evol. 1992;7:198–202. doi: 10.1016/0169-5347(92)90073-K. [DOI] [PubMed] [Google Scholar]
- 41.Caswell H. The analysis of life table response experiments. I. Decomposition of effects on population growth rate. Ecol Model. 1989;46:221–237. [Google Scholar]
- 42.Efron B, Tibshirani RJ. An Introduction to the Bootstrap. New York: Chapman & Hall; 1993. [Google Scholar]
- 43.Manly BFJ. Randomization and Monte Carlo Methods in Biology. New York: Chapman & Hall; 1997. [Google Scholar]
- 44.Venette RC, Ferris H. Influence of bacterial type and density on population growth of bacterial-feeding nematodes. Soil Biol Biochem. 1998;30:949–960. [Google Scholar]
- 45.Ricklefs RE, Finch CE. Aging: A Natural History. New York: Scientific American Library; 1995. [Google Scholar]
- 46.Lee RD. Rethinking the evolutionary theory of aging: transfers, not births, shape senescence in social species. Proc Natl Acad Sci U S A. 2003;100:9637–9642. doi: 10.1073/pnas.1530303100. [DOI] [PMC free article] [PubMed] [Google Scholar]
- 47.Caswell-Chen EP, Chen J, Lewis EE, Douhan GW, Nadler SA, Carey JR. Revising the standard wisdom of C. elegans natural history: ecology of longevity. Sci Aging Knowl Environ. 2005;40:pe30. doi: 10.1126/sageke.2005.40.pe30. [DOI] [PMC free article] [PubMed] [Google Scholar]
- 48.Chen J, Lewis EE, Carey JR, Caswell H, Caswell-Chen EP. The ecology and biodemography of C. elegans. Exp Gerontol. 2006;41:1059–1065. doi: 10.1016/j.exger.2006.07.005. [DOI] [PMC free article] [PubMed] [Google Scholar]
- 49.Klass MR. Aging in the nematode Caenorhabditis elegans: major biological and environmental factors influencing life span. Mech Aging Dev. 1977;6:413–429. doi: 10.1016/0047-6374(77)90043-4. [DOI] [PubMed] [Google Scholar]
- 50.Müller HG, Wang JL, Carey JR, et al. Demographic window to aging in the wild: constructing life tables and estimating survival functions from marked individuals of unknown age. Aging Cell. 2004;3:125–131. doi: 10.1111/j.1474-9728.2004.00096.x. [DOI] [PMC free article] [PubMed] [Google Scholar]
- 51.Finch CE, Kirkwood TBL. Chance, Development, and Aging. New York: Oxford University Press; 2000. [Google Scholar]
- 52.Kirkwood TBL, Feder M, Finch CE, et al. What accounts for the wide variation in life span of genetically identical organisms reared in a constant environment? Mech Ageing Dev. 2005;126:439–443. doi: 10.1016/j.mad.2004.09.008. [DOI] [PubMed] [Google Scholar]
- 53.Herndon LA, Schmeissner PJ, Dudaronek JM, et al. Stochastic and genetic factors influence tissue-specific decline in ageing C. elegans. Nature. 2002;419:808–814. doi: 10.1038/nature01135. [DOI] [PubMed] [Google Scholar]


