Abstract
We have used Mössbauer and electron paramagnetic resonance (EPR) spectroscopy to study a heme-N-alkylated derivative of chloroperoxidase (CPO) prepared by mechanism-based inactivation with allylbenzene and hydrogen peroxide. The freshly prepared inactivated enzyme (“green CPO”) displayed a nearly pure low-spin ferric EPR signal with g = 1.94, 2.15, 2.31. The Mössbauer spectrum of the same species recorded at 4.2 K showed magnetic hyperfine splittings, which could be simulated in terms of a spin Hamiltonian with a complete set of hyperfine parameters in the slow spin fluctuation limit. The EPR spectrum of green CPO was simulated using a three-term crystal field model including g-strain. The best-fit parameters implied a very strong octahedral field in which the three 2T2 levels of the (3d)5 configuration in green CPO were lowest in energy, followed by a quartet. In native CPO, the 6A1 states follow the 2T2 ground state doublet. The alkene-mediated inactivation of CPO is spontaneously reversible. Warming of a sample of green CPO to 22°C for increasing times before freezing revealed slow conversion of the novel EPR species to two further spin S = ½ ferric species. One of these species displayed g = 1.82, 2.25, 2.60 indistinguishable from native CPO. By subtracting spectral components due to native and green CPO, a third species with g = 1.86, 2.24, 2.50 could be generated. The EPR spectrum of this “quasi-native CPO,” which appears at intermediate times during the reactivation, was simulated using best-fit parameters similar to those used for native CPO.
Keywords: N-alkylhemins, cytochrome P450, epoxidation, three-term model, electron paramagnetic resonance simulations
Chloroperoxidase (CPO) is an iron porphyrin (heme) peroxidase secreted by the fungus Caldariomyces fumago, together with an H2O2-generating system, for the synthesis of the chlorine-containing antibiotic caldariomycin. Originally discovered in the Hager laboratory on the basis of its chlorinating activity (1), CPO has been found to possess an extremely broad range of oxidative activities, making it probably the most versatile of the heme peroxidases. An incomplete list of reactions catalyzed by CPO includes classical heme peroxidase reactions [hydroperoxidase, halogenation, and catalase activities (2, 3)], oxidation of alcohols to aldehydes (4) and aldehydes to acids (5), hydroxylation (5, 6), epoxidation (7–9), sulfoxidation (10, 11), and oxo-transfer to arylamines (12–14). The majority of these catalytic activities, with the exception of the classical heme peroxidase reactions, are also characteristic of the cytochrome P450 class of monooxygenases (P450) (15), with which CPO shares common active site properties. The x-ray crystal structures of CPO (16) and P450cam (17) reveal that both enzymes contain a cysteine thiolate ligand to the active site heme. This proximal thiolate ligation in CPO is highly unusual for a heme peroxidase. All other structurally characterized heme peroxidases contain histidine as the proximal ligand (18), while the heme of catalase is ligated by a tyrosine (19, 20).
As a result of the possession of a common proximal ligand, CPO and P450 share a range of spectral properties both with each other and with synthetic iron(III) porphyrins (hemins) containing a thiolate ligand (21), including optical (22, 23), magnetic circular dichroism (24–26), electron paramagnetic resonance (EPR) (27–29), ENDOR (30), and Mössbauer (31, 32) properties. Interestingly, even though CPO and P450 possess a similar active-site structure and similar activities, the catalytic cycles of the two enzymes are different. In P450, an enzyme-bound oxidant is generated from dioxygen using reducing equivalents derived ultimately from NADH or NADPH (Scheme SI) (33).
Scheme I.
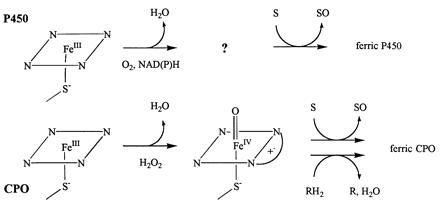
During the catalytic cycle, one oxygen of molecular oxygen is incorporated into the substrate by P450 (hence the term monooxygenase), while the other is reduced to water. In CPO, the native enzyme reacts with hydrogen peroxide (34) to generate an oxoiron(IV) porphyrin cation radical species known as compound I (35, 36). Compound I may then be reduced to the ferric enzyme by a hydrogen donor, accompanied by generation of water from the iron-bound oxygen, or may incorporate oxygen into a substrate, as occurs during epoxidation (37) and sulfoxidation (38). The nature of the two-electron oxidized enzyme intermediate in P450 is not known, although it may be similar to CPO compound I.
We have recently shown (8, 39) that CPO shares an additional
reactivity with microsomal P450 (40)—mechanism-based inactivation as a
side reaction during the epoxidation of terminal alkenes. The product
of alkene-mediated inactivation in both CPO and P450 is a “green
enzyme” species in which the active-site heme has been modified by
addition of the alkene skeleton plus a single oxygen. For P450, it has
been shown that the oxygen incorporated into the modified heme is
derived from molecular oxygen, probably via the oxygen-derived oxidized
form of P450. The result suggests that P450 inactivation results from
covalent addition of the alkene to the oxidized enzyme intermediate.
Unfortunately, a physical characterization of intact “green P450”
has not been possible to date, because of the difficulty of obtaining
the pure inactivated P450 in sufficient quantities. NMR studies of
demetallated porphyrins extracted from alkene-inactivated P450 have
shown them to be mono-N-(2-hydroxyalkyl)porphyrins
(Structure 1), suggesting that the modified heme may be a
mono-N-alkylhemin (41, 42).
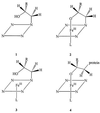
Optical studies of a modified porphyrin extracted from alkene-inactivated CPO also indicate a mono-N-alkylporphyrin (39). Structural studies of some model hemins which undergo a mechanism-based modification with alkenes also support this assignment (43), and suggest that the intact N-alkylhemin contains a five-membered chelate ring (Structure 2).
Surprisingly, alkene-inactivated green CPO [CPO species obtained via mechanism-based inactivation with hydrogen peroxide plus a terminal alkene (allylbenzene in this work)] converts on standing to an active enzyme species with spectral properties similar to native CPO (39). In parallel with this gain of activity, the prosthetic group modification is lost, and the heme reverts to heme b. Spontaneous dealkylation of model N-alkylhemins related to Structure 2 has been also reported (44–46), though no mechanism has been proposed. In each case, the reaction amounts to an N-dealkylation of the modified heme. Nucleophilic dealkylation of model N-alkylmetalloporphyrins has been studied in some detail by Lavallee and others (47–52) and may serve as a model for heme N-dealkylation in CPO. The mechanism of this reaction is under active investigation in the Hager laboratory.
In the current work, we have used EPR and Mössbauer spectroscopy to study the electronic properties of the heme iron in native CPO and in the CPO species generated by inactivation with the terminal alkene allylbenzene. In addition, we have employed EPR to follow the time course of CPO reactivation following allylbenzene-mediated inactivation.
MATERIALS AND METHODS
Enzyme Purification.
C. fumago (ATCC 16373) was grown in fructose-salts medium without added yeast extract [100 g/liter fructose (Sigma, 99%)/2 g/liter KH2PO4/2 g/liter NaNO3/1 g/liter MgSO4.7H2O] in aerated roller bottles. For preparation of enzyme for EPR samples, the growth medium contained 0.02 g/liter FeSO4. For preparation of enzyme for Mössbauer samples, iron was supplied to the growth medium as a partially dissolved suspension of 57Fe2O3 (>89 atom-%; Oak Ridge National Laboratory). Solid 57Fe2O3 (50 mg) was stirred for several days in a mixture of H3PO4 (85%; 5 ml) and HNO3 (98%, 2 ml). The magnetic stirrer bar was removed and 2.5 liters distilled water was added. Fructose (300 g) and MgSO4.7H2O (3 g) were added and dissolved by shaking. The solution was adjusted to pH 4.4 by addition of solid KOH, and the volume brought to 3 liters. The medium was sterilized by autoclaving and used for fungal culture.
C. fumago medium containing secreted CPO was harvested when the enzyme concentration reached 0.5 g/liter. CPO was isolated from the medium by precipitation with ethanol (50–75% cut) at −20°C. The enzyme used for EPR and Mössbauer studies had a purity number (Rz, A400/A280) greater than 1.2. CPO concentrations were determined using ɛ398 = 91,200 M−1·cm−1 in 20 mM K+ acetate, pH 5.2. Activity was determined using the monochlorodimedon chlorination assay (53).
Electron Paramagnetic Resonance and Mössbauer Spectra.
EPR spectra were recorded at 4 K on a Bruker ER200 X-band spectrometer equipped with an Oxford ESR 10 helium flow cryostat. Field values were calibrated using a Bruker ER 35M NMR Gaussmeter. Mössbauer spectra were recorded on frozen solutions using a constant acceleration spectrometer in the presence of a small (320 G) magnetic field parallel or perpendicular to the gamma beam. The temperature was controlled using a Janis Varitemp cryostat. Isomer shifts are quoted relative to Fe metal at 300 K.
Native Enzyme Samples.
For EPR studies of native CPO, an aliquot of concentrated enzyme stock (2.0 mM, 0.4 ml) in 20 mM K+ acetate (pH 5.2) was frozen into a quartz tube in liquid N2. For Mössbauer studies, an aliquot of 57Fe-labeled native CPO (2.99 mM, 0.7 ml) in 20 mM K+ acetate (pH 5.2) was frozen into a plastic cell in liquid N2. The Mössbauer sample contained 120 μg 57Fe. After Mössbauer studies of the native enzyme were complete, the 57Fe-labeled native CPO was thawed and used to prepare allylbenzene-inactivated (green) CPO. Freeze-thawing of CPO at millimolar concentrations does not appear to have adverse effects on the enzyme activity.
Allylbenzene-Inactivated Enzyme Samples.
For the preparation of EPR samples of green CPO, allylbenzene (Aldrich 30 mg, 250 μmol) was added to 20 mM K+ acetate, pH 5.2 (10 ml), at 4°C and stirred vigorously to form an emulsion. CPO (42 mg, 1 μmol) was added and H2O2 addition (10 μl/min, 2 M) was commenced via a syringe pump. Addition of H2O2 (500 μmol) over 25 min resulted in complete loss of CPO chlorinating activity, accompanied by a change in the enzyme color from red-brown to bright green. CPO was held at 4°C during the inactivation and subsequent work-up (1–2 h), to slow the spontaneous enzyme reactivation. Studies of the reactivation of green CPO at 4°C indicated that the reaction is very slow at this temperature (t½ ≈ 120 h). The reaction mixture was passed over a 0.45 μm syringe filter and concentrated to 0.5 ml over a Centriprep-30 concentrator (Amicon). The concentrated enzyme sample (2.2 mM) was frozen into a quartz EPR tube in liquid N2. Concentrations of alkene-inactivated CPO were estimated using ɛ419 = 75,000 M−1·cm−1 in 20 mM K+ acetate (pH 5.2).
The Mössbauer sample of green CPO was prepared similarly, except that 57Fe-labeled native CPO, which had been analyzed previously by Mössbauer, was used as the starting material. The concentrated sample (2.80 mM, 0.7 ml) was frozen into a plastic cell in liquid N2. After the completion of Mössbauer studies of green CPO, the sample was thawed and allowed to reactivate for 96 h at 4°C in the sample cup to generate a mixed sample containing green, quasi-native, and native CPO. The sample was then refrozen in liquid N2 for further analysis. The time period used approximates to one reactivation half-life for green CPO at 4°C and is equivalent to a 10-h time point for reactivation at 22°C.
Reactivation of Alkene-Inactivated CPO.
The EPR time course of spontaneous reactivation in allylbenzene-inactivated CPO was followed on a single sample which was warmed to 22°C in a quartz tube for defined time intervals, then refrozen in liquid N2 for analysis. Measurements were made initially at 10- to 30-min intervals, then at increasing intervals up to a total reactivation time of 355 h. An alternate procedure for observing CPO reactivation employed separate aliquots of CPO withdrawn from a concentrated stock at different times during reactivation at 25°C, then frozen for EPR analysis. Samples prepared using the latter procedure showed larger sample-to-sample variations in the EPR signal intensity; however, the reactivation profile was similar once the effects of temperature on the reaction rate are taken into account.
Generation of Component EPR Spectra.
To obtain the spectra of individual EPR species present during the reactivation of allylbenzene-inactivated CPO, a digital subtraction procedure was used, as follows. (i) Two separate EPR spectra of green CPO recorded at 0 h reactivation time (defined as the time of initial freezing) were summed to improve the signal-to-noise ratio. This spectrum defined “green CPO” for the EPR simulations and served as a basis spectrum for digital subtractions. (ii) EPR spectra recorded at 3, 6, 12, 18, 36, and 63 h during reactivation were summed to improve the signal-to-noise ratio. The EPR spectrum of green CPO defined in i was subtracted from this composite EPR spectrum, using a suitable scaling factor, to yield the mixed EPR spectrum of the remaining two low-spin species. (iii) The EPR of reactivating CPO recorded at 195 h was subtracted from the mixed spectrum defined in ii to obtain the EPR of the minor component present at 3–63 h. This spectrum defined quasi-native CPO for the EPR simulations. (iv) The EPR spectrum of quasi-native CPO obtained in iii was back-subtracted from the EPR spectrum recorded at 195 h. The resulting spectrum defined “native CPO” for the EPR simulations.
Spectral Simulations.
The hyperfine interactions observed in the low temperature Mössbauer spectra were analyzed in terms of the spin S = ½ Hamiltonian:
 |
 |
1 |
where S⃗ and I⃗ are the electron and nuclear spin operators, B⃗ is the magnetic field, μB is the electronic Bohr magneton, Vij represents the negative of the electric field gradient, g̃ is the g-tensor known from EPR studies, and à is the magnetic hyperfine tensor, which was taken to have the same principal axes as g̃. The last term in Eq. 1 represents the electric quadrupole interaction, with principal axes, x̄, ȳ, and z̄, which may be rotated relative to those of g̃ and à by Euler angles α, β, and γ (54). The asymmetry parameter η is given by:
 |
2 |
and ranges between 0 and 1 in a “proper” principal axis frame defined by |Vz̄z̄| > |Vȳȳ| > |Vx̄x̄|. The quadrupole splitting ΔEQ observed in the absence of magnetic interactions is
 |
3 |
The Mössbauer spectra were fitted by an iteration program based on an earlier simulation routine (55). The Griffith model for a single hole in the (t2g)5 manifold, as extended by Lang (56) has been used in the interpretation of the spin Hamiltonian parameters.
The EPR simulations, on the other hand, were based on a more sophisticated three-term crystal field model, which allows admixture of sextet, quartet, and doublet states in a crystal field having an octahedral component 10Dq, second rank and fourth rank axial components V2and V4, and a rhombic component R (57, 58). The electron-electron interactions of the (3d)5 configuration are given in terms of the Racah parameters B = 1015 cm−1 and C = 4800 cm−1, while the spin-orbit coupling has its free ion value, ζ = 430 cm−1. To fit the EPR lineshape, the model assumes an isotropic Gaussian linewidth H0, and allows for inhomogeneity of the heme environment (g-strain) by assigning Gaussian distributions of width σQ, σV, and σR to 10Dq, V2, and R, respectively. Elsewhere in the literature, the terms μ and Δ are used for the axial and rhombic crystal field splittings, respectively (59). The EPR simulation procedure is described in more detail in Results and Discussion.
RESULTS AND DISCUSSION
When CPO is treated with hydrogen peroxide in the presence of allylbenzene, the red-brown native CPO (Fig. 1 Left) is observed to convert to a green enzyme species (Fig. 1 Center). We have previously shown that the green CPO obtained in this reaction is completely inactive, having neither chlorinating nor epoxidizing activity (39). However, on standing, the enzymatic activity is spontaneously regained with a half-life of 6 h at 25°C, and eventually reaches a level greater than 80% of that of native CPO. During the same period, the color of the novel species is replaced by that of native CPO (Fig. 1 Right). The color changes observed are suggestive of chemical changes in the prosthetic heme of CPO, and mass spectrometric studies confirm this, showing that the heme of green CPO has been modified by the addition of the alkene plus a single oxygen. In the reactivated enzyme, this modification has again been lost, and only native heme b is present. CPO can be passed through several cycles of inactivation and reactivation of this kind, suggesting that no permanent modification is retained in the active site on reactivation.
Figure 1.
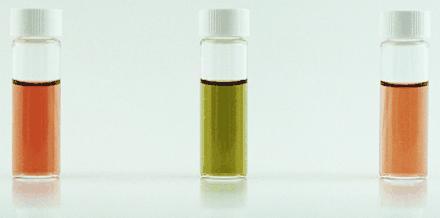
Visual changes in CPO on inactivation with allylbenzene. Native untreated CPO (Left), allylbenzene-inactivated CPO immediately following preparation (Center), and allylbenzene-inactivated CPO after standing for 65 h at 25°C (Right).
In the present work, we have followed the process of green CPO reactivation using EPR spectroscopy. Fig. 2 shows the EPR of green CPO frozen immediately after inactivation with allylbenzene (top trace), then at incrementally longer times up to 195 h during reactivation at 22°C (lower traces). Freshly prepared green CPO is seen to have a novel, rather pure low-spin signal with g-tensor 1.94, 2.15, 2.31. The spread in g-values is considerably smaller than that of native CPO (g = 1.82, 2.25, 2.60, this work; g = 1.84, 2.26, 2.61, ref. 30, indicating a smaller contribution of orbital angular momentum to the spin-only value of g0 = 2 in green CPO than in native CPO. EPR spectra similar to that of green CPO have been reported for substrate-free P450 (g = 1.91, 2.26, 2.45) (60) as well as for complexes of CPO and P450 with exogenous thiolate ligands (29). A similar g-tensor (g = 1.94, 2.14, 2.38) has also been reported for the pyridine complex of a model N-alkylhemin related to Structure 2 (43).
Figure 2.
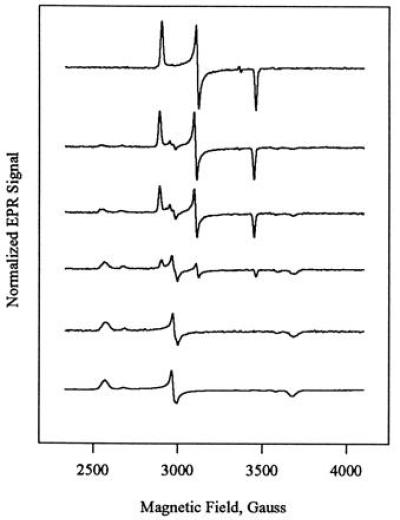
Selected EPR spectra of allylbenzene-inactivated CPO during spontaneous reactivation at 22°C. Spectra were recorded on a single sample at (from top) 0, 6, 12, 36, 106, and 195 h cumulative reactivation times, where 0 h is the time of initial freezing after work-up at 4°C. EPR spectra have been adjusted to a constant integrated area. Experimental conditions: T = 4 K, microwave power 20 nW, 100 kHz modulation of 10 G amplitude, frequency 9.443 GHz, sweep rate 4 G/s. At intermediate times during the reactivation, three S = ½ ferric species can be observed.
In spectra recorded at longer times after inactivation, the EPR signal of green CPO decreases in intensity and another low-spin signal appears with g = 1.82, 2.25, 2.60 (Fig. 2). This signal is indistinguishable from that of untreated native CPO recorded by us. The appearance of the g = 1.82, 2.25, 2.60 species parallels the increase in activity in green CPO, suggesting that this is the major, or sole, species responsible for enzyme activity. In the remaining discussion, we therefore refer to the species with this g-tensor as “native CPO.” We refer to CPO which has not been exposed to allylbenzene as “untreated native CPO.”
At intermediate times during green CPO reactivation, a third low-spin species with g = 1.86, 2.24, 2.50 is also observed in small amounts (Fig. 2). The EPR signal of this species is similar to that of native CPO, and we have thus designated this species “quasi-native CPO.” The EPR signal of quasi-native CPO increases in parallel with that of native CPO during the early period of reactivation (<18 h) but decreases very slowly thereafter. This behavior is similar to the kinetic behavior which would be expected of an intermediate in the conversion of green CPO to native CPO. However, the profile of appearance of quasi-native CPO indicates that it cannot be an obligate intermediate in reactivation, as the intensity of its EPR signal is never higher than that of native CPO. It is possible that quasi-native CPO represents an intermediate in a second pathway leading either from green to native CPO, or from green CPO to another final product. A possible heme structure for this species is discussed below.
In addition to the low-spin signals seen in Fig. 2, the EPR samples also contained a minority high-spin fraction (not shown). In native CPO, the high-spin ferric component was minimal and homogeneous, while in freshly inactivated green CPO, two different high-spin components were observed. During the course of green CPO reactivation, the high-spin fraction increased and became more inhomogeneous. In addition to g-values near 8 from S = 5/2 heme iron with rhombic zero-field splitting, g-values were also observed close to 6, corresponding to heme with an axial zero-field splitting. The latter presumably arises from denatured CPO present in the frozen sample and may represent free hemin. Although CPO is unusually thermostable for a protein not obtained from a thermophilic organism, the long time period (>200 h at 22°C) required for complete restoration of enzyme activity means that some thermal denaturation is inevitable at later time points. Between 195 and 355 h at 22°C, we observed significant evidence of denaturation in the enzyme sample. The 355-h time point was therefore excluded from the EPR analysis, and the reactivation was halted at this point.
To obtain EPR spectra of the individual low-spin components present during green CPO reactivation, we applied a digital subtraction procedure to the mixed EPR spectra obtained at different time points. Fig. 3 shows (from the top) the component spectra of green, quasi-native, and native CPO generated from the data in Fig. 2 by the subtraction procedure described in Materials and Methods. For comparison, the EPR spectra of freshly prepared green CPO (Fig. 3 Top) and untreated native CPO (Fig. 3 Bottom) are shown on an expanded scale in Fig. 4. The solid lines superimposed on the data in Figs. 3 and 4 are spectral simulations that are discussed below.
Figure 3.
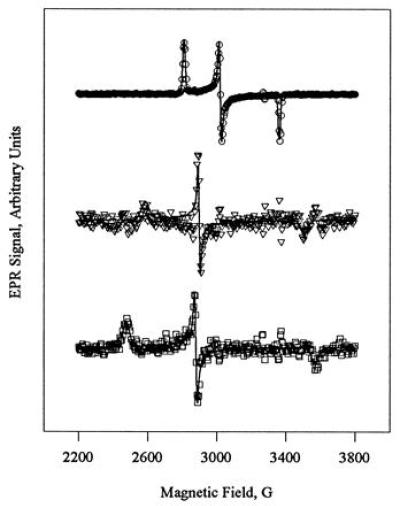
Simulated EPR spectra (solid lines) of green (Top), quasi-native (Middle), and native (Bottom) ferric CPO, overlaid on the individual component spectra (symbols). The EPR spectra for quasi-native and native CPO were constructed by the digital subtraction of spectra recorded at different times during reactivation of green CPO (Fig. 2). The simulations are based on the parameters in Table 1.
Figure 4.
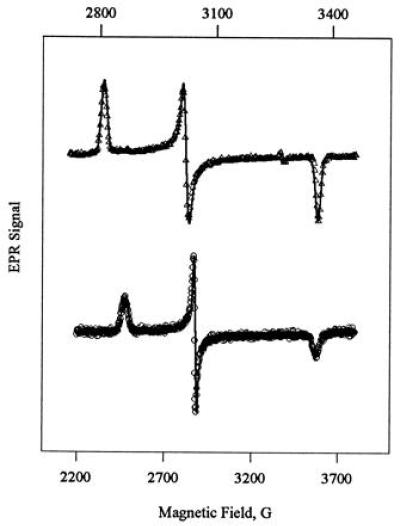
Simulated EPR spectra (solid lines) of green (Upper) and native (Lower) ferric CPO, overlaid on the measured EPR spectra of freshly prepared green CPO and untreated ferric CPO (symbols). The spectrum of green CPO is shown on an expanded scale (top axis) to illustrate the quality of the fit. Experimental conditions are as given for Fig. 2.
To obtain a more detailed understanding of the electronic structure of the heme iron in the three low-spin species (green, quasi-native, and native CPO) present during reactivation of green CPO, we have carried out simulations of the EPR spectra. The simulations employ a three-term crystal field model after Ristau (61), who developed it to fit the g-tensors of P450. The Ristau model is in turn an expansion of the one-term crystal field model of Griffith (62), which has traditionally been used to interpret the g-tensors of low-spin ferric iron.
The Griffith model of low-spin ferric iron assumes that the splitting, 10Dq, due to the octahedral crystal field is so large that the five 3d electrons occupy exclusively the t2g orbitals, leaving a single hole in the t2g subshell. The three-fold orbital degeneracy of this t2g hole is lifted by spin-orbit coupling, as well as by axial and rhombic crystal field components given by V and R, respectively. In addition to the two-dimensionless crystal field parameters V/ζ and R/ζ, an orbital reduction factor k ≤ 1 is typically added as a third parameter to be adjusted in the simulations. This three-parameter Griffith model has been quite successful in explaining the g-values of most low-spin ferric hemes. It has been found, however, that values of k greater than 1 are needed to match the g-values of P450 and quite generally for heme compounds with thiolate as an axial ligand (for examples, see ref. 63). As shown by Griffith (64), values of k greater than 1 can arise from quartet admixtures to the doublet state. In these cases, a model accommodating admixtures of other spin states is appropriate.
The three-term model employed in our simulations includes quartet and sextet as well as doublet states. In the simulation procedure, the crystal field components are adjusted to produce a ground multiplet of the appropriate spin, in the present case a doublet, and the desired g-tensor. The model has many adjustable parameters, and the uniqueness of a solution is thus difficult to ascertain. It may be recalled from the Griffith model, which employs only the 2T2 subset of the states used here, that is uniquely determined by the ratios S/ζ and R/ζ, and vice versa, hence all energies are given in terms of the spin-orbit coupling, ζ. Similar relations are also expected for the three-term model, but the additional energy scale defined by the Racah electron–electron interaction parameters B and C complicates the situation. In our experience with the three-term model, the adjustable crystal field parameters are exquisitely sensitive to the exact values of gx, gy, and gz. Since low-spin EPR signals have broad lines, it may be difficult to determine experimental g-values with adequate precision without using a fitting routine. Here again our version of the three-term model is useful, as it allows fitting of the line shape, as well as the g-values, in a physically meaningful fashion. The model incorporates the concept of g-strain by permitting Gaussian distributions of width σQ, σV, and σR about the means of the crystal field parameters 10Dq, V2, and R, respectively. The g-strain accounts for the slightly different conformations that may exist at the heme iron for different molecules in a frozen sample, meaning that each molecule has a slightly different crystal field and consequently, a different g-tensor. The model also employs an isotropic intrinsic line width H0to account for unresolved hyperfine structure. Not surprisingly, σQ, σV, and σR have distinctly different effects on the lineshape.
In the absence of single crystal EPR data on native and green CPO, the principal axis system of the second rank tensor g2 is not known. Barring contradictory evidence, we have assumed that the largest component is observed along the heme normal. All existing single crystal EPR data of low-spin hemes to date suggest that the largest component, gz2, is observed within 10–15° of the heme normal. In contrast, the orientation of the minimal value, gx2, in or near the heme plane is not obvious. The orientation of gx2 is not determined by the direction to the pyrrole nitrogens, which are equivalent in four-fold symmetry, but by the π-bonding capacity of the axial ligand(s), or by other deviations from four-fold symmetry about the heme normal. For native CPO, π-bonding to the lone pairs of the cysteine thiolate ligand is expected to determine the directions of gx2 and gy2, whereas for green CPO the direction to the single alkylated pyrrole nitrogen is likely to be a competing factor. In our version of the three-term model, all crystal field terms use the same coordinate system, so x, y, z represent the principal axes of g2 as well. Accordingly, the t2g single-electron states dxy, dyz, and dxzare defined relative to g2 or the crystal field, but not relative to the Fe-Npyr directions.
Having discussed the caveats in the use of the three-term model, we now turn to the results obtained. Fig. 3 shows the simulated EPR spectra obtained for green, quasi-native, and native CPO (solid lines) superimposed on the individual component spectra obtained by subtraction. In Fig. 4, an expanded scale is used to better show the fit of the EPR simulations to the directly recorded spectra of green CPO and untreated native CPO. Within the limitations of the signal-to-noise ratio for the data, the model clearly fits the measured spectra well, accounting both for the g-values and the lineshape. Further, the EPR simulation for native CPO, which was based on the component spectrum obtained by subtraction of the data in Fig. 2, clearly fits well to the EPR spectrum of native CPO which has not been exposed to allylbenzene, suggesting that the “two native species” may indeed be identical. The best-fit parameters used to generate the spectra are given in Table 1. The lower-lying spin states of green, quasi-native, and native CPO are shown in Fig. 5, with the higher states of green CPO, in particular, omitted for clarity. On the basis of the fit, native CPO has an admixed ground-state doublet that is 98.0% 2T2, 1.5% 4T1, and 0.5% 6A1, with 95% of the unpaired spin being in the dyz orbital. This ground doublet of native CPO (shown as the lowest-lying 2T2 level) is followed by the sextet centered ≈890 cm−1 higher, while the other two members of the 2T2 orbital triplet are substantially higher in energy at ≈1520 cm−1 and ≈2640 cm−1. Green CPO, in contrast, has a 100% pure 2T2 ground manifold followed by the almost pure quartet states (not shown), with the sextet state much higher in energy. Further, 99% of the unpaired spin is in the dyz orbital. Finally, quasi-native CPO has the sextet at an average energy of ≈2150 cm−1, between the two lower doublets and the third, higher doublet. Both the quartet and the sextet admixture (1.1% and 0.1%, respectively) in the ground doublet of quasi-native CPO are smaller than in native CPO. As shown in Table 1, green CPO has the smallest orbital reduction factor, k = 0.90, compared with k = 0.91 and k = 0.92 for quasi-native and native CPO, respectively. These values suggest decreasing covalency for green, quasi-native and native CPO, as expected from the strong-field character (large 10Dq, pure 2T2 ground state) of green CPO and the ligand configuration implied by the Structure 2.
Table 1.
| Parameters | Green CPO | Quasi-native CPO | Native CPO |
|---|---|---|---|
| k | 0.90 | 0.91 | 0.92 |
| 10Dq (σQ) (cm−1) | 61,160 (5080) | 36,330 (640) | 35,540 (71) |
| V2 (σ2) (cm−1) | 264 (0.0) | 209 (0.0) | 200 (0.1) |
| V4 (cm−1) | −94 | −63 | −60 |
| R (σR) (cm−1) | 425 (5) | 286 (10) | 243 (8) |
| H0 (G) | 6.0 | 5.1 | 5.5 |
Figure 5.
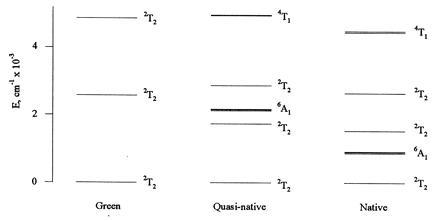
Spin state energies (6A1, 4T1, and 2T2) obtained for green, quasi-native, and native CPO from the EPR simulations of Figs. 3 and 4, using the three-term crystal field model described in the text. Only the lower-lying states are shown. In the simulations, the Racah parameters B = 1015 cm−1 and C = 4800 cm−1 and the spin-orbit coupling constant ζ = 430 cm−1 were kept fixed, while all other parameters were allowed to vary. For quasi-native and native CPO, the lowest-lying 2T2 states contain admixtures of the higher-lying quartet (4T1) and sextet (6A1) states. The lowest-lying state of green CPO is a pure doublet (2T2).
Based on the EPR data and some chemical reasoning, we can offer some speculation regarding the identity of quasi-native CPO. The Structure 2 proposed for the heme of green CPO contains two heme modifications relative to native CPO: (i) an alkylated pyrrole nitrogen, and (ii) an axial alkoxide ligand. The native CPO species observed in the EPR appears to have lost both these heme modifications, as it possesses not only entirely native spectral properties, but catalytic activity at a level close to that of untreated native enzyme. It is reasonable to propose that quasi-native CPO has lost only one of the heme modifications present in green CPO, giving rise to a spectrally distinct, but native-like, enzyme species. If we accept this proposal, two formulations are possible for the heme of quasi-native CPO: (i) a mono-N-alkylhemin lacking an alkoxide as the sixth ligand (Structure 3), and (ii) an alkoxide-ligated hemin with no pyrrole N-alkyl group (Structure 4). For Structure 3, the six-coordination of the heme iron implied by the low-spin EPR spectrum should be a result of ligation of water or hydroxide in the frozen enzyme, as occurs in native CPO (30). In Structure 4, the alkene-derived carbon skeleton must presumably be tethered to the protein part of CPO, given that the kinetics of its disappearance are slow. We have chosen to formulate Structure 4 as an alkoxide, rather than as a ligated neutral alcohol, given that the octahedral crystal field splitting in quasi-native CPO, as determined from the EPR simulations, is rather stronger than the crystal field splitting in water-ligated native CPO.
As is evident from the EPR simulations, the combination of pyrrole N-alkylation and an axial alkoxide generates a very strong octahedral crystal field splitting in green CPO. In the absence of EPR data on model hemins possessing only one of these modifications, it is not possible to dissect the contributions of the two different heme modifications to the EPR properties of green CPO. As a consequence, we cannot directly discriminate between Structures 3 and 4 for quasi-native CPO. Nevertheless, the EPR spectrum of quasi-native CPO resembles those of imidazole adducts of native CPO, where no heme N-alkylation is present (29), and appears to be generally consistent with the binding of a stronger-field ligand than water to heme b of CPO, leading us to favor Structure 4 for the structure of the quasi-native CPO active site.
The proposal of Structure 4 for quasi-native CPO also has a mechanistic rationale. It is known from studies on the nucleophilic dealkylation mono-N-alkylmetalloporphyrins (where metal ≠ Fe), that pyrrole N-dealkylation can be effected by even weak nucleophiles, depending on the identity of the metal and the alkyl group (47–52). Generation of Structure 4 from the metallacycle 2 would amount to N-dealkylation of green CPO heme by a nearby protein nucleophile. One candidate for such a reaction might be the distal glutamate residue recently identified in the x-ray crystal structure of CPO (16). Stinson and Hambright (52) have shown that even a nucleophile as weak as chloride ion can effect intramolecular pyrrole N-dealkylation in an appropriate model system. If the distal glutamate of CPO were able to serve as a nucleophile for pyrrole N-dealkylation of green CPO, the alkene-derived organic moiety would then be bound to the protein as the monoester of a diol. Slow hydrolysis of this species could then result in the generation of native CPO from green CPO by a second pathway. We are continuing the investigate the structure and reactivity of quasi-native CPO in the hope of clarifying its relation to both green and native CPO.
Quite generally, the picture that emerges from the EPR simulations is that different spin states may be interspersed on the energy scale and that all states mix to some extent, depending on the crystal field parameters. It is further clear that the crystal field components should be strong functions of interatomic distance, and thus should couple strongly to the vibrational modes of the heme–protein complex. In a more detailed model, the vibronic coupling between different spin manifolds should also be considered, as was done in the case of mixed quartet/sextet states by Bominaar and Block (65). For native CPO in particular, vibronic coupling between the ground 2T2 doublet and the excited sextet predicted near 890 cm−1 might explain the unusual temperature dependence of the low-spin quadrupole coupling first noted by Champion et al. (31). CPO, like P450, shows a low-spin to high-spin transition with increasing temperature, as is also observed in model systems (66). The spin equilibrium for CPO is evident from optical absorption studies, which show coexisting Soret peaks from high- and low-spin heme (67), as well as from the temperature dependence of the Mössbauer spectra (31). The two experimental observations, the temperature dependence of the high-spin/low-spin equilibrium in CPO and that of the quadrupole splitting, are presumably related, but no quantitative explanation has yet been given. Whether or not the spin transition involves ligand dissociation, the prediction, via a crystal field model, of a thermally accessible sextet is certainly relevant in this context.
In addition to the EPR studies discussed above, we have also recorded the Mössbauer spectra of CPO before and after inactivation with allylbenzene, as well as Mössbauer spectra of partially reactivated CPO. Fig. 6 shows Mössbauer spectra of 57Fe-enriched native CPO recorded at 4.2 K in the presence of a weak magnetic field applied parallel (Fig. 6 Upper) and perpendicular (Fig. 6 Lower) to the γ beam. As the raw spectra (not shown) displayed lines beyond ±5 mm/s due to the presence of high-spin iron species, we used previously published Mössbauer parameters (31) to simulate the corresponding spectra, and subtracted these from the recorded spectra at an intensity level of 3% to obtain the pure low-spin spectrum. The corrected spectra are shown in Fig. 6 as vertical error bars. The solid lines superimposed on the data represent simulations of the spectra (based on the spin Hamiltonian described in the Materials and Methods) using the parameters of Table 2.
Figure 6.
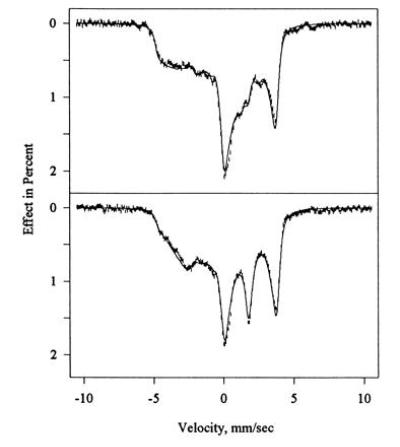
Mössbauer spectra of native CPO recorded at 4.2 K in the presence of a field of 320 G applied parallel (Upper) and perpendicular (Lower) to the γ beam. An admixture of high-spin CPO amounting to 3% of the spectral area has been subtracted to remove extraneous peaks at |v| > 5 mm/s. The subtracted Mössbauer spectra (error bars) are overlaid on simulations (solid lines) based on Eq. 1 using the parameters of Table 2.
Table 2.
| Parameters | Green CPO | Native CPO |
|---|---|---|
| g̃ | (1.94, 2.15, 2.31) | (1.82, 2.25, 2.60) |
| Ã/gN·βN (T) | (−47.7, 11.9, 1.1) | (−44.6, 7.8, 27.4) |
| ΔEQ (mm/s) | −1.81 | −3.01 |
| η | 0.47 | 0.46 |
| α, β, γ* | (0, 90, 90) | (0, 84.7, 90) |
| Γ (mm/s)† | 0.37 | 0.39 |
| δFe (mm/s)‡§ | 0.28 | 0.29 |
Euler angles (in degrees) to rotate from the principal axes of g̃ (and Ã) to the principal axes of the quadrupole interactions.
Lorentzian linewidth (full width at half maximum height).
Measured at 4.2 K.
Calculated relative to metallic Fe at 300 K.
Mössbauer studies of green CPO (prepared from the previously studied native enzyme) yielded the spectra shown in Fig. 7. In the green CPO sample, extraneous high-spin lines accounted for 10% of the total area. Appropriate spectral components were thus simulated and subtracted as described in the figure caption. Vertical error bars show the corrected experimental spectra, while the solid lines are the results of the simulation procedure.
Figure 7.
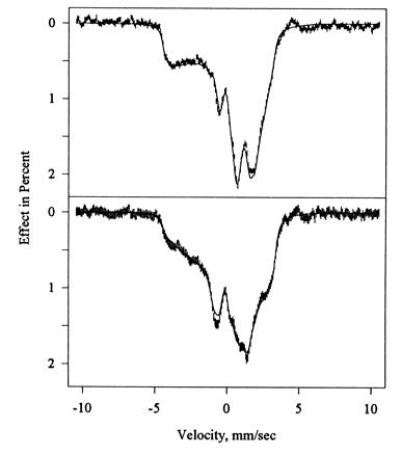
Mössbauer spectra of allylbenzene-inactivated (green) CPO at 4.2 K recorded in the presence of a field of 320 G applied parallel (Upper) and perpendicular (Lower) to the γ beam. A high-spin admixture amounting to 10% of the spectral area has been subtracted to remove extraneous peaks at |v| > 4.5 mm/s. In accordance with the EPR data, the correction consisted of 7% rhombic (g ≈ 8) and 3% axial (g ≈ 6) heme iron, and was modeled using the parameters of Champion et al. (31). The subtracted Mössbauer spectra (error bars) are overlaid on simulations (solid lines) based on Equation 1 using the parameters of Table 2.
Fig. 8 shows the Mössbauer spectra of allylbenzene-inactivated CPO following reactivation for 96 h at 4°C. This partial reactivation was undertaken to generate a mixed sample of green, quasi-native, and native CPO. The time point is approximately equivalent to reactivation for 10 h at 22°C. No subtraction of high-spin ferric components has been applied to these spectra, and bands beyond ±5 mm/s are clearly visible. In contrast to the EPR data, it was not possible to generate Mössbauer spectra of individual components present during reactivation by a subtraction procedure. Hence no simulation of the Mössbauer of quasi-native CPO has been carried out.
Figure 8.
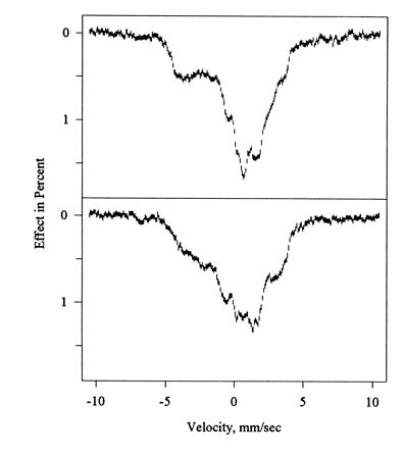
Mössbauer spectrum of partially reactivated allylbenzene-inactivated CPO at 4.2 K in the presence of a field of 320 G applied parallel (Upper) and perpendicular (Lower) to the γ beam. The Mössbauer sample of green CPO was reactivated for 96 h at 4°C to generate a sample containing green, quasi-native, and native CPO, then refrozen. No simulations are shown.
The continuous absorption bands seen in Figs. 6, 7, 8 between ±5 mm/s, and their dependence on the direction of the external field, are typical of the large magnetic and electric hyperfine interactions of low-spin ferric hemes at low temperatures. At higher temperatures, the magnetic interaction gradually averages out because of an increase in spin fluctuation rates, and broadened quadrupole doublets emerge. At temperatures up to 20 K for native CPO and to 50 K for green CPO, the spectra were indistinguishable from the spectra recorded at 4.2 K. The spin fluctuation rate at these temperatures is thus clearly small enough to allow description of the spectra in the static limit of the spin Hamiltonian (Eq. 1).
To ensure convergence to a consistent solution of Eq. 1, Mössbauer spectra taken in parallel and perpendicular fields were fitted simultaneously, and the resulting parameter set is listed in Table 2. As seen in Figs. 6 and 7, the final simulations for both green and native CPO match the data quite well. The question then arises as to what the fit parameters (Table 2) mean in terms of the electronic structure of the active site heme iron in the two enzyme species. Both complexes have ΔEQ less than zero, meaning that Vz̄z̄, the component of largest magnitude, is negative. The rotation of the quadrupole tensor with Euler angles β = γ = 90° for green CPO is a mere permutation of axes, placing Vz̄z̄ along x, Vȳȳ along z, and Vx̄x̄ along y. For native CPO with β ≈ 85° < 90°, the rotation approximates the same axis permutation, but Vz̄z̄ and Vȳȳ are slightly rotated from the x and z axes, respectively.
For the interpretation of the Mössbauer parameters in terms of electronic structure, we compare the experimental spin Hamiltonian parameters with the predictions of the standard crystal field model. As shown by the three-term model, the admixture of higher spin states amounts to less than 2% even for native CPO, and the simpler Griffith model of a t2g-hole should therefore serve as an adequate approximation. Neglecting quartet and sextet admixtures, the wavefunction of native CPO has 97% dyz character, and if we ignore electron delocalization by setting the orbital reduction factor k equal to one, the Griffith model predicts an A-tensor of Ã/gNμN = P [−0.742, 0.159, 0.481]. Here, P is an overall scale factor proportional to 〈r−3〉 of the unpaired spin that has an upper limit of P = 64 T for the most ionic iron complexes, but decreases with increasing covalency. For native CPO, the best match of empirical and predicted A-values is obtained for P = 59 T, amounting to an 8% reduction. The predicted A-tensor is then (−43.7, 9.4, 28.3) T, which matches the larger and well-defined components Axand Azwithin 3%, and the smallest one, Ay, which has the largest uncertainly, within 20%. All in all, the crystal field model in the approximation stated here thus matches the measured A-tensor of native CPO quite well. The same model predicts a valence contribution to the electric quadrupole interaction of eQ/2(Vx,x,Vy,y,Vz,z) = R (−0.956, 0.465, 0.491), where x, y, and z are the principal axes of g̃, and R is an overall scale factor proportional to 〈r−3〉 of the five 3d electrons. Obviously, the predicted tensor has almost axial symmetry about the x-axis, as expected for a dyz hole. Substituting the accepted value of R = 3 mm/s, we find (−2.88, 1.40, 1.47) mm/s as compared with the measured (−2.91, 0.79, 2.12) mm/s. Here, we approximated the Euler angle β = 84.7° by 90° to allow the principal axes of Vij to align with those of and hence of the crystal field. Agreement between the measured quadrupole tensor and the crystal-field prediction can be obtained, however, if the bonding dπ orbitals are allowed to delocalize by 8% while the nonbonding dxy orbital remains localized. Given the dyz character of the unpaired electron, an 8% delocalization of the dπ orbitals is almost equivalent to the 8% reduction of the magnetic hyperfine scale factor P used above to bring the experimental A-tensor in line with the prediction. In summary then, the crystal-field model provides an adequate explanation for the magnetic and electric properties of the heme iron in native CPO if is account is taken of the delocalization of the bonding dπ orbitals.
Adopting the Griffith approximation of the crystal field model for green CPO as well, we find the ground doublet has 98.7% dyz character—i.e., less dxz and dxy admixture than in native CPO. The model predicts an A-tensor of Ã/gNμN = P [−0.815, 0.057, 0.218]. To obtain the best match to the experimental values, we need to set P = 55.6 T, which means a 13% reduction from the standard value of 64 T and implies a greater covalency in green CPO heme than in native CPO. Using this reduced value of P, the model predicts Ã/gN μN = (−45.3, 3.2, 10.1) T. Interestingly, the match with the experimental values is much better if the y and z components are interchanged. However, such a change is not consistent with the crystal field model adopted here. Acceptable fits could be obtained with Ã/gNμN = (−47.9, 4.3, 7.2) T, which is closer to the model predictions, but the mean-square deviation was then 15% greater than for the fits shown in Fig. 7. We have therefore retained the parameters of Table 2, and attribute the discrepancy to the oversimplification of the model.
The Griffith model, finally, predicts valence contributions to the quadrupole tensor in green CPO of R (−0.982, 0.488, 0.495), which are on average 3% larger than those predicted for native CPO, as expected for a dyz hole containing even less dxyand dxzadmixture. As is evident from Table 2, native and green CPO have the same asymmetry η of the quadrupole tensors, and all the Vijvalues differ simply by a factor 1.67, with those of green CPO being smaller. The differences between the model prediction and the fitted values is therefore larger for green CPO than for native CPO, unless the overall scaling constant R is reduced by the same factor 1.67. The greater delocalization of the unpaired electron in green CPO is evident from the smaller orbital reduction factor listed in Table 1 and from the 13% reduction in the scale factor P of the magnetic hyperfine tensor mentioned above. Nevertheless, a decrease of 〈r−3〉 for all 3d electrons by a factor of 1.67 appears unreasonable. Again, it should be recalled that in calculating the quadrupole tensor form the crystal field model, we ignored the differences in delocalization of the various t2g orbitals, as well as the lattice contribution, which together may account for the apparent discrepancy. The alkylation of one of the pyrrole nitrogens according to Structure 2 breaks the four-fold symmetry of the heme, and hence orbitals other than the t2gset may be involved in iron bonding to the pyrrole nitrogens. It is interesting to speculate what lattice contribution to the quadrupole tensor might result from these structural changes. If we attempt to model the redistribution of charge in the porphyrin plane in terms of fractional point charges on the four pyrrole nitrogens, the single alkylated pyrrole nitrogen is expected to carry a less negative charge than in native CPO, and the remaining negative charge will be shared by the other three pyrrole nitrogens. While the lattice contribution to the quadrupole interaction is too small to account for the discrepancy between experiment and prediction, it possesses at least the correct symmetry, if the Fe-NpyrR vector defines the x-direction. ENDOR studies of green CPO are currently in progress and may be hoped to clarify this picture.
CONCLUSION
Simulations of the EPR spectrum of green CPO obtained by mechanism-based inactivation of native CPO with allylbenzene show this species to have a very strong octahedral crystal field splitting. The result is consistent with an assignment of the structure as a six-coordinate N-alkylhemin metallacycle. Frozen native CPO, which has water ligated to the heme iron, has a much weaker octahedral crystal field splitting, as does the quasi-native CPO present during spontaneous reactivation of the alkene-inactivated enzyme.
Acknowledgments
This work was supported by grants from the National Institutes of Health (GM 07768 to L.P.H., GM 16406 and PHS PH RR01811-11 to P.G.D., and GM 48513 to C.E.S.). A.F.D. is a recipient of a Predoctoral Fellowship in Biological Sciences from the Howard Hughes Medical Institute.
Footnotes
Abbreviations: CPO, chloroperoxidase; EPR, electron paramagnetic resonance; green CPO, CPO species obtained via mechanism-based inactivation with hydrogen peroxide plus a terminal alkene (allylbenzene in this work); heme, iron porphyrin; hemin, iron(III) porphyrin; P450, cytochrome P450; quasi-native CPO, CPO species observed during green CPO reactivation and defined by g = 1.86, 2.24, 2.50.
References
- 1.Shaw P D, Hager L P. J Biol Chem. 1960;236:1626–1630. [Google Scholar]
- 2.Hewson W D, Hager L P. In: The Porphyrins. Dolphin D, editor. Vol. 7. New York: Academic; 1979. pp. 295–332. [Google Scholar]
- 3.Dunford H B, Lambeir A-M, Kashem M A, Pickard M. Arch Biochem Biophys. 1987;251:292–302. doi: 10.1016/0003-9861(87)90034-8. [DOI] [PubMed] [Google Scholar]
- 4.Geigert J, Dalietos D J, Neidleman S L, Lee T D, Wadsworth J. Biochem Biophys Res Commun. 1983;114:1104–1108. doi: 10.1016/0006-291x(83)90676-9. [DOI] [PubMed] [Google Scholar]
- 5.Zaks A, Dodds D R. J Am Chem Soc. 1995;117:10419–10424. [Google Scholar]
- 6.Miller V P, Tschirret-Guth R A, Ortiz de Montellano P R. Arch Biochem Biophys. 1995;319:333–340. doi: 10.1006/abbi.1995.1302. [DOI] [PubMed] [Google Scholar]
- 7.Lakner F J, Hager L P. J Org Chem. 1996;61:3923–3925. doi: 10.1021/jo960074m. [DOI] [PubMed] [Google Scholar]
- 8.Dexter A F, Lakner F J, Campbell R A, Hager L P. J Am Chem Soc. 1995;117:6412–6413. [Google Scholar]
- 9.Colonna S, Gaggero N, Casella L, Carrea G, Pasta P. Tetrahedron Asymmetry. 1993;4:1325–1330. [Google Scholar]
- 10.Colonna S, Gaggero N, Manfredi A, Casella L, Gullotti M, Carrea G, Pasta P. Biochemistry. 1990;29:10465–10468. doi: 10.1021/bi00498a006. [DOI] [PubMed] [Google Scholar]
- 11.Colonna S, Gaggero N, Casella L, Carrea G, Pasta P. Tetrahedron Asymmetry. 1992;3:95–106. [Google Scholar]
- 12.Okazaki O, Guengerich F P. J Biol Chem. 1993;268:1546–1552. [PubMed] [Google Scholar]
- 13.Kedderis G L, Hollenberg P F. Biochemistry. 1985;24:6158–6163. doi: 10.1021/bi00343a019. [DOI] [PubMed] [Google Scholar]
- 14.Hawkins B K, Dawson J H. J Am Chem Soc. 1992;114:3547–3549. [Google Scholar]
- 15.Groves J T, Han Y-Z. In: Cytochrome P450: Structure, Mechanism, and Biochemistry. Ortiz de Montellano P R, editor. New York: Plenum; 1995. pp. 3–48. [Google Scholar]
- 16.Sundaramoorthy M, Terner J, Poulos T L. Structure. 1995;3:1367–1377. doi: 10.1016/s0969-2126(01)00274-x. [DOI] [PubMed] [Google Scholar]
- 17.Poulos T L, Finzel B C, Howard A J. J Mol Biol. 1987;195:687–700. doi: 10.1016/0022-2836(87)90190-2. [DOI] [PubMed] [Google Scholar]
- 18.Marnett L J, Kennedy T A. In: Cytochrome P450: Structure, Mechanism, and Biochemistry. Ortiz de Montellano P R, editor. New York: Plenum; 1995. pp. 49–80. [Google Scholar]
- 19.Reid T J, III, Murthy M R N, Sicignano A, Tanaka N, Musick W D L, Rossman M G. Proc Natl Acad Sci USA. 1981;78:4767–4771. doi: 10.1073/pnas.78.8.4767. [DOI] [PMC free article] [PubMed] [Google Scholar]
- 20.Murthy M R N, Reid T J, Sicignano A, Tanaka N, Rossman M G. J Mol Biol. 1981;152:465–499. doi: 10.1016/0022-2836(81)90254-0. [DOI] [PubMed] [Google Scholar]
- 21.Dawson J H, Sono M. Chem Rev. 1987;87:1255–1276. [Google Scholar]
- 22.Hollenberg P F, Hager L P. J Biol Chem. 1973;248:2630–2633. [PubMed] [Google Scholar]
- 23.Chiang R, Makino R, Spomer W E, Hager L P. Biochemistry. 1975;14:4166–4171. doi: 10.1021/bi00690a003. [DOI] [PubMed] [Google Scholar]
- 24.Dawson J H, Trudell J R, Barth G, Linder R E, Bunnenberg E, Djerassi C, Chiang R, Hager L P. J Am Chem Soc. 1976;98:3709–3710. doi: 10.1021/ja00428a055. [DOI] [PubMed] [Google Scholar]
- 25.Sono M, Dawson J H, Hall K, Hager L P. Biochemistry. 1986;25:347–356. doi: 10.1021/bi00350a011. [DOI] [PubMed] [Google Scholar]
- 26.Yarmola E G, Sharanov Y A. FEBS Lett. 1994;355:279–281. doi: 10.1016/0014-5793(94)01206-7. [DOI] [PubMed] [Google Scholar]
- 27.Sato M, Kon H, Kumaki K, Nebert D W. Biochim Biophys Acta. 1977;498:403–421. doi: 10.1016/0304-4165(77)90279-3. [DOI] [PubMed] [Google Scholar]
- 28.Sono M, Dawson J H, Hager L P. Inorg Chem. 1985;24:4339–4343. [Google Scholar]
- 29.Sono M, Hager L P, Dawson J H. Biochim Biophys Acta. 1991;1078:351–359. doi: 10.1016/0167-4838(91)90156-t. [DOI] [PubMed] [Google Scholar]
- 30.Fann Y-C, Gerber N C, Osmulski P A, Hager L P, Sligar S G, Hoffman B M. J Am Chem Soc. 1994;116:5989–5990. [Google Scholar]
- 31.Champion P M, Münck E, Debrunner P G, Hollenberg P F, Hager L P. Biochemistry. 1973;12:426–435. doi: 10.1021/bi00727a011. [DOI] [PubMed] [Google Scholar]
- 32.Champion P M, Chiang R, Münck E, Debrunner P, Hager L P. Biochemistry. 1975;14:4159–4166. doi: 10.1021/bi00690a002. [DOI] [PubMed] [Google Scholar]
- 33.Ortiz de Montellano P R. In: Cytochrome P450: Structure, Mechanism, and Biochemistry. Ortiz de Montellano P R, editor. New York: Plenum; 1995. pp. 245–303. [Google Scholar]
- 34.Araiso T, Rutter R, Palcic M M, Hager L P, Dunford H B. Can J Biochem. 1981;59:233–236. doi: 10.1139/o81-031. [DOI] [PubMed] [Google Scholar]
- 35.Egawa T, Miki H, Ogura T, Makino R, Ishimura Y, Kitagawa T. FEBS Lett. 1992;305:206–208. doi: 10.1016/0014-5793(92)80668-7. [DOI] [PubMed] [Google Scholar]
- 36.Rutter R, Hager L P, Dhonau H, Hendrich M, Valentine M, Debrunner P G. Biochemistry. 1984;23:6809–6816. doi: 10.1021/bi00321a082. [DOI] [PubMed] [Google Scholar]
- 37.Ortiz de Montellano P R, Choe Y S, DePillis G, Catalano C E. J Biol Chem. 1987;262:11641–11646. [PubMed] [Google Scholar]
- 38.Casella L, Gullotti M, Ghezzi R, Poli S, Beringhelli T, Colonna S, Carrea G. Biochemistry. 1992;31:9451–9459. doi: 10.1021/bi00154a018. [DOI] [PubMed] [Google Scholar]
- 39.Dexter A F, Hager L P. J Am Chem Soc. 1995;117:817–818. [Google Scholar]
- 40.Ortiz de Montellano P R, Correia M A. In: Cytochrome P450: Structure, Mechanism, and Biochemistry. Ortiz de Montellano P R, editor. New York: Plenum; 1995. pp. 305–364. [Google Scholar]
- 41.Ortiz de Montellano P R, Mangold B L K, Wheeler C, Kunze K L, Reich N O. J Biol Chem. 1983;258:4208–4213. [PubMed] [Google Scholar]
- 42.Kunze K L, Mangold B L K, Wheeler C, Beilan H S, Ortiz de Montellano P R. J Biol Chem. 1983;258:4202–4207. [PubMed] [Google Scholar]
- 43.Mashiko T, Dolphin D, Nakano T, Traylor T G. J Am Chem Soc. 1985;107:3735–3736. [Google Scholar]
- 44.Traylor T G, Miksztal A R. J Am Chem Soc. 1987;109:2770–2774. [Google Scholar]
- 45.Traylor T G, Nakano T, Miksztal A R, Dunlap B E. J Am Chem Soc. 1987;109:3625–3632. [Google Scholar]
- 46.Tian Z-Q, Richards J L, Traylor T G. J Am Chem Soc. 1995;117:21–29. [Google Scholar]
- 47.Lavallee D K, Kuila D. Inorg Chem. 1984;23:3987–3992. [Google Scholar]
- 48.Kuila D, Lavallee D K. Inorg Chem. 1983;22:1095–1099. [Google Scholar]
- 49.Lavallee D K. Inorg Chem. 1976;15:691–694. [Google Scholar]
- 50.Lavallee D K. Inorg Chem. 1977;16:955–957. [Google Scholar]
- 51.Schauer C K, Anderson O P, Lavallee D K, Battioni J-P, Mansuy D. J Am Chem Soc. 1987;109:3922–3928. [Google Scholar]
- 52.Stinson C, Hambright P. Inorg Chem. 1976;15:3181–3182. [Google Scholar]
- 53.Morris D R, Hager L P. J Biol Chem. 1966;241:1763–1768. [PubMed] [Google Scholar]
- 54.Brink D M, Satchler G R. Angular Momentum. Oxford: Clarendon; 1968. pp. 19–25. [Google Scholar]
- 55.Münck E, Groves J L, Tumolillo T A, Debrunner P G. Comp Phys Commun. 1973;5:225–238. [Google Scholar]
- 56.Lang G. Q Rev Biophys. 1970;3:1–60. doi: 10.1017/s0033583500004406. [DOI] [PubMed] [Google Scholar]
- 57.Harris G. J Chem Phys. 1968;48:191–214. [Google Scholar]
- 58.Schulz C E, Pirn P, Debrunner P G. Bull Am Phys Soc. 1992;37:1827. [Google Scholar]
- 59.Palmer G. In: The Porphyrins. Dolphin D, editor. Vol. 4. New York: Academic; 1979. pp. 313–353. [Google Scholar]
- 60.Lipscomb J D. Biochemistry. 1980;19:3590–3599. doi: 10.1021/bi00556a027. [DOI] [PubMed] [Google Scholar]
- 61.Ristau O. Period Biol. 1981;83:39–49. [Google Scholar]
- 62.Griffith J S. Nature (London) 1957;180:30–31. doi: 10.1038/180030a0. [DOI] [PubMed] [Google Scholar]
- 63.Ruf H H, Ahr H, Nastainczyk W, Ullrich V, Mansuy D, Battioni J-P, Montiel-Montoya R, Trautwein A. Biochemistry. 1984;23:5300–5306. [Google Scholar]
- 64.Griffith J S. Mol Phys. 1971;21:135–139. [Google Scholar]
- 65.Bominaar E L, Block R. J Chem Phys. 1991;95:6712–6722. [Google Scholar]
- 66.Schenker S, Hauser A, Dyson R M. Inorg Chem. 1996;35:4676–4682. [Google Scholar]
- 67.Schulz C E, Osmulski P, Xia Y-M, Debrunner P G. Hyperfine Interact. 1994;91:865–874. [Google Scholar]


