

Abstract
A sensitive, labor-saving, and easily automatable nonradioactive procedure named APEX-FCS (amplified probe extension detected by fluorescence correlation spectroscopy) has been established to detect specific in vitro amplification of pathogen genomic sequences. As an example, Mycobacterium tuberculosis genomic DNA was subjected to PCR amplification with the Stoffel fragment of Thermus aquaticus DNA polymerase in the presence of nanomolar concentrations of a rhodamine-labeled probe (third primer), binding to the target in between the micromolar amplification primers. The probe becomes extended only when specific amplification occurs. Its low concentration avoids false-positives due to unspecific hybridization under PCR conditions. With increasing portion of extended probe molecules, the probe’s average translational diffusion properties gradually change over the course of the reaction, reflecting amplification kinetics. Following PCR, this change from a stage of high to a stage of low mobility can directly be monitored during a 30-s measurement using a fluorescence correlation spectroscopy device. Quantitation down to 10 target molecules in a background of 2.5 μg unspecific DNA without post-PCR probe manipulations could be achieved with different primer/probe combinations. The assay holds the promise to concurrently perform amplification, probe hybridization, and specific detection without opening the reaction chamber, if sealable foils are used.
Keywords: amplification, Mycobacterium, primer extension, tetramethylrhodamine, titration
Fluorescence correlation spectroscopy (FCS) is a technique developed in the early 1970s (1–3), that has since then found a variety of applications (for a review, see ref. 4). It self-correlates the fluorescence intensity signal from a sample of laser-excited fluorophores to obtain information about the processes leading to temporal fluctuations. The underlying processes might be photophysical transitions, shifts in wavelength, changes in quantum yield, or simply concentration fluctuations by thermal motion (diffusion) of the fluorophores. For diffusing molecules, the fluctuation autocorrelation signal G yields information about the number of molecules in the investigated volume from its value at time zero, G(t = 0), and about the diffusion properties of the molecules from its temporal decay, G(t) (4). If the diffusion properties of the fluorescent species change during a process, this can sensitively be followed by FCS. The technique has been applied so far, for example, for measuring lateral diffusion coefficients in lipid bilayers (5), intercalation of fluorophores into nuclear chromatin (6), binding of fluorescently labeled antigens or antibodies to latex particles (7), immunoglobulin surface-binding kinetics (8), rotational diffusion times of enzymes (9), movement of actin filaments (10), binding of ligand to receptor (11), and hybridization of DNA to DNA (12) or DNA to RNA in solution (13).
In the present work, we have combined an amplification technique, namely the PCR, with a simultaneous, FCS-based detection technique using a N,N,N′,N′-tetramethyl-5-carboxyrhodamine (TMR)-labeled fluorescent probe. The probe binds to specific amplification products in between the primer binding sites, and becomes extended during PCR by the utilized 5′–3′ exonuclease-free Stoffel fragment of Thermus aquaticus DNA polymerase. After temperature cycling, this extension and incorporation into double-stranded product can directly be monitored by the increase in diffusion time of the probe through an illuminated FCS sample volume. Low concentrations of 1–10 nM probe versus 0.5 μM amplification primers proved to be in favor of a strong FCS signal, at the same time rendering detection insensible to unspecific products, that could otherwise lead to false-positives (Fig. 1). The system was tested with different primer/probe combinations on Mycobacterium tuberculosis genomic DNA as a target. Until recently, methods for the identification of Mycobacterium species have been dependent on laborious and lengthy culturing techniques for these slowly growing pathogens (14, 15). The necessity for a more rapid diagnosis due to resurgence of tuberculosis worldwide subsequent to the AIDS pandemic and the occurrence of multidrug-resistant strains has resulted in development of various PCR-based detection methods (15–17). They typically require a subsequent probe hybridization and detection step for confirmation of specific amplification. The advantages of the presented FCS-based technique over current detection procedures will be discussed.
Figure 1.
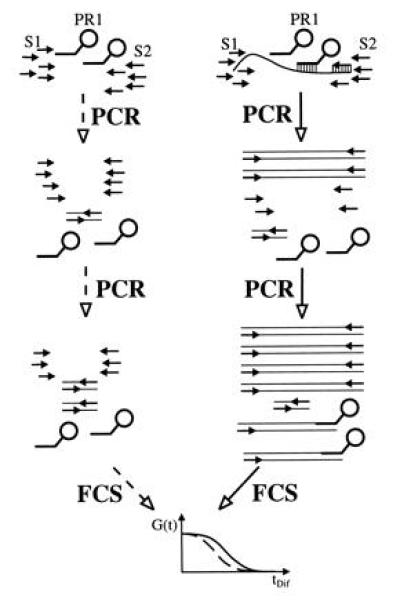
Schematic view of the APEX-FCS (amplified probe extension detected by FCS) assay in the absence (Left, dashed lines) and presence (Right, solid lines) of template. Without template, amplification primers S1 and S2 can only yield unspecific products during PCR, like primer dimers, that do not interfere with the low concentrated, fluorescent probe PR1. FCS analysis consequently reveals an unshifted fluctuation autocorrelation function G(t). With template present in the reaction mixture, PCR leads to formation of specific amplification products. Over successive PCR rounds, these increase in concentration up to a point, where hybridization with probe PR1 is efficient enough to yield extension products. The extended probe exhibits an increased diffusion time, resulting in a shifted fluorescence autocorrelation function.
EXPERIMENTAL PROCEDURES
Materials.
All oligodeoxynucleotides (Table 1) were purchased in HPLC pure quality from NAPS (Göttingen, Germany). Probes PR1, PR3, HS1, and HS3 were labeled with the 5-isomer of TMR at their 5′ end via an amino-hexyllinker. Their concentration was determined taking into account the absorbance of the TMR label at 260 nm (with A260/A554 = 0.49), and the degree of substitution (DOS) was confirmed to be one label per molecule using the equation DOS = [(10 × N/86) × A554)]/[A260 − (0.49 × A554)] (with N = the number of bases in the probe). dNTPs were obtained from Pharmacia, 5′–3′ exonuclease-free Stoffel fragment of T. aquaticus DNA polymerase was from Perkin-Elmer. Genomic DNA of M. tuberculosis was a generous gift from C. Spargo and G. T. Walker (Becton Dickinson Research Center, Research Triangle Park, NC). Human placenta DNA was purchased from Sigma, DNA marker V from Boehringer. Aerosol-resistant tips (Biozym, Hameln, Germany) were used throughout to minimize contamination of PCR reagents with amplicons.
Table 1.
Primers and probes for DNA amplification of IS6110 by PCR
| Oligodeoxynucleotide | Sequence (5′ → 3′)* | Location on IS6110† | Tm‡, °C |
|---|---|---|---|
| S1 | accgcatcgaatgcatgtctcgggtAAGGCGTACTCGACC | 970–984 | 41.7 |
| S2 | cgattccgctccagacttctcggGTGTACTGAGATCCCCT | 1027–1011 | 39.3 |
| B1B | AGCGCCGCTTCGGAC | 769–783 | 55.1 |
| B2B | TCGATGTGTACTGAGATCCCCT | 1032–1011 | 54.7 |
| PR1 | TMR-CCCCTATCCGTATGGTGG | 1015–998 | 52.0 |
| PR3 | TMR-CCCCTATCCGTATGGTGGATAACGTCTTTC | 1015–986 | 66.4 |
| HS1 | TMR-gacattgttcgtcggccgc | — | — |
| HS3 | TMR-tgctagagatctctaagttataacacatcaatgtcaa | — | — |
PCR in the Presence of Probes.
Amplification was performed in 50 or 25 μl volumes consisting of 10 mM Tris·HCl (pH 8.3), 50 mM KCl, 2.5 mM MgCl2, 0.1 mg/ml gelatine, each 0.5 μM of the two primers, 200 μM each of the four dNTPs, 50 ng/μl human placenta DNA as a high excess of unspecific carrier DNA, 1 to 20 nM of the respective TMR-labeled probe, and 0.05 unit/μl of the 5′–3′ exonuclease-free Stoffel fragment of T. aquaticus DNA polymerase. The amount of M. tuberculosis genomic DNA (in the range of 0 to 106 molecules per 50 μl reaction mixture) was as indicated. PCR was carried out in reaction tubes with an internal evaporation barrier (Multiply-Safecap tubes; Sarstedt). The following temperature profile was applied in a Biometra (Göttingen, Germany) TRIO-Thermoblock cycler: denaturation at 94°C for 30 s, annealing at 56°C (primer pair S1/S2) or 60°C (primer pair B1B/B2B), respectively, for 20 s, and elongation at 72°C for 30 s for the indicated number of cycles.
FCS Measurement and Extraction of Relative Diffusion Times.
After PCR, a 10-μl sample of the reaction mixture was applied without further manipulation to the water immersion 63 × 1.2 microscope objective of a FCS setup and equlibrated to room temperature (22°C) for 2 min. The FCS device has been described in detail elsewhere (13, 20). For every measurement, the obtained fluorescence photocount signal was autocorrelated over 30 s by a digital signal correlator card.
For a mixture of particles exhibiting a fast (τ1) and a slow (τ2) translational diffusion time (as in our case the unmodified and extended probe, respectively), the fluctuation autocorrelation function reads
 |
1 |
where y and (1 − y) are the fractions of the unmodified and extended probe forms with diffusion times τ1 and τ2, respectively, and N is the total molecule number present on average in the laser-illuminated open volume element. The normalized reciprocal of Eq. 1 yields
 |
2 |
A plot of the ratio [G(t = 0)]/[G(t)] versus time t was used for fast extraction of relative diffusion times. For y = 1 (i.e., all probe is in the fast diffusing unextended state), the plot is a linear function in the observed time window with slope 1/τ1. For y = 0 (i.e., the probe becomes completely incorporated into extension product), the straight line has the lower slope 1/τ2. At small values of t/τ2, all y values between 1 and 0 can be approximated for τ2 < 5 τ1 (in our case τ2 ≈ 3 τ1) to result in linear functions with intermediate slopes. If a larger time window (i.e., reaching to larger values of t/τ2) is considered, their non-linearity becomes more obvious. The slope of [G(t = 0)]/[G(t)] then decreases and approaches 1/τ2. By linear regression of the plots for [G(t = 0)]/[G(t)] between autocorrelation times 0.1 ms and 1.0 ms, an average value for 1/τ was obtained. Normalization with the value of the nonamplified reaction mixture and inversion yielded a measure for the relative diffusion time of the probe in the respective PCR mixture. The number of molecules N present on average in the laser focus was calculated from 1/[G(t = 0)], while total photon counts divided by N yielded the average detected photons per molecule and second.
Quantitative Analysis of Extension Products on Sequencing Gels.
An appropriate volume with a total amount of 50 fmol TMR-labeled probe was taken from each PCR mixture, the DNA ethanol precipitated and loaded either onto an 6% sequencing gel or a nondenaturing gel under omission of urea, to be analyzed by electrophoresis on an Applied Biosystems model 373A DNA sequencer as described by the manufacturer. After completion of the gel run, intensities of the fluorescent bands showing up in the yellow “T signal” were quantified, their relative distribution calculated, and their fragment lengths determined using the Genescan 672 equipment (Applied Biosystems).
RESULTS
FCS Detection of PCR Amplification Kinetics.
PCR amplification of a 106-bp product starting from 105 strands M. tuberculosis genomic DNA in a background of 2.5 μg unspecific human placenta DNA in 50 μl reaction volume was performed using primer pair S1/S2 as amplification primers and 10 nM TMR-labeled probe PR1 as detection primer (Table 1). The amplification primers target IS6110, an insertion-like element specific for M. tuberculosis and Mycobacterium bovis, that is present in about 10 copies per genome (18). The fluorescently labeled probe binds in between the amplification primers with the same orientation as S2 and overlapping with the 3′ end of S2 by 5 nucleotides. PCR utilizing the 5′–3′ exonuclease-free Stoffel fragment of T. aquaticus DNA polymerase was stopped after a varied number of temperature cycles. The autocorrelation function G(t) of the probe obtained by FCS showed a specific shift toward larger correlation times with increasing PCR cycle number (Fig. 2). Plotting the same data in the form [G(t = 0)]/[G(t)] versus correlation time (see Materials and Methods) yielded straight lines with a decreasing slope for higher amplification (Fig. 2). To rapidly extract relative probe diffusion times, linear regressions of these curves between 0.1-ms and 1.0-ms autocorrelation time were calculated, divided by the slope prior to temperature cycling (cycle 0), and inverted (see Materials and Methods). The result is shown in Fig. 3. The probe’s diffusion time clearly reflects PCR amplification kinetics with an initial lag phase (before the detection threshold is reached), rapid exponential enrichment of amplification products, and a plateau phase by attenuation of product accumulation during late PCR cycles (21). This plateau indicates saturation corresponding to an endpoint in titration. We therefore may call this particular procedure “primer end point titration” (PEP). The number of probe molecules present on average in the laser focus slightly decreases over temperature cycling, possibly by wall adsorption effects, while the number of emitted photons per molecule and second apparently increases over time (Fig. 3 Inset).
Figure 2.
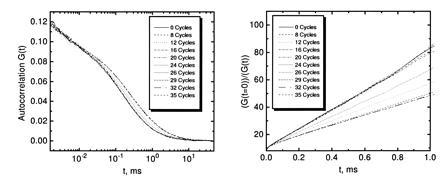
FCS analyses over successive rounds of PCR amplification of a 106-bp segment of IS6110 from M. tuberculosis. A standard PCR mixture with primers S1 and S2 and 104 target genomes in the presence of 50 ng/μl carrier DNA was supplemented with 10 nM probe PR1 to monitor specific amplification by probe extension. (Left) The obtained autocorrelation functions G(t) after the indicated numbers of thermal cycles. (Right) The linearized function [G(t = 0)]/[G(t)].
Figure 3.
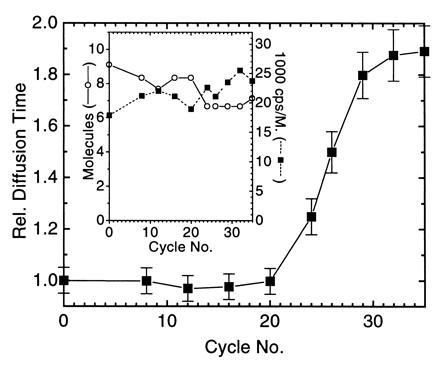
Extracted relative probe diffusion times of the experiment in Fig. 2. Error bars indicate the deviation in at least two independent FCS analyses of the PCR mixtures. (Inset) Calculated number of molecules in the FCS volume element and the detected photon counts per second (cps) and molecule.
Addition of the probe at late PCR cycles resulted in less pronounced curve shifts, indicating that accumulation of extended probe occurred over more than the last five cycles (data not shown). Since addition of probe together with the amplification primers results in the most convenient and easily automatable assay format, this procedure was retained. Neither utilization of the 5′–3′ exonuclease-competent T. aquaticus DNA polymerase nor an asymmetric PCR with only one amplification primer in opposite orientation to the probe gave rise to a significant shift of the FCS autocorrelation signal over increasing temperature cycles (data not shown).
Influence of Probe Concentration on PCR and Specificity of Probe Extension.
Fig. 4 shows PCR amplification of the 106-bp product using primer pair S1/S2 in the presence of different concentrations of probe PR1 (Table 1), starting from 104 strands M. tuberculosis genomic DNA in a background of 2.5 μg unspecific human placenta DNA in 50 μl reaction volume. There was no significant difference of amplification efficiency detectable at a probe concentration of up to 20 nM in comparison to the reaction without added probe (Fig. 4 A versus B). While amplification products were of the same specificity for all tested probe concentrations, analysis of the extended probe showed that, at concentrations of 20 nM or higher, it could occasionally be extended to unspecific products (data not shown). This phenomenon was prone to contamination of reaction mixtures with products from earlier amplifications, which is a typical observation for sensitive amplification reactions with high primer concentrations (22). At probe concentrations below 10 nM, no such unspecific probe extension products could be observed. Analysis of the fluorescent products under these conditions on a nonradioactive DNA sequencer reproducibly showed the expected full-length probe extension product expected for annealing of the probe to the 106-bp PCR product (Fig. 4C). Probe extension products became detectable on the sequencer as soon as PCR products showed up on nondenaturing gels after ethidium bromide staining, implying amplicon concentrations to be in the 10-nM range. Probe HS1, which does not bind to sequences in the M. tuberculosis genome (Table 1), showed no elongation (Fig. 4D). Since fluorophore concentrations of 1 to 5 nM also give rise to a strong FCS signal [that increases with decreasing concentration (4)], this probe concentration range was used for all further studies. Analysis on a nondenaturing gel showed, that the rhodamine-labeled products under native conditions were double strands formed by hybridization of the extended probe strands with complementary primer elongation products (data not shown).
Figure 4.
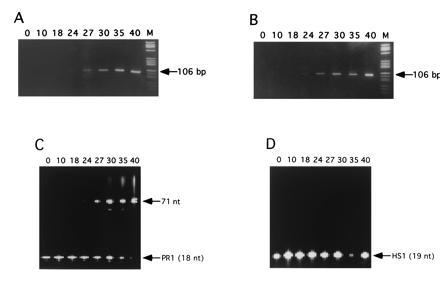
Gel analysis of amplification and probe extension products. The top panels show ethidium bromide stained, 11% nondenaturing polyacrylamide gels of 106-bp PCR products from amplification of a IS6110 sequence from M. tuberculosis, using primer pair S1/S2. PCR was performed for the indicated number of cycles in the presence of 20 nM probes PR1 (A) and HS1 (B), respectively. Lanes M contain 2 μg DNA marker V (Boehringer Mannheim). (C and D) Corresponding analyses of the probe extension products on 6% sequencing gels using an automated fluorescence sequencer.
Signal Dependence on Input Target Number.
Fig. 5 shows PCR amplification reactions for different amplification primer and probe sets, applying a constant number of either 36 or 40 thermal cycles, but with varying numbers of input target genomes, each in a background of 2.5 μg unspecific human placenta DNA in 50 μl reaction volume. Using both primer pair S1/S2 with 1 nM probe PR1 and primer pair B1B/B2B with 5 nM probe PR3 (Table 1), detection limits were below 100 M. tuberculosis genomes. By comparison with such a dilution standard, quantitation of down to 10 target sequences in a high unspecific DNA background is possible. The obtained FCS-derived diffusion time signal correlates well with quantitation of the extended probe fraction using an automated sequencer (Fig. 5 Left). Nonbinding probes like HS3 (Table 1) do not show any shift in autocorrelation function and diffusion time upon specific amplification of target sequence (Fig. 5 Right).
Figure 5.
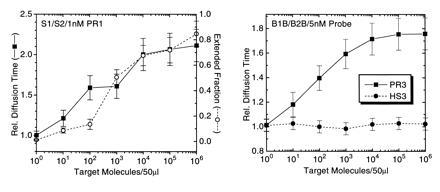
Detection limit of APEX-FCS analysis with M. tuberculosis genomes as target in the presence of 50 ng/μl carrier DNA using two different primer/probe combinations. (Left) Results after 36 amplification cycles using 0.5 μM of each primer S1 and S2 and 1 nM TMR-labeled probe PR1. (Right) Results after 40 thermal cycles using 0.5 μM of each primer B1B and B2B and 5 nM TMR-labeled probe PR3. (Left) Comparison is made between the FCS-analyzed, relative probe diffusion times, and analysis of probe extension using an automated fluorescence sequencer. (Right) FCS analysis is compared for product specific probe PR3 and noncomplementary probe HS3. Error bars represent deviations from at least two independent measurements.
DISCUSSION
In this study, we have successfully combined fluorescence correlation spectroscopy as a means to sensitively measure diffusion times of fluorescently labeled nucleic acids (12, 13), with probe extension during PCR amplification of a target sequence specific for the M. tuberculosis complex. Thus, a powerful novel detection format called APEX-FCS has been created, that allows quantification of low input target numbers in a high DNA background without the need for manipulations after PCR besides a 30 s FCS measurement. We have demonstrated, that PCR amplification is not inhibited by the presence of up to 20 nM probe. Using probe concentrations of 1–10 nM, probe extension only occurs upon hybridization to specific product, at the same time yielding a strong autocorrelation signal that can be linearized for fast evaluation of relative diffusion time. The amount of probe extension is influenced by input target number, probe concentration, and number of PCR cycles. A detection limit of 10 input target molecules was found for two different primer/probe combinations and is only limited by amplification efficiency. The spectroscopic properties of the fluorophore label do not significantly change with extensive temperature cycling.
Confirmation of specific target amplification by PCR is necessary to avoid false-positives in diagnostic tests. Classically, this has been accomplished by Southern analysis comprising gel electrophoresis, blotting, and probe hybridization, or by in solution hybridization with ELISA-type detection methods, techniques needing a couple of hours for analysis with limited throughput (23). To save time, other assay formats have been introduced to speed up probe hybridization—e.g., by post-PCR oligomer hybridization in solution and native gel electrophoresis (24), subsequent primer extension and denaturing gel electrophoresis (25), or a “probe-primer-PCR,” in which a third amplification primer binding between the other two is added to the PCR mixture to give an additional amplification product on a native gel (26). The latter approach has been hampered by the 5′–3′exonuclease activity of Taq polymerase, leading to partial degradation of the hybridized probe. Conversely, this intrinsic exonuclease activity of the enzyme can directly be used for specific product detection through analysis of radioactive probe degradation by thin layer chromatography (27). All these assays, however, have the disadvantage of requiring a subsequent electrophoretic or chromatographic step to distinguish modified and unmodified probe.
Recently, the 5′ nuclease PCR assay utilizing Taq DNA polymerase has been extended to incorporate fluorescently labeled probes. With donor/acceptor fluorophore pairs at different probe sites, degradation of probe binding to specific amplification product can be monitored as breakdown in energy transfer efficiency between the dyes (28–30). Even more recently, a variation has been proposed, where the change in energy transfer efficiency is high enough upon probe binding to monitor hybridization directly without the need for probe degradation (31). Here, a so-called molecular beacon with extremely high energy transfer efficiency is used as a probe, featuring a special donor/acceptor pair and a secondary structure to bring the interacting fluorophores close together. Upon hybridization to target, the dyes are separated in space, resulting in a fluorescence increase of the donor much more pronounced than with other double-labeled probes (29, 32). While both these assays offer the advantage of reducing post-PCR processing to a single fluorescence measurement, the APEX-FCS assay format described here requires much lower concentrations of a considerably simpler, easily available probe (1–5 nM of single fluorophore-labeled probe versus 50–300 nM double-labeled probe with a 3′ end blocking group against extension). In the 5′ nuclease PCR assay, the nick-translation activity of Taq polymerase is utilized to degrade the downstream bound probe, while in APEX-FCS, the 5′–3′ nuclease free Stoffel fragment allows its extension. Only if the probe 3′ end is base paired, extension is possible, so that APEX-FCS probes can be designed to detect single base changes. The low fluorescent probe concentration favorable for FCS measurement provides stringent conditions for probe binding to its specific target. It was shown that detectable probe extension only occurs with amplicon concentrations above 10 nM, which is consistent with the notion of hybridization kinetics limiting probe extension below this point (13). It is remarkable, that under these conditions, no significant probe degradation using 5′–3′ exonuclease-competent Taq DNA polymerase was observable by FCS analysis, indicating that higher probe concentrations are indeed necessary for the 5′ nuclease PCR assay. Another advantage of FCS is its suitability for quantitative analysis, as will be discussed in the subsequent paper. Quantitation is most important in diagnostic applications.
Probe design for APEX-FCS is straightforward and simply requires a fluorescence-labeled oligodeoxynucleotide binding in between the amplification primers with a melting point equal or higher than that of the primers. Good results were obtained with probes overlapping the 3′ end of one of the primers, possibly enhancing strand displacement capability of the polymerase. Probe sequence can be chosen freely, so that APEX-FCS detection can be applied to any established PCR system for diagnostic or screening purposes just by adding the probe. The utilized 5′–3′ nuclease free Stoffel fragment of Taq DNA polymerase was initially developed as an improved, low-cost alternative to Taq DNA polymerase in multiplex PCR applications (33, 34). Since the described assay requires only a single fluorophore label, multiplex applications with a differently labeled probe for each amplified segment can easily be performed. Both PCR and detection step of APEX-FCS lead themselves to automation. Using sealable PCR reaction compartments (35), FCS detection can be performed through the bottom foil of closed reaction vials, so that amplification and data acquisition are feasible without opening the reaction chamber to avoid cross-contamination (36). Moreover, other amplification systems like reverse transcriptase–PCR (RT–PCR) and strand displacement amplification (SDA; ref. 37) work well in the APEX-FCS format (N.G.W. and P.S., unpublished results). With RT–PCR, RNA targets can be detected, while with the isothermal SDA reaction, on line monitoring of amplification rather than endpoint observation becomes possible. Since the FCS equipment has recently become commercially available [as the ConfoCor system of EVOTEC Biosystems (Hamburg) and Zeiss], the described simplified detection method for specific amplification products can be envisioned as one example of an increasing number of sophisticated FCS applications (20, 38).
Acknowledgments
We are greatly indebted to Drs. Cathy Spargo and Terry Walker (Becton Dickinson Research Center, Research Triangle Park) for donation of M. tuberculosis genomic DNA, Sylvia Völker and Gaby Goldmann for excellent technical assistance, Prof. Rudolph Rigler (Karolinska Institute, Stockholm) for help in constructing the FCS setup, and Dr. Franz-Josef Meyer-Almes (EVOTEC Biosystems) for critical reading of the manuscript. This work was supported by EVOTEC Biosystems and Grant 0310739 from the German Ministry for Research.
Footnotes
Abbreviations: FCS, fluorescence correlation spectroscopy; TMR, N,N,N′,N′-tetramethyl-5-carboxyrhodamine; APEX-FCS, amplified probe extension detected by FCS.
References
- 1.Magde D, Elson E L, Webb W W. Phys Rev Lett. 1972;29:705–708. [Google Scholar]
- 2.Elson M E, Magde D. Biopolymers. 1974;13:1–27. doi: 10.1002/bip.1974.360130103. [DOI] [PubMed] [Google Scholar]
- 3.Ehrenberg M, Rigler R. J Chem Phys. 1974;4:390–401. [Google Scholar]
- 4.Thompson N L. In: Topics in Fluorescence Spectroscopy. Lakowicz J R, editor. Vol. 1. New York: Plenum; 1991. pp. 337–378. [Google Scholar]
- 5.Fahey P F, Koppel D E, Barak L S, Wolf D E, Elson E L, Webb W W. Science. 1977;195:305–306. doi: 10.1126/science.831279. [DOI] [PubMed] [Google Scholar]
- 6.Sorscher S M, Bartholomew J C, Klein M P. Biochim Biophys Acta. 1980;610:28–46. doi: 10.1016/0005-2787(80)90053-2. [DOI] [PubMed] [Google Scholar]
- 7.Briggs J, Elings V B, Nicoli D F. Science. 1981;212:1266–1267. doi: 10.1126/science.7015511. [DOI] [PubMed] [Google Scholar]
- 8.Thompson N L, Axelrod D. Biophys J. 1983;43:103–114. doi: 10.1016/S0006-3495(83)84328-8. [DOI] [PMC free article] [PubMed] [Google Scholar]
- 9.Kask P, Piksarv P, Mets U, Pooga M, Lippmaa E. Eur Biophys J. 1987;14:257–261. doi: 10.1007/BF00256359. [DOI] [PubMed] [Google Scholar]
- 10.Burlacu S, Borejdo J. Biophys J. 1992;63:1471–1482. doi: 10.1016/S0006-3495(92)81744-7. [DOI] [PMC free article] [PubMed] [Google Scholar]
- 11.Rauer B, Neumann E, Widengren J, Rigler R. Biophys Chem. 1996;58:3–12. doi: 10.1016/0301-4622(95)00080-1. [DOI] [PubMed] [Google Scholar]
- 12.Kinjo M, Rigler R. Nucleic Acids Res. 1995;23:1795–1799. doi: 10.1093/nar/23.10.1795. [DOI] [PMC free article] [PubMed] [Google Scholar]
- 13.Schwille P, Oehlenschläger F, Walter N G. Biochemistry. 1996;35:10182–10193. doi: 10.1021/bi960517g. [DOI] [PubMed] [Google Scholar]
- 14.Isenberg H D, D’Amato R F, Heifets L, Murray P R, Scardamaglia M, Jacobs M C, Alperstein P, Niles A. J Clin Microbiol. 1991;29:1719–1722. doi: 10.1128/jcm.29.8.1719-1722.1991. [DOI] [PMC free article] [PubMed] [Google Scholar]
- 15.Sepkowitz K A, Raffalli J, Riley L, Kiehn T E, Armstrong D. Clin Microbiol Rev. 1995;8:180–199. doi: 10.1128/cmr.8.2.180. [DOI] [PMC free article] [PubMed] [Google Scholar]
- 16.Brisson-Noel A, Gicquel B, Lecossier D, Levy-Frebault V, Nassif X, Hance A. Lancet. 1989;ii:1069–1071. doi: 10.1016/s0140-6736(89)91082-9. [DOI] [PubMed] [Google Scholar]
- 17.D’Amato R F, Wallman A A, Hochstein L H, Colaninno P M, Scardamaglia M, Ardila E, Ghouri M, Kim K, Patel R C, Miller A. J Clin Microbiol. 1995;33:1832–1834. doi: 10.1128/jcm.33.7.1832-1834.1995. [DOI] [PMC free article] [PubMed] [Google Scholar]
- 18.Thierry D, Cave M D, Eisenach K D, Crawford J T, Bates J H, Gicquel B, Guesdon J L. Nucleic Acids Res. 1990;18:188. doi: 10.1093/nar/18.1.188. [DOI] [PMC free article] [PubMed] [Google Scholar]
- 19.Rychlik W, Rhoads R E. Nucleic Acids Res. 1989;17:8543–8551. doi: 10.1093/nar/17.21.8543. [DOI] [PMC free article] [PubMed] [Google Scholar]
- 20.Eigen M, Rigler R. Proc Natl Acad Sci USA. 1994;91:5740–5747. doi: 10.1073/pnas.91.13.5740. [DOI] [PMC free article] [PubMed] [Google Scholar]
- 21.Saiki R K, Gelfand D H, Stoffel S, Scharf S J, Higuchi R, Horn G T, Mullis K B, Erlich H A. Science. 1988;239:487–491. doi: 10.1126/science.2448875. [DOI] [PubMed] [Google Scholar]
- 22.Kwok S, Higuchi R. Nature (London) 1989;339:237–238. doi: 10.1038/339237a0. [DOI] [PubMed] [Google Scholar]
- 23.Lazar J G. PCR Methods Appl. 1994;4:S1–S14. doi: 10.1101/gr.4.1.s1. [DOI] [PubMed] [Google Scholar]
- 24.Greenberg S J, Ehrlich G D, Abbott M A, Hurwitz B J, Waldman T A, Poiesz B J. Proc Natl Acad Sci USA. 1989;86:2878–2882. doi: 10.1073/pnas.86.8.2878. [DOI] [PMC free article] [PubMed] [Google Scholar]
- 25.Kaluz S, Reid K B M. Nucleic Acids Res. 1991;19:4012. doi: 10.1093/nar/19.14.4012. [DOI] [PMC free article] [PubMed] [Google Scholar]
- 26.Kai M, Kamiya S, Sawamura S, Yamamoto T, Ozawa A. Nucleic Acids Res. 1991;19:4562. doi: 10.1093/nar/19.16.4562. [DOI] [PMC free article] [PubMed] [Google Scholar]
- 27.Holland P M, Abramson R D, Watson R, Gelfand D H. Proc Natl Acad Sci USA. 1991;88:7276–7280. doi: 10.1073/pnas.88.16.7276. [DOI] [PMC free article] [PubMed] [Google Scholar]
- 28.Lee L G, Connell C R, Bloch W. Nucleic Acids Res. 1993;21:3761–3766. doi: 10.1093/nar/21.16.3761. [DOI] [PMC free article] [PubMed] [Google Scholar]
- 29.Livak K J, Flood S J A, Marmaro J, Giusti W, Deetz K. PCR Methods Appl. 1995;4:357–362. doi: 10.1101/gr.4.6.357. [DOI] [PubMed] [Google Scholar]
- 30.Livak K J, Marmaro J, Todd J A. Nat Genet. 1995;9:341–342. doi: 10.1038/ng0495-341. [DOI] [PubMed] [Google Scholar]
- 31.Tyagi S, Kramer F R. Nat Biotechnol. 1996;14:303–308. doi: 10.1038/nbt0396-303. [DOI] [PubMed] [Google Scholar]
- 32.Parkhurst K M, Parkhurst L J. Biochemistry. 1995;34:285–292. doi: 10.1021/bi00001a035. [DOI] [PubMed] [Google Scholar]
- 33.Lawyer F C, Stoffel S, Saiki R K, Chang S Y, Landre P A, Abramson R D, Gelfand D H. PCR Methods Appl. 1993;2:275–287. doi: 10.1101/gr.2.4.275. [DOI] [PubMed] [Google Scholar]
- 34.Varadaraj K, Skinner D M. Gene. 1994;140:1–5. doi: 10.1016/0378-1119(94)90723-4. [DOI] [PubMed] [Google Scholar]
- 35.Schober A, Walter N G W, Tangen U, Strunk G, Ederhof T, Dapprich J, Eigen M. BioTechniques. 1995;18:652–660. [PubMed] [Google Scholar]
- 36.Oehlenschäger F, Schwille P, Eigen M. Proc Natl Acad Sci USA. 1996;93:12811–12816. doi: 10.1073/pnas.93.23.12811. [DOI] [PMC free article] [PubMed] [Google Scholar]
- 37.Walker G T, Fraiser M S, Schram J L, Little M C, Nadeau J G, Malinowski D P. Nucleic Acids Res. 1992;20:1691–1696. doi: 10.1093/nar/20.7.1691. [DOI] [PMC free article] [PubMed] [Google Scholar]
- 38.Rigler R. J Biotechnol. 1995;41:177–186. doi: 10.1016/0168-1656(95)00054-t. [DOI] [PubMed] [Google Scholar]