

Abstract
Nucleic acid sequence-based amplification (NASBA) has proved to be an ultrasensitive method for HIV-1 diagnosis in plasma even in the primary HIV infection stage. This technique was combined with fluorescence correlation spectroscopy (FCS) which enables online detection of the HIV-1 RNA molecules amplified by NASBA. A fluorescently labeled DNA probe at nanomolar concentration was introduced into the NASBA reaction mixture and hybridizing to a distinct sequence of the amplified RNA molecule. The specific hybridization and extension of this probe during amplification reaction, resulting in an increase of its diffusion time, was monitored online by FCS. As a consequence, after having reached a critical concentration of 0.1–1 nM (threshold for unaided FCS detection), the number of amplified RNA molecules in the further course of reaction could be determined. Evaluation of the hybridization/extension kinetics allowed an estimation of the initial HIV-1 RNA concentration that was present at the beginning of amplification. The value of initial HIV-1 RNA number enables discrimination between positive and false-positive samples (caused for instance by carryover contamination)—this possibility of discrimination is an essential necessity for all diagnostic methods using amplification systems (PCR as well as NASBA). Quantitation of HIV-1 RNA in plasma by combination of NASBA with FCS may also be useful in assessing the efficacy of anti-HIV agents, especially in the early infection stage when standard ELISA antibody tests often display negative results.
The diagnosis of HIV-1 infection depends on detecting the presence of virus or a serologic response to the virus (1, 2). The standard Food and Drug Administration-approved antibody tests utilize HIV-1 p24 enzyme-linked immunosorbent assays (ELISA), coupled with Western blot confirmation of suspected positive samples. The ELISA test is inexpensive, extremely sensitive, and easy to perform, and therefore enables the screening of large numbers of blood samples. However, several studies (3–5) have documented HIV-1-infected subjects who were seronegative for 2–36 months prior to seroconversion as assayed by the approved ELISAs. This period of “silent” HIV-1 infection mainly occurs in individuals recently infected with HIV-1, when antibodies against viral proteins have not yet developed. This situation can be clarified by repeating serological testing after certain time steps, by detecting HIV in cultured peripheral blood lymphocytes from the subject (3–5) or by PCR amplification of HIV-1 DNA in peripheral blood lymphocytes (6, 7).
Among these, HIV-1 DNA amplification by PCR has been established as the most sensitive and widely used method (8–10), allowing quantitation of HIV-1 RNA in plasma by quantitative competitive PCR (11). It could be shown that the number of HIV-1 RNA molecules in plasma ranges from 100 to nearly 22,000 copies per milliliter plasma corresponding to 50–11,000 virions per milliliter (11).
Recently, an alternative method to PCR, the nucleic acid sequence-based amplification (NASBA), was developed (12–14). It enables the detection of HIV-1 RNA in plasma up to 100 initial RNA molecules per milliliter plasma by amplifying RNA target molecules (15). In contrast to PCR, no thermocycling is necessary; the isothermal NASBA amplification is carried out at only one temperature (usually at 42°C).
The NASBA amplification mechanism can be divided into a noncyclic and a cyclic phase; in the initial noncyclic phase the RNA template molecules are reverse transcribed by a reverse transcriptase, followed by second-strand DNA synthesis and transcription of the resulting double-stranded DNA by T7 RNA polymerase (the T7 promoter sequence is supplied by the reverse transcription primer). This leads to antisense RNA molecules which then are amplified in the cyclic reaction phase (Fig. 1).
Figure 1.

Amplification cycle of NASBA reaction; a stretch of HIV-1 RNA genome (HXB2) is amplified via a noncyclic and cyclic phase. Introducing fluorescently labeled probe gag1 resulted in a shorter amplification product (108 b RNA) additional to the normal 145 b RNA product.
The amplification products can be detected by enzyme-linked gel assay (ELGA) or by electrochemiluminescence (ECL), both applying the principle of probe hybridization to the amplified RNA molecules (16, 17).
We describe here the coupling of NASBA amplification with detection by fluorescence correlation spectroscopy (FCS) resulting in a major improvement of NASBA technology. A third, fluorescently labeled primer was introduced into the amplification reaction, binding at a distinct position of the amplified RNA molecule (Fig. 2). The hybridization and extension of this probe during amplification was monitored online by measuring the increase of its diffusion time (FCS).
Figure 2.
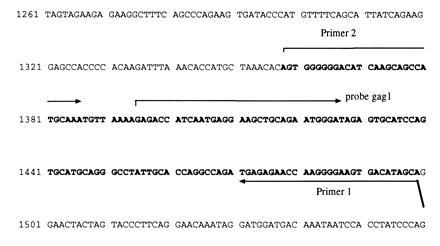
Part of HIV-1 genome (HXB2, displayed as desoxyribonucleotides); the sequence amplified by NASBA primers 1 and 2 is marked by bold letters. The binding site of probe gag1 within this amplified region and binding sites of primers 1 and 2 are displayed by arrows.
MATERIALS AND METHODS
Materials.
The components for RNA isolation and NASBA were obtained from Organon Teknika–Cappel. The N,N,N′,N′-tetramethyl-5-carboxyrhodamine (TMR) labeled probe gag1 was synthesized by NAPS (Göttingen, Germany). The ELGA detection system and HIV-1 RNA (18) stock solution (HXB2) were purchased from Organon Teknika–Cappel. The plastic sheets containing 96 reaction vessels (Fig. 3) were manufactured in the Feinmechanikwerkstatt of Max Planck Institute for Biophysical Chemistry; each vessel has a volume of 40 μl and a wall thickness of 40 μm. The plasma was obtained from the Klinikum of University of Göttingen; it was tested to be hepatitis B and C, cytomegalovirus, and HIV-1 negative.
Figure 3.
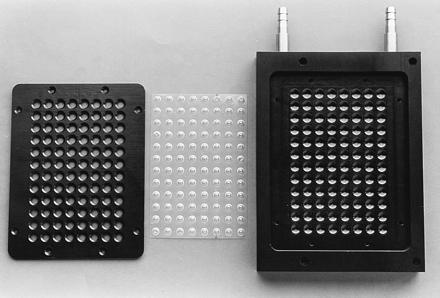
Plastic sheet with 96 reaction vessels and the two parts of the heating block in which the NASBA reactions with online FCS detection were carried out.
Simulation of HIV-1 Infection.
To simulate HIV-1 infection, 1 ml of plasma was spiked with different amounts (1000, 2000, 5000, and 20000 molecules) of genomic HIV-1 RNA (HXB2). Lysis buffer (9 ml) [5.25 M guanidinethiocyanate/50 mM Tris, pH 6.4/20 mM EDTA/1.3% (wt/vol) Triton X-100] was added.
Isolation of Nucleic Acids from Plasma.
Nucleic acids were bound to activated silica (50 μl suspension, 1 mg/ml) which was added to the lysis mixture (19). After washing and drying the silica, the nucleic acids were eluted with 50 μl elution buffer (1 mM Tris, pH 8.5) and stored at −70°C.
NASBA Amplification of Isolated HIV-1 RNA.
Typical reactions were performed in a 20 μl volume containing 40 mM Tris (pH 8.5), 12 mM MgCl2, 42 mM KCl, 5 mM DTT, 15% (vol/vol) dimethyl sulfoxide, 1 mM each dNTP, 2 mM each NTP, 0.1 unit RNase H, 0.1 μg/μl BSA, 40 units T7 RNA polymerase, 8 units avian myeloblastosis virus reverse transcriptase, 0.2 μM primer 1, 2, and 5 μl of isolated nucleic acid (containing 100, 200, 500, 2000 molecules of HIV-1 RNA molecules); in negative control reactions these 5 μl of isolated nucleic acids were replaced by 5 μl of double distilled water. The amplification primer sequences are located within the gag region of the HIV-1 genome (Fig. 2). They display the following sequences: primer 1, 5′-AAT TCT AAT ACG ACT CAC TAT AGG GTG CTA TGT CAC TTC CCC TTG GTT CTC TCA-3′ (antisense NT 1471–1499 of HXB2, T7 promoter sequence is underlined); and primer 2, 5′-AGT GGG GGG ACA TCA AGC AGC CAT GCA AA-3′ (sense NT 1358–1386 of HXB2). To the reaction mixture 1 μl of TMR-labeled probe gag1 was added (final concentration: 4.5 nM): gag1, 5′-TMR-GAG ACC ATC AAT GAG GAA GCT GCA GAA TGG GAT-3′ (sense NT 1395–1427 of HXB2). These final amplification mixes (each 21 μl) were transduced into the vessels of the plastic sheet, the sheet was sealed, turned around, and fixed on the thermoblock of the FCS detecting unit (Fig. 4) which was prethermostated at exactly 42°C. In a typical experiment, 10 amplification reactions were carried out in parallel (negative control reactions included). Prior denaturation of primers with HIV-1 RNA target was not necessary; the amplification was carried out for 70 min. The diffusion time of fluorescently labeled probe gag1 (proportional to its rate of hybridization/extension during the amplification reaction), was monitored online by FCS.
Figure 4.
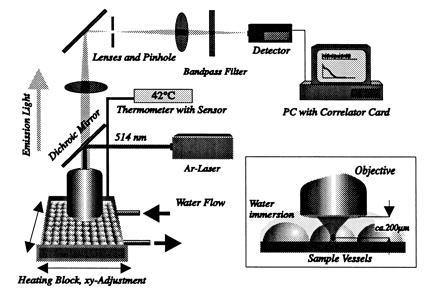
FCS detection unit. The plastic sheet was fixed on a heating block at 42°C. Ten samples were subjected to FCS laser beam one after another, which generated the volume element within these vessel (Inset) at a distance of 200 μm from the objective. The heating block was moved by computer, thus ensuring reproducible measurements. Fluorescence intensities of probe gag1 within the volume element were processed online by PC correlator card leading to autocorrealation curves.
Quantitation of Probe Extension by Applied Biosystems 672 genescan Software.
To determine the extension rate of probe gag1 after the completion of amplification reaction, a 8 μl aliquot of the reaction mixture was loaded on a 8% denaturating polyacrylamide gel; the gel was run in an Applied Biosystems model 373A DNA sequencer for 6 h at 30 W. The fluorescence intensities of extended and nonextended probe gag1 were quantified by Applied Biosystems 672 genescan software (see Fig. 7).
Figure 7.
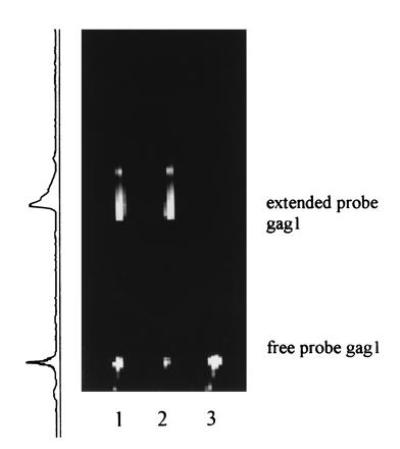
Quantitation of probe extension by Applied Biosystems genescan software: Lanes 1 and 2: 8 μl of NASBA mixture after 70-min incubation (20,000 initial HIV-1 RNA molecules); upper band, extended probe gag1; lower band, nonextended probe. Lane 3: 8 μl of negative control after 70 min (nonextended probe gag1). The profile of fluorescence intensity of lane 1 is displayed on the left side; the values of extension were calculated by peak-integration.
Detection of Amplified RNA (145 bases) by ELGA.
The NASBA-amplified RNA (145 bp) was in solution and was hybridized to a horseradish peroxidase-conjugated oligonucleotide probe (sense NT 1395–1427 of HXB2); the hybridization product was run on a native PAGE containing 0.004% dextran sulfate (see Fig. 8). The band of the horseradish peroxidase probe hybridized to the amplified RNA was stained with tetramethylbenzidine and peroxide (20).
Figure 8.
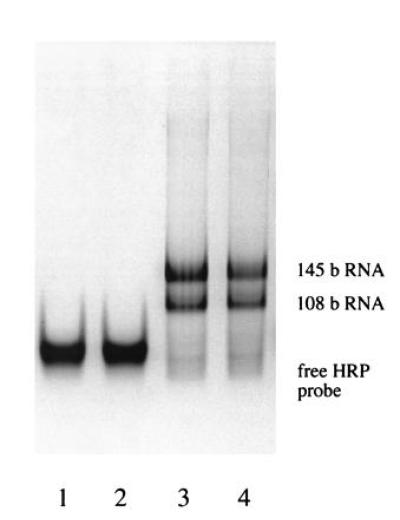
Characterization of RNA amplification products by ELGA. Lanes 1 and 2: 3 μl of NASBA negative controls after 70 min (free horseradish peroxidase oligonucleotide probe). Lanes 3 and 4: 3 μl of NASBA reaction after 70-min incubation (2000 initial HIV-1 RNA molecules); two RNA products (108 and 145 bases, see Fig. 1) could be observed.
Online Detection of Probe gag1 Diffusion Time by FCS During NASBA.
FCS is a special case of fluctuation correlation techniques, where the laser-induced fluorescence out of a very small probe volume is autocorrelated in time (21–23). Therefore, a noninvasive determination of molecular dynamics in the single molecule range can be carried out, yielding chemical reaction constants or diffusion coefficients (24–26). In our case, the volume element was defined by a laser beam [Lexel Argon Ion (Waldbroon, Germany), 514 nm at 0.1 mW] focused by a water-immersion microscope objective (Zeiss Plan Neofluar 40×0.9) to an open focal light cell of ≈10−15 liter volume (27, 28).
Fluorescent molecules in solution traversing this cell were excited for a short time (in the order of 0.1–1 ms) given by the diffusion coefficients. Slight changes in the diffusion coefficient thus could be measured.
Fig. 4 shows the experimental setup. The laser beam was focused in the sample where the reaction took place. The outcoming fluorescence light was collected by the same objective, laser scattering was blocked by a dichroic mirror, proper bandpass filters [Omega Optics (Vermont); 565 DF 45), and a pinhole in image space (27, 29). Fluorescence was detected by a SPAD (EG & G-Chemie, Steinheim, Germany; SPCM 200) and signal autocorrelation was carried out by PC with a digital correlator card (ALV-5000 Fa.Peters, Langen, Germany). The thermoblock contained 96 sample vessels covered with water for immersion optics.
RESULTS
Human plasma was spiked with different amounts of HIV-1 RNA (HXB2) to simulate HIV infection (1000, 2000, 5000, and 20000 molecules RNA per ml of plasma). The mixtures were lysed with 5.25 M guanidinethiocyanate, the nucleic acids were isolated by binding at activated silica and subjected to NASBA procedure. NASBA was performed as described by van Gemen et al. (15) but differing in the following aspects.
(i) A fluorescently labeled DNA probe (gag1) was introduced into the standard reaction mixture (15) hybridizing at a specific sequence of the amplified 145 bases long RNA molecule (Fig. 1). As a consequence, this DNA probe was elongated by avian myeloblastosis virus reverse transcriptase, finally resulting in a double-stranded DNA molecule of 130 bp (the original double-stranded DNA amplification product generated by primer 1 and 2 has a length of 167 bp, see Fig. 1).
(ii) All components of NASBA reaction (DNA probe gag1 and enzymes included) were mixed together on ice without prior denaturation of primers with RNA template at 65°C; the denaturation step could be omitted without any influences on reaction specificity.
(iii) In a typical experiment, 10 NASBA reactions (negative controls included) were performed in parallel in a plastic sheet with 96 reaction vessels (Fig. 3); after being filled, these vessels were sealed and the reaction was triggered by fixing the plastic sheet on a prethermostated block at exactly 42°C.
(iv) In standard NASBA procedures, the amplified RNA is detected and quantified by solution hybridization techniques after completion of the reaction (ELGA, ECL) (14–16). These techniques require opening of the test tubes where amplification reaction was performed, resulting in a release of amplification products—one of the major sources for carryover contaminations. Using FCS detection from outside the sealed plastic sheet, we could minimize the risk of contamination (Fig. 4). When the amplification was finished after 70 min, sheets were discarded without opening (exceptions were made, when amplification products were characterized by other techniques like genescan or ELGA).
Development and Optimization of the FCS-NASBA Detection Unit.
The experimental set-up for the online detection of amplified RNA is illustrated in Fig. 4. With an objective working distance of ≈200 μm and water-like optical properties, the very thin plastic vessel wall (≈40 μm; Fig. 3) was no significant obstacle for the focused laser beam; the FCS volume element (volume, 10−15 liter) could easily be placed inside the vessels, where the reaction took place.
The correlation data collection for each vessel took 30 s per time step, which might be reduced in the future below 10 s.
Quantitation of Amplified RNA.
Fig. 5 shows a typical time course of correlation curve shifting due to hybridization/extension of probe gag1 (5000 initial target RNA molecules). Every single curve can be characterized by their t → 0 amplitude and by the time τd where the amplitude has dropped to one-half of the starting value. The inverse of the first yields the average number of molecules in the observed volume; the second defines the average diffusion time.
Figure 5.
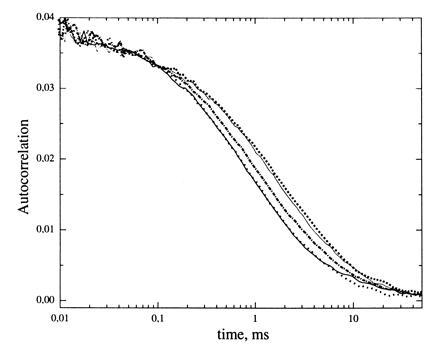
Shift of autocorrelation curves in course of the NASBA reaction: ——, 10 min; •••, 20 min, ·-·-·-, 35 min; ···, 50 min; and ---, 60 min after starting NASBA. The shift represents an increase of probe gag1 diffusion time caused by hybridization/extension (initial HIV-1 RNA number, 5000 molecules per ml plasma).
To determine the exact rate of hybridized/extended probe, the autocorrelation curves had to be evaluated quantitatively. The theoretical description of autocorrelation curves for diffusional systems with two components is approximately given by:
 |
1 |
where N is the average number of molecules in the fixed open volume element, τ1 and τ2 are diffusion times for two molecule species (species 1, free probe gag1; species 2, hybridized/extended probe gag1), respectively. Both the bound and the extended probe were treated as one species, since the hybrid (probe gag1-145 base RNA) and the 130-bp extension product resulting from this hybrid (Fig. 1) exhibited nearly the same diffusion times and therefore could not be distinguished. Y is the fraction of species 2.
Knowing the diffusion time τ1 for free probe (Y = 0), the correlation curves (Fig. 5) were fitted with Eq. 1, yielding the kinetics of fraction Y (Fig. 6).
Figure 6.
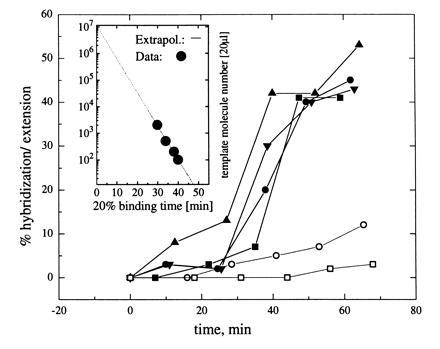
Rate of hybridization/extension of probe gag1 versus NASBA incubation time (in percent): □, negative control; ○, false-positive sample; ▪, 1000 initial HIV-1 RNA molecules per milliliter plasma; •, 2000 molecules; ▾, 5000 molecules; ▴, 20,000 molecules. (Inset) Incubation time necessary for defined fraction of detected target as a function of initial concentration, the principle of quantitation standard by FCS.
By looking at the kinetics of probe hybridization/extension, the initial number of RNA molecules could be estimated. The kinetic curve (Fig. 6) was shifted toward longer incubation times when less RNA template molecules were present at the beginning of amplification reaction. In case of false-positive samples, only a few template molecules are provided by contamination, resulting in a large shift of the kinetic curve toward longer incubation times—a clear discrimination between them and positive samples is possible.
For direct quantitative analysis, an important facet of diagnostic tests, the initial number of RNA molecules per sample can be determined as follows. The time dependence of amplification product concentration for NASBA reactions is approximately described by an exponential function: P(t) = P0 exp(kt), where k is a rate constant representative of amplification mechanism. The logarithm of the number of molecules contained in the sample volume appears to be a linear function of incubation time necessary to yield a definite fraction of primer binding (see Fig. 6 Inset). In this plot, the ordinate intercept implies this chosen final fraction, so that a standard dilution series allows quantitation of the initial target concentration.
Quantitation of Probe gag1 Extension by genescan Software.
Typical NASBA reactions were carried out for 70 min. The values of probe extension at this time were calculated by Applied Biosystems genescan software (Fig. 7) and compared with those, obtained by FCS (Table 1). Only slight differences between both methods could be observed, confirming the FCS results. In certain cases, the FCS values might be slightly higher, because additionally to extension also probe hybridization is detected.
Table 1.
Rate of probe gag1 extension after 70-min incubation (in %)
| Initial number of
HIV-1 RNA molecules per ml plasma
|
|||||
|---|---|---|---|---|---|
| 1000 | 2000 | 5000 | 20,000 | False-positive sample | |
| Quantitation by genescan | 42 ± 3 | 47 ± 3 | 31 ± 3 | 53 ± 3 | 8 ± 3 |
| Quantitation by FCS* | 41 ± 5 | 46 ± 5 | 40 ± 5 | 54 ± 5 | 12 ± 5 |
Additional to extension also probe hybridization is detected by FCS.
Identification of Amplified RNA by ELGA.
As an additional control, the amplification products were detected by ELGA (Fig. 8). As expected, not only the main product (145-base RNA) was observed, but also a smaller RNA (108 bases), which had its origin in the hybridization of probe gag1 to the 145-base RNA (Fig. 1). This fact proves that (i) the presence of probe gag1 does not affect the specificity of NASBA reaction at all, and (ii) probe gag1 is specifically extended and processed during NASBA.
DISCUSSION
The combination with FCS detection proved to be a major progress in NASBA technology (13, 14, 30): (i) NASBA products could be detected and quantified online by measuring the increase in diffusion time of a fluorescently labeled probe (Figs. 5 and 6); (ii) the use of plastic sheets with 96 reaction vessels (Fig. 3) enabled parallel screening of samples; (iii) further characterization of amplification products, which would require opening of the NASBA reaction vessels, was no longer necessary—the plastic sheets were discarded after completion of NASBA, leading to minimization of carryover contamination risk; (iv) the initial number of template RNA molecules at the beginning of NASBA reaction could be estimated by the time-shift of the kinetic curve (Fig. 6)—identification of false-positive samples was therefore possible; (v) introducing the fluorescently labeled probe did not result in a loss of specificity and sensitivity of NASBA [confirmed by ELGA (16) and genescan software, Figs. 7 and 8]—at least 1000 HIV-1 RNA molecules (HXB2) per milliliter plasma (i.e., ≈10−18 M) could be detected reproducibly (note that the sample volume is of the order of magnitude of 10 μl only, which then may contain as few as 10 molecules); and (6) the third primer (gag1) yields high specificity of detection in case of upgrowth of unspecific RNA.
In the study presented here, we used a combined approach of probe hybridization and extension; the values obtained by FCS have been controlled by genescan and eventually occurring unspecific binding of probe (also leading to a positive FCS signal), would have been detected. Since in more than 50 NASBA tests no unspecific binding could be observed, in future routine use of the NASBA-FCS technique the extension of probe might be neglected (e.g., by using a didesoxynucleotide at 3′ end of probe). The increase of probe diffusion time caused only by hybridization to the amplified RNA (26) should be sufficient for reproducible FCS detection.
The combination of NASBA with FCS presented in this study should not be restricted only to the detection of HIV-1 RNA in plasma; though HIV is the most popular example of viral infections, the diagnosis of hepatitis (hepatitis B and C) is much more challenging (31, 32). The number of infected subjects all around the world increases from day to day (up to 20% of the individuals in parts of Africa and Asia are infected with hepatitis B virus), and in contrast to HIV, the infection is not restricted mainly to risk groups, it concerns the whole population.
Acknowledgments
We thank Dr. Schartl (Organon Teknika–Cappel) for cooperation. We are grateful to the Feinmechanikwerkstatt of Max Planck Institute for Biophysical Chemistry for their excellent work. This work was financed by the Bundesministerium für Bildung und Forschung (Grant FK 0310739). Financial support by EVOTEC BioSystems (Hamburg) is gratefully acknowledged.
Footnotes
Abbreviations: FCS, fluorescence correlation spectroscopy; NASBA, nucleic acid sequence-based amplification; ELGA, enzyme-linked gel assay; TMR, N,N,N′,N′-tetramethyl-5-carboxyrhodamine.
References
- 1.Sarngadharan M G, Popovic M, Bruch L, Schüpbach J, Gallo R C. Science. 1984;224:506–508. doi: 10.1126/science.6324345. [DOI] [PubMed] [Google Scholar]
- 2.Weiss S H, Goedert J J, Sarngadharan M G, Bodner A J, Gallo R C, Blattner W A. J Am Med Assoc. 1985;253:221–225. [PubMed] [Google Scholar]
- 3.Ranki A, Valle S L, Krohn M, Antonen J, Allain J P, Leuther M, Franchhini G, Krohn K. Lancet. 1987;ii:589–595. doi: 10.1016/s0140-6736(87)92985-0. [DOI] [PubMed] [Google Scholar]
- 4.Salahuddin S Z, Markham P D, Redfield R R. Lancet. 1984;ii:1418–1420. doi: 10.1016/s0140-6736(84)91619-2. [DOI] [PubMed] [Google Scholar]
- 5.Mayer K H, Stoddard A M, McCusker J, Ayotte D, Ferriami R, Groopman J E. Ann Intern Med. 1986;104:194–196. doi: 10.7326/0003-4819-104-2-194. [DOI] [PubMed] [Google Scholar]
- 6.Haseltine W A. N Engl J Med. 1989;320:1487–1489. doi: 10.1056/NEJM198906013202210. [DOI] [PubMed] [Google Scholar]
- 7.Loche M, March B. Lancet. 1988;ii:418–421. doi: 10.1016/s0140-6736(88)90412-6. [DOI] [PubMed] [Google Scholar]
- 8.Ou C Y, Kwok S, Mitchell S W, Mack D H, Sninsky J J, Kreb J W, Feorino P, Warfield D, Schochetman G. Science. 1988;239:295–297. doi: 10.1126/science.3336784. [DOI] [PubMed] [Google Scholar]
- 9.Roger M F, Ou C Y, Rayfield M, Thomas P A, Schoenbaum E E, Abrams E, Krasinski K, Selwyn P A, Moore J, Kaul A, Grimm K T, Bamji M, Schochetman G. N Engl J Med. 1989;320:1649–1654. doi: 10.1056/NEJM198906223202503. [DOI] [PubMed] [Google Scholar]
- 10.Vyas G N, Yang G, Murphy E. Trans Med Rev. 1994;8:253–266. doi: 10.1016/s0887-7963(94)70117-6. [DOI] [PubMed] [Google Scholar]
- 11.Piatak M, Jr, Saag M S, Yang L C, Clark S J, Kappes J C, Luk K-C, Hahn B H, Shaw G M, Lifson J D. Science. 1993;259:1749–1753. doi: 10.1126/science.8096089. [DOI] [PubMed] [Google Scholar]
- 12.Compton J. Nature (London) 1991;350:91–92. doi: 10.1038/350091a0. [DOI] [PubMed] [Google Scholar]
- 13.Kievits T, van Gemen B, van Strijp D, Schukkink R, Dircks M, Adriaanse H, Malek L, Sooknanan R, Lens P. J Virol Methods. 1991;35:273–286. doi: 10.1016/0166-0934(91)90069-c. [DOI] [PubMed] [Google Scholar]
- 14.van Gemen B, Wiel P, van Beuningen R, Silleken P, Jurriaans S, Dries C, Schoones R, Kievits T. PCR Methods Appl. 1995;4:177–184. doi: 10.1101/gr.4.4.s177. [DOI] [PubMed] [Google Scholar]
- 15.van Gemen B, Kievits T, Schukkink R, van Strijp D, Malek L T, Sooknana R, Huisman H G, Lens P. J Virol Methods. 1993;43:177–188. doi: 10.1016/0166-0934(93)90075-3. [DOI] [PubMed] [Google Scholar]
- 16.van Gemen B, Kievits T, Nara P, Huisman H G, Jurriaans S, Goudsmit J, Lens P. AIDS. 1993;7:107–110. doi: 10.1097/00002030-199311002-00020. [DOI] [PubMed] [Google Scholar]
- 17.van Gemen B, van Beuningen R, Nabbe A, van Strijp D, Jurriaans S, Lens P, Kievits T. J Virol Methods. 1994;49:157–168. doi: 10.1016/0166-0934(94)90040-x. [DOI] [PubMed] [Google Scholar]
- 18.Ratner L, Haseltine W, Patarca R, Lavak K J, Starich B, et al. Nature (London) 1985;313:277–284. doi: 10.1038/313277a0. [DOI] [PubMed] [Google Scholar]
- 19.Boom R, Sol C J A, Salimans M M M, Jansen C L, Wertheim-van Dillen P M E, van der Noordaa J. J Clin Microbiol. 1990;28:495–503. doi: 10.1128/jcm.28.3.495-503.1990. [DOI] [PMC free article] [PubMed] [Google Scholar]
- 20.van der Vliet G M E, Schukkink R A F, van Gemen B, Schepers P, Klatser P R. J Gen Microbiol. 1993;139:2423–2429. doi: 10.1099/00221287-139-10-2423. [DOI] [PubMed] [Google Scholar]
- 21.Thompson N L. In: Topics in Fluorescence Spectroscopy. Lakowicz J R, editor. Vol. 1. New York: Plenum; 1991. pp. 337–378. [Google Scholar]
- 22.Eigen M, Rigler R. Proc Natl Acad Sci USA. 1994;91:5740–5747. doi: 10.1073/pnas.91.13.5740. [DOI] [PMC free article] [PubMed] [Google Scholar]
- 23.Rigler R. J Biotechnol. 1995;41:177–186. doi: 10.1016/0168-1656(95)00054-t. [DOI] [PubMed] [Google Scholar]
- 24.Kinjo M, Rigler R. Nucleic Acids Res. 1995;23:1795–1799. doi: 10.1093/nar/23.10.1795. [DOI] [PMC free article] [PubMed] [Google Scholar]
- 25.Rauer B, Neumann E, Widengren J, Rigler R. Biophys Chem. 1996;58:3–12. doi: 10.1016/0301-4622(95)00080-1. [DOI] [PubMed] [Google Scholar]
- 26.Schwille P, Oehlenschläger F, Walter N. Biochemistry. 1996;35:10182–10193. doi: 10.1021/bi960517g. [DOI] [PubMed] [Google Scholar]
- 27.Rigler R, Mets Ü, Widengren J, Kask P. Eur Biophys J. 1993;22:169–175. [Google Scholar]
- 28.Rigler R, Widengren J, Mets Ü. Fluorescence Spectroscopy. Berlin: Springer; 1992. pp. 13–21. [Google Scholar]
- 29.Qian H, Elson E L. Appl Optics. 1991;30:1185–1211. doi: 10.1364/AO.30.001185. [DOI] [PubMed] [Google Scholar]
- 30.Gebinoga M, Oehlenschläger F. Eur J Biochem. 1996;235:256–261. doi: 10.1111/j.1432-1033.1996.00256.x. [DOI] [PubMed] [Google Scholar]
- 31.Tiollais P, Pourcel C, Dejean A. Nature (London) 1985;317:489–495. doi: 10.1038/317489a0. [DOI] [PubMed] [Google Scholar]
- 32.Purcell R H. Proc Natl Acad Sci USA. 1994;91:2401–2406. doi: 10.1073/pnas.91.7.2401. [DOI] [PMC free article] [PubMed] [Google Scholar]