

Abstract
By means of optical pumping with laser light it is possible to enhance the nuclear spin polarization of gaseous xenon by four to five orders of magnitude. The enhanced polarization has allowed advances in nuclear magnetic resonance (NMR) spectroscopy and magnetic resonance imaging (MRI), including polarization transfer to molecules and imaging of lungs and other void spaces. A critical issue for such applications is the delivery of xenon to the sample while maintaining the polarization. Described herein is an efficient method for the introduction of laser-polarized xenon into systems of biological and medical interest for the purpose of obtaining highly enhanced NMR/MRI signals. Using this method, we have made the first observation of the time-resolved process of xenon penetrating the red blood cells in fresh human blood—the xenon residence time constant in the red blood cells was measured to be 20.4 ± 2 ms. The potential of certain biologically compatible solvents for delivery of laser-polarized xenon to tissues for NMR/MRI is discussed in light of their respective relaxation and partitioning properties.
Keywords: optical pumping, laser-polarized xenon
Optical pumping (OP) (1–3) is a mechanism for the transfer of angular momentum from circularly polarized light to electronic and nuclear spins. The accumulated angular momentum increases the nuclear spin polarization, thereby enhancing the signals in nuclear magnetic resonance (NMR) by up to five orders of magnitude. Magnetic resonance imaging (MRI) of optically polarized 129Xe and 3He in the gas phase has already found application in the imaging of the gas space in lungs (4–10) and other void spaces (11, 12) with encouraging results. Given the sensitivity of its NMR parameters to the local environment (13) and its safety for medical applications—it is a well-documented anesthetic (14)—xenon would also be an excellent local probe for the study of tissues in living organisms. A recent effort in this direction was demonstrated by xenon brain imaging following respiration of laser-polarized xenon (15). Furthermore, the combination of optically pumped xenon together with polarization transfer in solution (16) should make it possible to “light up” the NMR of in vivo metabolites.
One of the major challenges for medical applications using laser-polarized xenon is the efficient delivery of xenon to the blood and tissues while maintaining the large nonequilibrium spin polarization acquired during OP. The characteristic time (T1) for the decay of the 129Xe spin polarization in vivo has not been studied extensively, but it is expected to be short due to interactions with oxygen and other paramagnetic molecules present in living organisms. For example, the 129Xe T1 in blood has been measured to be 4.5 s in the erythrocytes and 10 s in plasma (17). Previous practice has involved the introduction of laser-polarized xenon into the organism through the respiratory system. Xenon dissolves in the blood through the lungs and is subsequently carried to all parts of the body via circulatory pathways.
In this report, we present a method for the local delivery of laser-polarized 129Xe to blood and tissue, and we report the observation of 129Xe NMR in human blood using this method. Our approach is to pre-dissolve laser-polarized 129Xe and then inject the resulting saturated xenon solution into the sample or organism of interest. Prior to the injection, the 129Xe polarization is maintained with a long T1 in the solution. We have studied the 129Xe T1 relaxation times in several solutions suitable for medical applications. This method has made it possible to observe the dynamics of xenon entering the human red blood cells (RBC) and to determine the time constant for this process. Finally, the suitability of different solutions as potential carriers for xenon delivery is discussed in view of possible medical applications.
MATERIALS AND METHODS
The OP apparatus has been described in previous publications (18, 19), and the experimental procedure is shown schematically in Fig. 1 illustrating the design of the shaker used in the dissolution stage for xenon mixing and delivery. The shaker has a small sidearm, which can be isolated from the main volume by a stopcock; the laser-polarized 129Xe is frozen at liquid nitrogen temperature in this sidearm in a magnetic field of approximately 50 mT provided by a small permanent magnet. The magnetic field is necessary in the freezing stage to avoid decay of xenon polarization (20, 21). The xenon is sublimated and then admitted to the solution. Because the total volume of the shaker is small, we can accumulate several atmospheres of xenon pressure in the shaker to increase the xenon concentration in the solution. Vigorous shaking is applied to help dissolve the xenon gas. The resulting xenon solution is extracted with a syringe through a high-pressure rubber septum and immediately injected into the NMR tube containing the sample. The loss of polarization during the injection procedure is not significant. In each of the experiments reported here, 4 × 10⁻⁴ mol of isotopically enriched 129Xe (80% 129Xe, EG&G Mound, Miamisburg, OH) was used.
Figure 1.
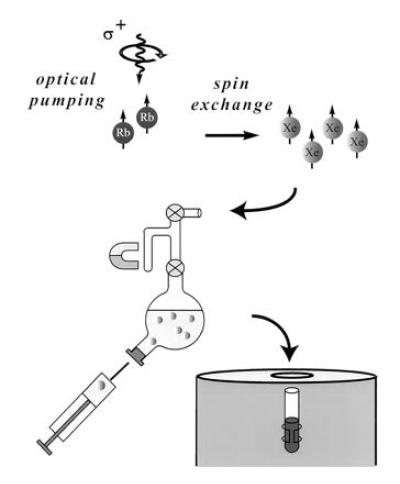
Schematic drawing of the major parts of the experimental setup including the shaker. The sidearm of the shaker is used to freeze the xenon, and the bulb of the shaker may contain 3 cc of solution. After dissolving the laser-polarized xenon, the solution is extracted through a high-pressure rubber septum into a syringe and injected into an NMR tube containing the sample.
The RBC samples were obtained by allowing the fresh blood to settle for a few hours and subsequently removing part of the plasma, about 30% of the total volume. In all experiments, a volume of 1 cc of laser-polarized xenon solution was injected into an RBC sample of 1 cc.
RESULTS AND DISCUSSION
The first solution investigated was saline (concentration 0.9% by weight) water, a system of established biological compatibility. The xenon solubility in saline water is low, with an Ostwald coefficient of 0.0926 (the standard temperature and pressure volume of xenon dissolved in 1 liter of liquid at 1 atmosphere of gas pressure; 1 atm = 101.3 kPa) (22); however, the xenon T1 is quite long (66 s at 9.4 T), due to dipolar couplings with the proton spins (the 129Xe T1 in saline D2O is ≈1000 s** at 9.4 T).
Fig. 2 shows two 129Xe NMR spectra in blood obtained (A) with extensive signal averaging using normal xenon and (B) with a single shot using laser-polarized xenon delivered by the injection method. The 129Xe NMR signal with a chemical shift of 216 ppm arises from intracellular xenon, whereas the signal with a chemical shift of 192 ppm is due to xenon in the saline/plasma mixture (17). The significant difference between the xenon chemical shift in the RBC and that in the saline/plasma is primarily due to the xenon binding to hemoglobin [the shift of xenon bound to hemoglobin is about 32 ppm higher than that of xenon in water (23)]. The dramatically increased sensitivity in the OP experiments allowed us to observe in real time the dynamics of the transfer of xenon to the RBC. A series of 129Xe NMR spectra was obtained as a function of time following the injection of the xenon/saline solution into the blood sample. Fig. 3 shows the normalized RBC and saline/plasma 129Xe signal intensities as a function of time after the injection. The initial rise of the RBC signal and decrease in the saline/plasma signal indicates the transfer of xenon from the saline/plasma water mixture to the RBC during the mixing. The time (t)-dependence of both signals during this mixing process is described by an exponential function of the form A+B(exp(−t/T)) (A and B are constants), and the time constant (T) for this function was estimated to be about 200 ms. After the mixing, the xenon signals in the RBC and the saline/plasma decay with a common time constant of T1 ≈ 5 s (Fig. 3 Inset). This result differs from that of previous measurements (17) in which T1 was reported to be different for xenon in RBC and in plasma.
Figure 2.
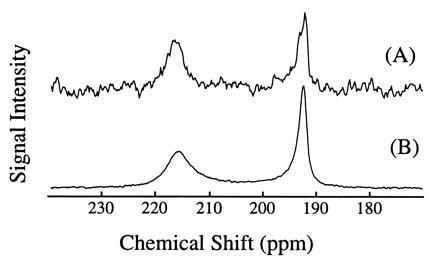
129Xe NMR spectra in fresh human blood. Spectrum A was obtained using normal xenon by accumulating 520 scans over 1.5 h (the xenon pressure is about 1 atmosphere). Spectrum B was acquired with one scan after injection of 1 cc of laser-polarized xenon/saline solution into 1 cc of RBC sample. The signal enhancement was estimated to be three orders of magnitude. The 129Xe NMR signal at a chemical shift of 216 ppm is characteristic of xenon in the RBC, and the signal at 192 ppm is of xenon in the saline/plasma mixture. NMR experiments were performed on a Bruker AM-400 spectrometer.
Figure 3.
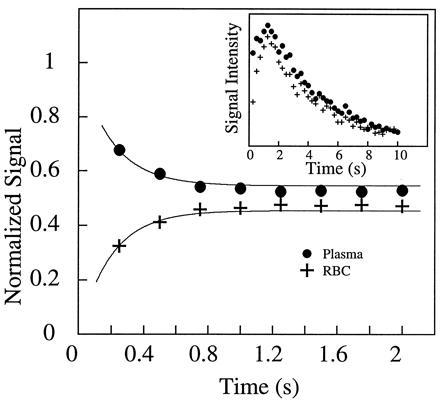
The mixing of xenon between the blood and the saline solution. By using short rf pulses of small tipping angle, 129Xe NMR spectra were acquired as a function of time after injection of the xenon/saline solution into the blood. The main figure shows the time dependence of the xenon signal in the RBC and in the saline/plasma, normalized by the total signal. Within the first second, the rise of the RBC signal and the reduction of the saline/plasma signal describe the dynamic process of xenon entering the RBC from the saline/plasma during mixing. From the exponential fits (shown as solid lines), the time scale for this process is estimated to be about 200 ms. (Inset) The time dependence of the integrated xenon signal from both peaks in the spectra. From the decay starting after 2 s, the T1 of the two components is found to be 5.0 s. The initial rise in the total xenon signal intensity during the first second, following the vigorous injection and mixing of the xenon/saline solution, is most likely caused by xenon-containing blood/saline mixture descending from the walls of the sample tube into the region of the detection coil. NMR experiments were performed on a Bruker AM-400 spectrometer.
Because the sample was unlikely to be intimately mixed and equilibrated at the start of the measurements, the data of Fig. 3 reflect primarily the mixing process between the RBC and the saline/plasma solution rather than the intrinsic exchange of xenon between the RBC and the plasma. The intrinsic xenon exchange rate can be measured in an equilibrated sample by selectively inverting the xenon saline/plasma NMR line and observing the recovery of the two signals. The selective inversion was achieved by an amplitude-modulated Gaussian pulse of 1 ms duration centered at the frequency of the saline/plasma signal. After the inversion pulse, xenon spectra were taken at fixed-time intervals using small tipping angle (20°) pulses. Following the injection of the xenon saline solution into the blood sample, a delay of 3 s before the inversion pulse ensured that the xenon blood system was well mixed and equilibrated. Fig. 4A shows the initial equilibrium spectrum obtained 13 ms before the inversion pulse and three of a series of spectra measured after the inversion pulse. The exchange of xenon from the RBC to the saline/plasma is indicated by the increase in amplitude of the saline/plasma signal and the corresponding reduction in that of the RBC signal. The time dependence of the signals, SRBCand Spl, is described by the following equations:
 |
1 |
 |
2 |
with
 |
3 |
where τRBC and τpl are residence time constants for xenon in the RBC and saline/plasma, and 1/τ = 1/τRBC + 1/τpl. S0RBC and S0pl are the initial signal intensities for the RBC and the plasma, respectively, immediately after the inversion pulse. The effect of the spin-lattice relaxation is neglected since τ << T1, making SRBC + Spl a constant during exchange. The difference of the two signals, ΔS = SRBC − Spl, is shown in Fig. 4B. From an exponential fit to ΔS, we have determined τ = 12.0 ± 1 ms, taking into account the reduction of the signals due to finite tipping angle. Given the constraint on τpl/τRBC from the ratio of the signals at equilibrium, we obtained τRBC = 20.4 ± 2 ms, τpl = 29.1 ± 2 ms. It is interesting to note that the time scale τRBC = 20.4 ms corresponds to the time for the diffusion of xenon over a distance of 11 μm (assuming a diffusion constant of 10−5 cm2/s), slightly larger than the characteristic dimension of the RBC. The xenon τRBC is longer than that for water molecules, which was measured to be 12 ± 2 ms at room temperature (for review, see ref. 24). The regulation of such exchange processes in living organisms is under further investigation.
Figure 4.
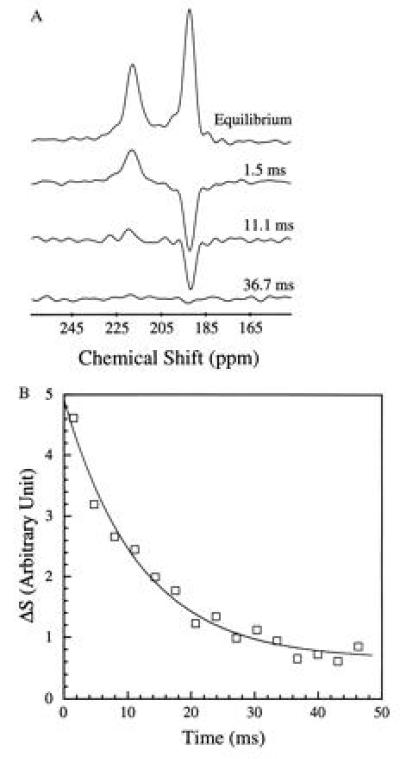
Intrinsic exchange of xenon between the two components of blood. Following an amplitude-modulated rf pulse, which selectively inverted the saline/plasma xenon signal, the recovery of the 129Xe spectrum to equilibrium was observed by using short rf pulses of small tipping angle. (A) Initial equilibrium spectrum and the time-dependent spectra following the selective inversion. The initial reduction of the RBC signal, and the rise of the saline/plasma signal, reflect the intrinsic dynamics of xenon exchanging between the plasma and the RBC. The time dependence of the signal intensities is shown in B. The time constant for the xenon exchange process is determined to be 12.0 ± 1 ms from the exponential fit shown as a solid line. The inversion exchange measurement was taken 3 s after the completion of the injection to ensure complete mixing and equilibration of the blood and the saline solution. The selective inversion pulse is 1 ms in duration with a frequency centered at the saline/plasma signal. Such a pulse also reduces the absolute signal intensities of the RBC and the plasma peaks by about 50%. A field-gradient pulse of 1 ms was applied after the inversion pulse to dephase any components of the transverse magnetization. The experiments were performed on a CMX Infinity spectrometer (Chemagnetics–Otsuka Electronics, Ft. Collins, CO) at a magnetic field of 4.3 T.
The observed occurrence of the fast exchange of xenon between blood components provides a natural explanation for the discrepancies in the T1 results compared with the previous report (17). Given the long-term settling (the separation of RBCs from plasma) in the earlier measurements using xenon without OP, the xenon residence time in the RBC and the saline/plasma increases to exceed the T1 of either component and, thus, the two xenon signals relax independently. In fresher blood, the intimate mixture between RBC and plasma allows the xenon residence time to decrease below T1, resulting in a common decay rate for both signals. The new T1 measurements with laser-polarized xenon should therefore be relevant to living organisms where the blood components are intimately mixed.
Saline water solution has the two-fold advantage of a long xenon spin-lattice relaxation time and of complete biological compatibility. However, solvents with higher xenon solubility would be more useful for the delivery of large amounts of laser-polarized xenon. Possible alternatives to saline water include lipid emulsions, fluorocarbon blood substitutes, isotonic buffers and other medically safe intravenous or oral media in which the xenon relaxation time is long. Intramuscular injection adjuvants (e.g. dimethyl sulfoxide, vitamin E, etc.) have a higher xenon solubility and therefore may also be effective xenon carriers. We have studied two specific systems which seem particularly promising for medical applications.
Intralipid solutions consist of aqueous suspensions of lipid vesicles of approximately 0.1 μm in diameter, which can be tolerated by the organism and used clinically as nutrient supplements. We have used a commercially available 20% Intralipid solution (Pharmacia), approved by the U.S. Food and Drug Administration, with a xenon solubility four times higher than that of water. The xenon T1 in this solution was measured to be 40 ± 3 s. The spectrum of the laser-polarized xenon delivered to blood in the Intralipid solution is shown in Fig. 5A. The peak at 194 ppm corresponds to the xenon in the pure Intralipid solution. Only a small signal is observed at the frequency corresponding to that of xenon in the RBC (216 ppm). The ratio of the two peaks is approximately 6:1, a result consistent with a higher affinity of the xenon for the lipids and a correspondingly inefficient transfer to the RBC. The T1 decay time of the signal at 194 ppm was measured to be 16 s, a factor three times larger than the corresponding decay time for xenon in the saline water/blood mixture. The 129Xe NMR signal was strong enough to directly image the xenon distribution in the mixture as shown in Fig. 5A (Inset). These results show that the Intralipid solution could be useful for the delivery of polarized xenon through the blood, where the xenon polarization would be protected from decaying in the RBC.
Figure 5.
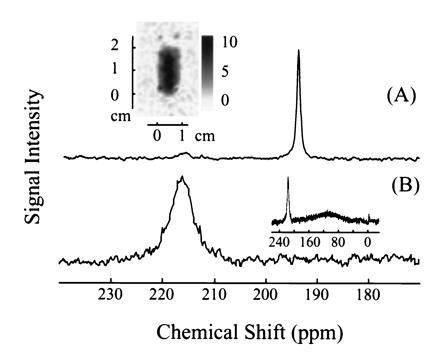
129Xe NMR spectra in fresh human blood obtained using laser-polarized 129Xe in A, 20% Intralipid solution and B, Fluosol. The 129Xe NMR signal at a chemical shift of 216 ppm is characteristic of xenon in the RBC, and the signal at 194 ppm is of xenon in the plasma/lipid mixture (A). (A Inset) A two-dimensional projection MRI image of 129Xe dissolved in the mixture of lipid and fresh human blood. The 128 pixel × 64 pixel image was obtained by the Echo Planar Imaging (26, 27) method on a Quest 4300 (Nalorac Cryogenics, Martinez, CA) spectrometer. The diameter of the sample tube was 1 cm, and the solution occupied a region of 2 cm in height. (B Inset) The broad peak centered around 110 ppm is due to xenon in Fluosol. NMR experiments, except the imaging experiment as mentioned above, were performed on a Bruker AM-400 spectrometer.
Perfluorocarbon compounds are of considerable interest as blood substitutes because they are chemically inert and non-toxic, and their emulsions can absorb and transport oxygen and carbon dioxide (25). For xenon delivery to blood we chose Fluosol (Green Cross, Osaka), a 20% intravascular perfluorochemical emulsion, approved by the U.S. Food and Drug Administration for human use as a blood substitute. Fig. 5B shows a 129Xe spectrum acquired after mixing the xenon/Fluosol solution with the blood sample. The peak at 216 ppm corresponds to the xenon in the RBC, whereas the broad peak centered around 110 ppm (Fig. 5B Inset) arises from xenon in the Fluosol solution. Xenon in pure Fluosol has a chemical shift of 110 ppm and broadening similar to that in the blood/Fluosol solution. The ratio of the integrated intensities of the broad and the narrower peak is about three. The T1 of the narrower peak was measured to be 13 ± 1 s, again longer than that of xenon in the blood plasma. Our results suggest that xenon exchanges between the RBC and an environment characterized by a much longer relaxation time, presumably the perfluorinated compounds. The use of Fluosol to carry laser-polarized xenon may therefore be advantageous for the selective NMR/MRI of xenon transferred to tissues.
CONCLUSIONS
The use of xenon solutions in combination with blood and tissue injection techniques for administering laser-polarized xenon is promising for MRI angiography and perfusion imaging, as well as in vivo localized NMR spectroscopy of xenon exchange phenomena. The local injection of laser-polarized xenon solutions can be performed rapidly, concentrating the xenon at a target area to investigate biophysical properties of normal and pathological tissues. These results could have applications for in vivo research using laser-polarized xenon.
Acknowledgments
We thank Tom Lawhead for his expert glassblowing and advice and Dr. William T. Elliott for his consultation and support in the matter of blood withdrawal and storage. We also thank Profs. David Wemmer and Charles Springer for their helpful comments and suggestions regarding the manuscript. Y.-Q.S. acknowledges a research fellowship from the Miller Institute for Basic Research in Science, and R.S. is grateful to the Swiss National Science Foundation for financial support. This work was supported by the Director, Office of Basic Sciences, Materials Sciences Division of the U.S. Department of Energy under Contract No. DE AC03-76SF00098.
Footnotes
Abbreviations: OP, optical pumping; RBC, red blood cell.
Since the experiments were performed in an NMR tube open to air, additional contributions to the decay of the signal may come from xenon escaping into the air and dissolution of oxygen into the solution. However, the upper limit of such contributions to 1/T1 must be less than 1/1000 s−1, which is the decay rate of 129Xe in saline D2O. Such mechanisms would not play a role when the solution is administered intravascularly or to tissues.
References
- 1.Kastler A. J Phys Radium. 1950;11:255–265. [Google Scholar]
- 2.Bouchiat M A, Carver T R, Varnum C M. Phys Rev Lett. 1960;5:373–375. [Google Scholar]
- 3.Happer W, Miron E, Schaefer S, Schreiber D, von Wijngaarden W A, Zeng X. Phys Rev A. 1984;29:3092–3110. [Google Scholar]
- 4.Albert M S, Cates G D, Driehuys B, Happer W, Saam B, Springer C S, Jr, Wishnia A. Nature (London) 1994;370:199–201. doi: 10.1038/370199a0. [DOI] [PubMed] [Google Scholar]
- 5.Middleton H, Black R D, Saam B, Cates G D, Cofer G P, Guenther R, Happer W, Hedlund L W, Johnson G A, Juvan K, Swartz J. Magn Reson Med. 1995;33:271–275. doi: 10.1002/mrm.1910330219. [DOI] [PubMed] [Google Scholar]
- 6.Leduc M, Otten E. La Recherche. 1996;287:41–43. [Google Scholar]
- 7.Sakai K, Bilek A M, Oteiza E, Walsworth R L, Balamore D, Jolesz F, Albert M S. J Magn Reson Ser B. 1996;111:300–304. doi: 10.1006/jmrb.1996.0098. [DOI] [PubMed] [Google Scholar]
- 8.Cates G D. Bull Am Phys Soc. 1996;41:687. [Google Scholar]
- 9.Wagshul M E, Button T M, Li H F, Liang Z, Springer C S, Zhong K, Wishnia A. Magn Reson Med. 1996;36:183–191. doi: 10.1002/mrm.1910360203. [DOI] [PubMed] [Google Scholar]
- 10.Bachert P, Schad L R, Bock M, Knopp M V, Ebert M, Großman T, Heil W, Hoffman D, Surkav R, Otten E W. Magn Reson Med. 1996;36:192–196. doi: 10.1002/mrm.1910360204. [DOI] [PubMed] [Google Scholar]
- 11.Song Y-Q, Gaede H C, Pietraß T, Barrall G A, Chingas G C, Ayers M R, Pines A. J Magn Reson Ser A. 1995;115:127–130. [Google Scholar]
- 12.Albert M S, Tseng C H, Williamson D, Oteiza E R. J Magn Reson Ser B. 1996;111:204–207. doi: 10.1006/jmrb.1996.0084. [DOI] [PubMed] [Google Scholar]
- 13.Raftery D, Chmelka B. NMR Basic Principles and Progress. Vol. 30. Berlin: Springer; 1994. pp. 111–158. [Google Scholar]
- 14.Kennedy R R, Stokes J W, Downing P. Anaesth Intensive Care. 1992;20:66–70. doi: 10.1177/0310057X9202000113. [DOI] [PubMed] [Google Scholar]
- 15.Swanson, S. D., Rosen, M., Coulter, K. P., Welsh, R. C. & Chupp, T. E. (1996), Magnetic Resonance Brain Imaging with Laser-Polarized 129Xe, preprint. [DOI] [PubMed]
- 16.Navon G, Song Y-Q, Rõõm T, Appelt S, Taylor R E, Pines A. Science. 1996;271:1848–1851. [Google Scholar]
- 17.Albert M S, Schepkin V D, Budinger T F. J Comput Assisted Tomogr. 1995;19:975–978. doi: 10.1097/00004728-199511000-00025. [DOI] [PubMed] [Google Scholar]
- 18.Raftery D, Long H, Meersmann T, Grandinetti P J, Reven L, Pines A. Phys Rev Lett. 1991;66:584–587. doi: 10.1103/PhysRevLett.66.584. [DOI] [PubMed] [Google Scholar]
- 19.Pietraß T, Gaede H C. Adv Mater. 1995;7:826–838. [Google Scholar]
- 20.Gatzke M, Cates G, Driehuys B, Fox D, Happer W, Saam B. Phys Rev Lett. 1993;70:690–693. doi: 10.1103/PhysRevLett.70.690. [DOI] [PubMed] [Google Scholar]
- 21.Ziegeweid M. Ph.D. thesis. Berkeley: Univ. of California; 1995. [Google Scholar]
- 22.Isbister W H, Schofield P F, Torrance H B. Phys Med Biol. 1965;10:243–250. doi: 10.1088/0031-9155/10/2/308. [DOI] [PubMed] [Google Scholar]
- 23.Tilton R F, Kuntz J I D. Biochemistry. 1982;21:6850–6857. doi: 10.1021/bi00269a035. [DOI] [PubMed] [Google Scholar]
- 24.Herbst M D, Goldstein J H. Am J Physiol. 1989;256:C1097–C1104. doi: 10.1152/ajpcell.1989.256.5.C1097. [DOI] [PubMed] [Google Scholar]
- 25.Beauregard D. Chem Ind (London) 1995;12:459–460. [Google Scholar]
- 26.Mansfield P, Pykett I L. J Magn Reson. 1978;29:355–373. doi: 10.1016/j.jmr.2011.09.020. [DOI] [PubMed] [Google Scholar]
- 27.Mansfield P. J Phys C. 1977;10:L55–L58. [Google Scholar]