Abstract
We established stable COS-7 cell lines overexpressing recombinant PTPMEG and an inactive mutant form in which the active site cysteine is mutated to serine (PTPMEGCS). We found that both endogenous and recombinant enzyme were primarily located in the membrane and cytoskeletal fractions of COS-7 cells. Endogenous PTPMEG accounts for only 1/3000th of the total tyrosine phosphatase activity in COS-7 cells and transfected cells expressed 2- to 7-fold higher levels of the enzyme. These levels of overexpression did not result in detectable changes in either total tyrosine phosphatase activity or the state of protein tyrosine phosphorylation as determined by immunoblotting of cell homogenates with anti-phosphotyrosine antibodies. Despite the low levels of activity for PTPMEG, we found that overexpressing cells grew slower and reached confluence at a lower density than vector transfected cells. Surprisingly, PTPMEGCS-transfected cells also reach confluence at a lower density than vector-transfected cells, although they grow to higher density than PTPMEG-transfected cells. Both constructs inhibited the ability of COS-7 cells to form colonies in soft agar, with the native PTPMEG having a greater effect (30-fold) than PTPMEGCS (10-fold). These results indicate that in COS-7 cells both PTPMEG and PTPMEGCS inhibit cell proliferation, reduce the saturation density, and block the ability of these cells to grow without adhering to a solid matrix.
Keywords: cell signaling, growth inhibition
We have cloned a cDNA encoding a protein tyrosine phosphatase (PTP) designated as PTPMEG that predicts a protein of 926 amino acids (1). PTPMEG contains several characteristic motifs outside the catalytic domain, including an amino-terminal 300 amino acid domain that is homologous to erythrocyte cytoskeleton protein 4.1 followed by two proline-rich sequences that have potential to bind to SH3 domains, two PEST sequences that predict rapid proteolysis, and a 100 amino acid motif designated as GLGF or DHR that is found in a variety of other proteins (2, 3). The catalytic domain is at the carboxyl terminus of the protein. We have identified endogenous PTPMEG in a cultured cell line, A172, and found that it is located in the membrane and cytoskeletal fractions of these cells. PTPMEG is phosphorylated on serine and threonine residues, which is of uncertain significance. The protein is also subject to proteolysis by trypsin and calpain in which cleavage results in activation of the enzyme both in vitro and in vivo (2). We now report studies of the effect of overexpression of PTPMEG on cell growth and transformation.
The consequences of overexpression of other tyrosine phosphatases in mammalian cells have been variable. Overexpression of a receptor tyrosine phosphatase PTPα in rat embryo fibroblasts results in cell transformation (4). Intracellular tyrosine phosphatases including PTP1B, its rat homolog PTP1, and TCPTP have been difficult to stably transfect into nontransformed cells, but they have been transfected into protein tyrosine kinase transformed cells (5–7). When cotransfected with the neu oncogene, PTP1B blocks its ability to transform NIH 3T3 fibroblasts and to form colonies in soft agar (5). Rat 2 fibroblasts transformed with v-fms transfected with full-length TCPTP remained transformed, whereas an activated truncated construct reversed the transformed phenotype (6). v-src transformed NIH 3T3 cells overexpressing PTP1 had reduced growth in soft agar (7). In this study, we find that overexpression of both native and an active site mutant form of PTPMEG in COS-7 cells inhibits cell proliferation, reduces the cell saturation density, and blocks the ability of these cells to form colonies in soft agar.
MATERIALS AND EXPERIMENTAL PROCEDURES
Immune-Complex PTP Assay.
Polyclonal antibodies directed against amino- and carboxyl-terminal peptides and full-length recombinant protein were prepared as described previously (2). They were used both for immunoblotting and for immune-complex PTP assay. Total cell lysates were prepared in 50 mM Tris·HCl (pH 7.5), 150 mM NaCl, 1% Triton X-100 or Nonidet P-40, 1 mM DTT, 1 mM EDTA, and protease inhibitors including 2 μg of aprotinin per ml, 0.5 μg of leupeptin per ml, 0.5 μg of pepstatin per ml, and 0.2 mM phenylmethylsulfonyl fluoride. Subcellular fractions were prepared as described below. Affinity-purified anti-amino-terminal peptide antibody (5 μg) was mixed with each sample, and, after immunoprecipitation, tyrosine phosphatase activity remaining in the immune-complex was measured using 20,000 cpm of [32PO4]Raytide substrate (1000 cpm/pmol) as described (2).
Subcellular Fractionation.
COS-7 cells stably transfected either with the native tyrosine phosphatase PTPMEG or with PTPMEGCS where the active site cysteine was mutated to serine were grown to confluence in 150-mm dishes. The cells were washed once with cold PBS and scraped into 2 ml of buffer containing 0.25 M sucrose, 1 mM EDTA, 5 mM Tris·HCl (pH 7.25), and protease inhibitors (as above). The cells were sonicated three times for 8 s at 100 W, and nuclei and unbroken cells were removed by centrifugation at 1000 × g for 5 min. The supernatant was then centrifuged at 100,000 × g for 30 min at 4°C to obtain the cytosolic fraction. The pellet was resuspended in 0.5 ml of 50 mM Tris·HCl (pH 7.5), 150 mM NaCl, 1 mM DTT, 1 mM EDTA, protease inhibitors (as above), and 1% Triton X-100. After stirring for 30 min, the pellet suspension was centrifuged at 100,000 × g for 30 min. The supernatant was collected as the soluble membrane fraction. The pellet that contains the cytoskeleton was extracted with 0.5 ml of buffer containing 50 mM Tris·HCl (pH 7.5), 1 mM DTT, 1 mM EDTA, 1% CHAPS, and 0.6 M KCl for 30 min. The extract was then centrifuged at 100,000 × g for 30 min. The supernatant was considered as soluble cytoskeletal fraction.
Overexpression of PTPMEG and PTPMEGCS.
Constructs encoding recombinant PTPMEG and PTPMEGCS were made as described previously (2). Stable cells lines expressing these constructs were obtained as follows. COS-7 cells (5 × 10⁵) in 60-mm dishes were transfected using pCEN-PTPMEG, or pCEN-PTPMEGCS and pCEN vector (10 μg each DNA) and Lipofectin (Life Technologies, Gaithersburg, MD) as described previously (2). The medium containing 1 mg of G418 per ml (GIBCO/BRL) was changed every 4 days, and single colonies were picked after 21 days. To examine PTPMEG expression, the selected colonies were grown to confluence in 12-well dishes and directly lysed in 100 μl 3% SDS containing 62 mM Tris (pH 6.8), 10% glycerol, and 1% 2-mercaptoethanol. Samples were separated on an SDS/8% PAGE and were transferred onto nitrocellulose membranes. The membranes were immunoblotted with 1:5000 rabbit antiserum against recombinant PTPMEG. The PTPMEG activities of total extract or cytosol, membrane, and cytoskeletal fractions were determined by immune-complex assay.
Growth Curves and Saturation Density.
Cell growth curves and saturation density studies were performed as described (8). COS-7 cells expressing different constructs were grown to 80% confluence, trypsinized, dispersed, and plated into 24-well plates using 1 ml of cells at 105 per ml, 5 × 10⁴ per ml, and 1 × 10⁴ per ml. The medium was changed every 2 to 3 days for 2 weeks. Cells were harvested with trypsin, dispersed, and counted with Coulter counter. The cell number at 20 hr after seeding was considered to be the starting cell number per well. Triplicate wells were counted for each time point of the growth curves. For the density limitation of growth study, 1 × 10⁵ cells were plated into 24-well plates containing a 13-mm diameter coverslip in each well (Nunc). After 24 hr, the coverslips were transferred to 10-cm bacteriological grade Petri dishes containing 20 ml medium. The cell number at that time was considered as the zero time point. The medium was changed every 2 days. All coverslips appeared to reach confluence by day 3. Starting at day 7, cells were trypsinized and counted as described above every 2 days. Three coverslips of each clone was used for each time point.
Soft Agar Assay.
Soft agar assays were carried out in 60-mm dishes in which there was 5 ml of 0.7% agarose (FMC) in the bottom of the dishes with 6 ml of 0.35% agarose containing the cells in the middle and a 5-ml layer of 0.7% agarose on the top. The medium used was 1× DMEM containing 10% FCS, 0.3% sodium bicarbonate, 50 units penicillin, and 50 μg of streptomycin per ml, 1 μg of Fungizone per ml, 50 units of nystatin per ml, and 10 μg of gentamicin per ml (GIBCO/BRL). COS-7 cells expressing different constructs were grown to 80% confluence, trypsinized, and dispersed. Cells of each clone (1 × 10⁵) were plated in duplicate. Cells were grown at 37°C for 28 days, and then the plates were stained with 3-(4,5-dimethylthiazol-2-yl)-2,5-diphenyltetrazolium bromide (MTT; Sigma) overnight and colonies were counted.
RESULTS
Overexpression of PTPMEG and PTPMEGCS.
We used COS-7 cells that have been transformed by simian virus 40 large tumor antigen to overexpress PTPMEG. In initial experiments, we determined that endogenous PTPMEG was contained in COS-7 cells as shown both by immunoblotting (data not shown) and by immune-complex PTP assay as measured with Raytide. PTPMEG accounted for only 1/3000th of the total PTP in homogenates of these cells (0.5 cpm/min per μg protein immunoprecipitated) versus total cell extract activity of 1600 cpm/min per μg protein. Clones of COS-7 cells overexpressing PTPMEG and PTPMEGCS were isolated as described in Materials and Experimental Procedures. Immunoblots showing the level of expression in several clones are shown in Fig. 1A. Endogenous PTPMEG from the host COS-7 cells is seen in immunoblots of vector-transfected cells. The level of antigen in extracts from PTPMEG-expressing cells was 3- to 7-fold above the endogenous level, whereas that from those expressing PTPMEGCS was 2- to 5-fold above the endogenous level as shown in Table 1. Comparable levels of overexpression of enzyme activity were also shown in the clones expressing PTPMEG (Fig. 1B and Table 1), but not in the clones expressing mutant PTPMEGCS. The endogenous PTPMEG activity is so low that the several fold overexpression of PTPMEG does not alter the total PTPase activity in these cells. In clone N30, the total PTPase activity is same as that in clone V2, and the PTPMEG activity accounts for only 0.5% of the total activity. Clones expressing PTPMEG (N25, N30, and N37), PTPMEGCS (M37, M71, and M73), and vector (V1, V2, and V6) were used for all subsequent experiments.
Figure 1.
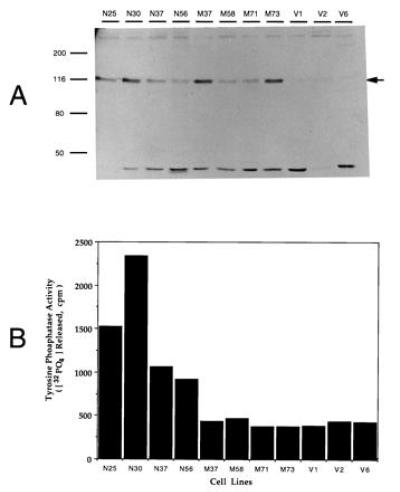
Overexpression of PTPMEG in COS-7 cells. (A) Immunoblot of PTPMEG in COS-7 cell clones. Sixty-four micrograms of 1% Triton extract from each clone was separated by SDS/8% PAGE, transferred to nitrocellulose, and blotted with anti- PTPMEG antiserum. (B) PTPMEG tyrosine phosphatase activity in overexpressing COS-7 cell clones. PTPMEG activity in 30 μg of the lysate was analyzed with the immunocomplex assay as described in experimental procedures. V, clones transfected by pCEN vector alone; N, clones transfected with PTPMEG; M, clones transfected with inactive PTPMEGCS.
Table 1.
PTPMEG and PTPMEGCS overexpression in COS-7 cells
| Clone no. | Immunoblot
|
PTPMEG
activity
|
||
|---|---|---|---|---|
| Densitometry, arbitrary units | Over- expression, fold | Activity, cpm/min per μg | Over- expression, fold | |
| N25 | 568.4 | 6.2 | 10.2 | 3.7 |
| N30 | 647.4 | 7.1 | 15.6 | 5.6 |
| N37 | 350.5 | 3.8 | 7.1 | 2.5 |
| N56 | 298.3 | 3.7 | 6.1 | 2.2 |
| M37 | 536.8 | 5.9 | 2.9 | 0 |
| M58 | 200.0 | 2.2 | 3.1 | 0 |
| M71 | 204.7 | 2.2 | 2.5 | 0 |
| M73 | 500.8 | 5.5 | 2.6 | 0 |
| V1 | 74.9 | 0 | 2.6 | 0 |
| V2 | 110.7 | 0 | 2.9 | 0 |
| V6 | 88.1 | 0 | 2.9 | 0 |
Expression of PTPMEG and PTPMEGCS was determined by immunoblotting and immune-complex assay as shown in Fig. 1. Protein expression was estimated by densitometry of protein bands using a Molecular Dynamics Image Scanner. The mean expression of endogenous PTPMEG in three vector clones was 91.22 arbitrary units and 2.8 cpm 32PO4 hydrolyzed per min/μg protein.
Each clone was fractionated into cytosol, soluble membrane, and soluble cytoskeleton fractions to confirm that the recombinant protein has a similar subcellular distribution of tyrosine phosphatase activity as endogenous PTPMEG as shown in Fig. 2. The overexpressed protein was mainly associated with membrane and cytoskeleton fractions. The mutant clones had less activity in cytosol than vector-transfected cells, perhaps resulting from displacement of the endogenous enzyme from some binding site in cytosol. Morphologically, the cells in the different clones appeared similar except for the finding of more multinucleated giant cells in native PTPMEG-overexpressing cells. The appearance of the cytoskeleton was examined by immunofluorescence microscopy using anti-actin (Sigma), anti-tubulin (Sigma), and anti-intermediate filament antibodies. We found no significant changes in the pattern of distribution of these antigens in any of the three types of cells (data not shown).
Figure 2.
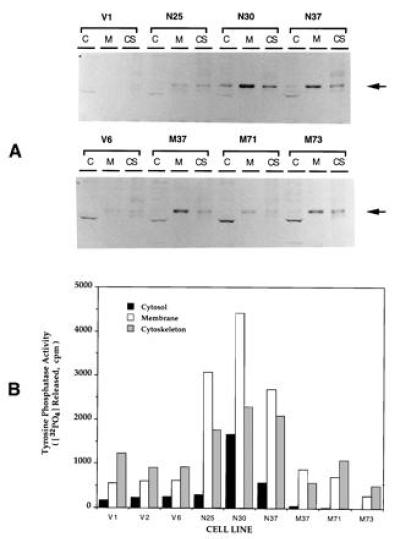
Subcellular distribution of overexpressed PTPMEG in COS-7 clones. (A) Immunoblot of COS-7 cells expressing various constructs. Cells were fractionated into soluble fraction (C), membrane fraction (M), and cytoskeletal fraction (CS) as described. (B) PTP activity of subcellular fractions of clones that are designated as described above. An equal amount of protein (45 μg) from the cytosol of each clone and an equivalent proportion from membrane and cytoskeletal fraction were used for immunoblot and for PTPMEG assay.
The total phosphotyrosine pattern of these clones was examined by immunoblotting with an anti-phosphotyrosine antibody (UBI). Extracts were prepared from cells growing in log phase, confluence, and at overconfluence. Extracts from each of these conditions were prepared from serum-deprived and serum-stimulated cells. The pattern of phosphotyrosine in both PTPMEG and PTPMEGCS appeared identical under all of these conditions (data not shown).
Effects of Overexpression of PTPMEG on Cell Growth in Monolayers.
Both PTPMEG- and PTPMEGCS-overexpressing clones were studied to determine effects on cell proliferation. The effect of PTPMEG on cell proliferation, in a growth curve study is shown in Fig. 3 and Table 2. The three clones overexpressing PTPMEG had an average population doubling time of 28.8 ± 2.4 hr and reached a plateau at a density of 2.7 ± 0.4 × 10⁵ cells per cm2. The three clones overexpressing mutant PTPMEGCS had a doubling time of 23.9 ± 1.5 hr and reached a plateau at a density of 5.3 ± 0.15 × 10⁵ cells per cm2. The two vector clones in this experiment had a doubling time of 23.7 hr and the cell density at the plateau was 5.6 × 10⁵ cells per cm2. The doubling time of the three native clones was statistically significantly different from that of mutant and vector clones as measured by a Student’s t test (t = 3.5; P < 0.05). The doubling time and density of cells at the plateau appeared similar comparing the mutant and vector clones in this assay. The differences in cell density at the plateau stage between native versus mutant or vector clones were also significant (P < 0.001). We also carried out a density limitation of growth study using these clones as described in Materials and Experimental Procedures to exclude that the different saturation densities observed were due to slow growth or exhaustion of the medium as shown in Fig. 4. Under these conditions, the vector cells grew to a higher density (7.7 ± 1.2 × 10⁵ cells per cm2), thus increasing the difference between these cells and those expressing native (3.2 ± 0.7 × 10⁵ cells per cm2) and mutant PTPMEG (5.3 ± 0.5 × 10⁵ cells per cm2). The differences in saturation cell density were statistically significant in all three pairwise comparisons. These experiments suggest that overexpression of PTPMEG reduces the rate of cell proliferation and, surprisingly, that both PTPMEG and PTPMEGCS reduce the saturation density, the former more than the latter.
Figure 3.
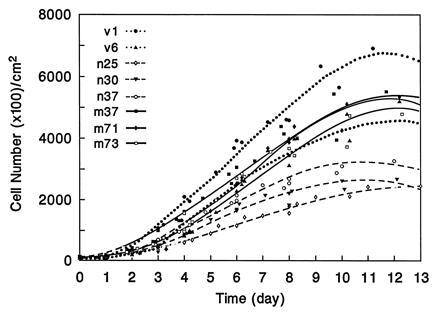
Growth curves of COS-7 stable clones. Two clones transfected with pCEN vector (V1 and V6), three clones overexpressing PTPMEG (N25, N30, and N37), and three clones overexpressing PTPMEGCS (M37, M71, and M73) were used in this experiment.
Table 2.
The growth parameters of the PTPMEG and PTPMEGCS stable clones
| Clone no. | PDT, hr | Cell density in plateau stage, ×105 per cm2 | Saturation cell density, ×105 per cm2 | Colonies in soft agar
|
|
|---|---|---|---|---|---|
| Number* | Size | ||||
| V1 | 21.6 (r = 0.98) | 6.84 ± 0.379 | 8.07 ± 0.619 | 6,774 ± 162 | Medium |
| V2 | ND | ND | 8.72 ± 1.092 | 13,836 ± 756 | Large and medium |
| V6 | 25.7 (r = 0.98) | 4.74 ± 0.063 | 6.41 ± 0.411 | 4,974 ± 270 | Medium |
| N25 | 31.6 (r = 0.99) | 2.42 ± 0.045 | 2.78 ± 0.160 | 360 ± 60 | Small |
| N30 | 27.5 (r = 0.98) | 2.63 ± 0.028 | 2.88 ± 0.393 | 198 ± 42 | Small |
| N37 | 27.4 (r = 0.98) | 3.22 ± 0.089 | 4.06 ± 0.344 | 204 ± 36 | Small |
| M37 | 24.0 (r = 0.97) | 5.45 ± 0.148 | 5.82 ± 0.488 | 384 ± 48 | Small |
| M71 | 24.0 (r = 0.97) | 5.29 ± 0.221 | 4.85 ± 0.154 | 390 ± 30 | Small |
| M73 | 23.7 (r = 0.99) | 5.14 ± 0.108 | 5.24 ± 0.466 | 1,824 ± 72 | Medium |
Colonies in soft agar were counted directly using an inverted microscope. The population doubling time (PDT) was measured by least mean square analysis of the cells during log phase growth. The cell density at plateau is determined using the cell number on the last day of the growth curve. The saturation density is the mean of the last three values. All points are the mean of triplicates ± SD. ND, not determined.
Colony number per 60-mm dish.
Figure 4.
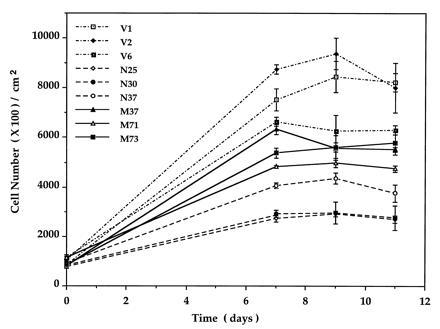
Saturation cell density of COS-7 stable clones. Three clones transfected with pCEN vector (V1, V2, and V6), three clones overexpressing PTPMEG (N25, N30, and N37), and three clones overexpressing inactive PTPMEGCS (M37, M71, and M73) were used in this experiment.
Effects of Overexpression of PTPMEG on Colony Formation in Soft Agar.
We further tested the growth properties of these clones by measuring the ability of cells to form colonies in a soft agar assay. COS-7 cells are transformed by simian virus 40 large tumor antigen and thus are able to form colonies in this assay. There were striking differences observed in this experiment both in the number and size of colonies formed as shown in Fig. 5A and Table 2. The three control vector clones formed 30 times more colonies than PTPMEG-overexpressing clones, and the colonies were much larger as seen in Fig. 5B. The colonies formed in PTPMEG-expressing cells were very small as shown in Fig. 5B. Two of three PTPMEGCS-overexpressing clones tested also produced a reduced number of small colonies, but clone M73 grew an intermediate number of medium-size colonies. These experiments indicate that expression of active PTPMEG inhibits the ability of COS-7 cells to grow without adhering to a solid matrix, a property of transformed cells. The findings observed with the mutant clones are difficult to explain. Clearly, expression of PTPMEGCS reduced the ability of cells to grow in agar. Possibly the expression of this protein releases endogenous PTPMEG from some inhibited state (? binding to an inhibitor), thereby achieving a functional overexpression of endogenous enzyme.
Figure 5.
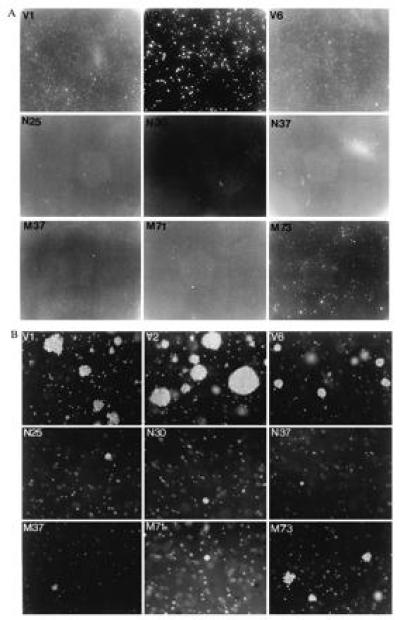
The effect of PTPMEG and PTPMEGCS on the growth of COS-7 cells in soft agar. (A) Plates seeded with clones expressing vector in the top row, native PTPMEG in the middle, and inactive mutant PTPMEGCS in the bottom. (×1.) (B) Representative fields of the same plates. (×20.) The number of colonies on each 60-mm plate is listed in Table 2.
DISCUSSION
So far, five PTPs that share homologous 4.1 domains have been identified. They are PTPMEG (1), PTPH1 (9), PTPBAS (10), PTP1D (11), and PTPPEZ (12). The functions of this family of PTPs are largely unknown. Rat PTPH1 mRNA expression is found restricted to the dorsal thalamus during development and to the thalamic nuclei in adults (13). PTPBAS associates with the membrane receptor Fas and partially blocks the Fas-induced apoptosis in a T cell line (14). Although PTPMEG was first cloned from a megakaryocyte cDNA library, the transcript has been found in most cells and is most abundant in brain and skeletal muscle (data not shown). Some properties of PTPMEG have been elucidated (2), but its function in vivo is unknown. PTPMEG is expressed at very low levels in COS-7 cells, accounting for only 0.03% of the total cellular PTP activity. The overexpressing clones that we obtained had modest overexpression even in PTPMEGCS clones that lack PTP activity. It seems likely that overexpression of this enzyme, even when inactive, is toxic to cells.
Our findings differ from previous reports in two respects. First, COS-7 cells are transformed by simian virus 40 large tumor antigen rather than by protein tyrosine kinases as used in previous studies. Second, the overexpression of PTPMEG does not alter the total PTP activity, as in other reports (5, 7).
Despite the low level of overexpression and the lack of any obvious affect on cellular protein tyrosine phosphorylation, we found striking effects of overexpression on cell growth, the density of cells at confluence, and the ability of cells to form colonies in soft agar. Overexpressing cells grow more slowly and reach confluence at a lower density than cells transfected with vector. Most of the members of the protein 4.1-domain-containing protein family have been immunolocalized to cell–cell adhesion junctions, focal adhesion plaques, or cell–cell contact regions (15–20). Furthermore, DHR-domain-containing proteins are also found mainly associated with cell–cell junctions and may play a role in organization of membrane proteins at special membrane sites such as synaptic junctions (3, 21–25). Together with its unique structure and the effects that have been observed in the current study, PTPMEG is likely to be involved in the organization of cell–cell contacts or in intercellular communication. Surprisingly, the inactive mutant construct PTPMEGCS also reduces the cell density at confluence to an intermediate degree. Both PTPMEG and PTPMEGCS inhibited the formation of colonies in soft agar. There are multiple domains outside the catalytic region of the molecule, that may play a role in its function. Therefore, the loss of phosphatase activity may not block some other function. Interestingly, the tumor suppressor gene found in neurofibromatosis 2 contains a protein 4.1 homology domain without any known enzymatic domain (26). Since COS-7 cells express endogenous PTPMEG, overexpression of the mutant enzyme may allow for the overactivity of the endogenous enzyme by releasing it from an inhibitor. That small changes in activity of a minor PTP can have profound effects on cell physiology underscores the concept that PTPs serve discrete functions dictated by structures outside the catalytic domain.
Acknowledgments
We thank J. Evan Sadler and Monita P. Wilson for the critical review and comments, and Ann Delaney for assistance in the preparation of the manuscript. This research was supported by National Institutes of Health Grants HL 14147 (Specialized Center for Research in Thrombosis), HL 16634, and HL 07088.
Footnotes
Abbreviation: PTP, protein tyrosine phosphatase.
References
- 1.Gu M, York J D, Warshawsky I, Majerus P W. Proc Natl Acad Sci USA. 1991;88:5867–5871. doi: 10.1073/pnas.88.13.5867. [DOI] [PMC free article] [PubMed] [Google Scholar]
- 2.Gu M, Majerus P W. J Biol Chem. 1996;271:27751–27759. doi: 10.1074/jbc.271.44.27751. [DOI] [PubMed] [Google Scholar]
- 3.Ponting C P, Phillips C. Trends Biochem Sci. 1995;20:102–103. doi: 10.1016/s0968-0004(00)88973-2. [DOI] [PubMed] [Google Scholar]
- 4.Zheng X M, Wang Y, Pallen C J. Nature (London) 1992;359:336–339. doi: 10.1038/359336a0. [DOI] [PubMed] [Google Scholar]
- 5.Brown-Shimer S, Johnson K A, Hill D E, Bruskin A M. Cancer Res. 1992;52:478–482. [PubMed] [Google Scholar]
- 6.Zander N F, Cool D E, Diltz C D, Rohrschneider L R, Krebs E G, Fischer E H. Oncogene. 1993;8:1175–1182. [PubMed] [Google Scholar]
- 7.Woodford-Thomas T A, Rhodes J D, Dixon J E. J Cell Biol. 1992;117:401–414. doi: 10.1083/jcb.117.2.401. [DOI] [PMC free article] [PubMed] [Google Scholar]
- 8.Freshney R I. Culture of Animal Cells: A Manual of Basic Technique. 3rd Ed. New York: Wiley–Liss; 1994. [Google Scholar]
- 9.Yang Q, Tonks N K. Proc Natl Acad Sci USA. 1991;88:5849–5953. doi: 10.1073/pnas.88.14.5949. [DOI] [PMC free article] [PubMed] [Google Scholar]
- 10.Maekawa K, Imagawa N, Magamatsu M, Harada S. FEBS Lett. 1993;337:200–206. doi: 10.1016/0014-5793(94)80273-4. [DOI] [PubMed] [Google Scholar]
- 11.Moller N P H, Moller K B, Lammers R, Kharitonenkov A, Sures I, Ullrich A. Proc Natl Acad Sci USA. 1994;91:7477–7481. doi: 10.1073/pnas.91.16.7477. [DOI] [PMC free article] [PubMed] [Google Scholar]
- 12.Smith A L, Mitchell P J, Shipley J, Gusterson B A, Rogers M V, Crompton M R. Biochem Biophys Res Commun. 1995;209:958–965. doi: 10.1006/bbrc.1995.1591. [DOI] [PubMed] [Google Scholar]
- 13.Sahin M, Slaugenhaupt S A, Gusella J F, Hockfield S. Proc Natl Acad Sci USA. 1995;92:7859–7863. doi: 10.1073/pnas.92.17.7859. [DOI] [PMC free article] [PubMed] [Google Scholar]
- 14.Sato T, Irie S, Kitada S, Reed J C. Science. 1995;268:411–414. doi: 10.1126/science.7536343. [DOI] [PubMed] [Google Scholar]
- 15.Tang T K, Qin Z, Leto T, Marchesi V T, Benz E J. J Cell Biol. 1990;110:617–624. doi: 10.1083/jcb.110.3.617. [DOI] [PMC free article] [PubMed] [Google Scholar]
- 16.Fehon R G, Dawson I A, Artavanis-Tsakonas S. Development (Cambridge, UK) 1994;120:545–557. doi: 10.1242/dev.120.3.545. [DOI] [PubMed] [Google Scholar]
- 17.Lue R A, Marfatia S M, Branton D, Chishti A H. Proc Natl Acad Sci USA. 1994;91:9818–9822. doi: 10.1073/pnas.91.21.9818. [DOI] [PMC free article] [PubMed] [Google Scholar]
- 18.Burridge K, Connell L. J Cell Biol. 1983;97:359–367. doi: 10.1083/jcb.97.2.359. [DOI] [PMC free article] [PubMed] [Google Scholar]
- 19.Burn P, Kupfer A, Singer S J. Proc Natl Acad Sci USA. 1988;85:497–501. doi: 10.1073/pnas.85.2.497. [DOI] [PMC free article] [PubMed] [Google Scholar]
- 20.Sato N, Funayama N, Nagafuchi A, Yonemura S, Tsukita S, Tsukita S. J Cell Sci. 1992;103:131–143. doi: 10.1242/jcs.103.1.131. [DOI] [PubMed] [Google Scholar]
- 21.Kornau H-C, Schenker L T, Kennedy M B, Seeburg P H. Science. 1995;269:1737–1740. doi: 10.1126/science.7569905. [DOI] [PubMed] [Google Scholar]
- 22.Brenman J E, Chao D S, Xia H, Aldape K, Bredt D S. Cell. 1995;82:743–752. doi: 10.1016/0092-8674(95)90471-9. [DOI] [PubMed] [Google Scholar]
- 23.Brenman J E, Chao D S, Gee S H, McGee A W, Craven S E, Santillano D R, Wu Z, Huang F, Xia H, Peter M F, Froehner S C, Bredt D S. Cell. 1996;84:757–767. doi: 10.1016/s0092-8674(00)81053-3. [DOI] [PubMed] [Google Scholar]
- 24.Kim E, Niethammer M, Rothschild A, Jan Y N, Sheng M. Nature (London) 1995;378:85–88. doi: 10.1038/378085a0. [DOI] [PubMed] [Google Scholar]
- 25.Gomperts S N. Cell. 1996;84:659–662. doi: 10.1016/s0092-8674(00)81043-0. [DOI] [PubMed] [Google Scholar]
- 26.Trofatter J A, MacCollin M M, Rutter J L, Murrell J R, Duyao M P, et al. Cell. 1993;72:791–800. doi: 10.1016/0092-8674(93)90406-g. [DOI] [PubMed] [Google Scholar]


