

Abstract
2C is a typical alloreactive cytotoxic T lymphocyte clone that recognizes two different ligands. These ligands are adducts of the allo-major histocompatibility complex (MHC) molecule H-2Ld and an endogenous octapeptide, and of the self-MHC molecule H-2Kb and another peptide. MHC-binding and T-cell assays with synthetic peptides in combination with molecular modeling studies were employed to analyze the structural basis for this crossreactivity. The molecular surfaces of the two complexes differ greatly in densities and distributions of positive and negative charges. However, modifications of the peptides that increase similarity decrease the capacities of the resulting MHC peptide complexes to induce T-cell responses. Moreover, the roles of the peptides in ligand recognition are different for self- and allo-MHC-restricted T-cell responses. The self-MHC-restricted T-cell responses were finely tuned to recognition of the peptide. The allo-MHC-restricted responses, on the other hand, largely ignore modifications of the peptide. The results strongly suggest that adaptation of the T-cell receptor to the different ligand structures, rather than molecular mimicry by the ligands, is the basis for the crossreactivity of 2C. This conclusion has important implications for T-cell immunology and for the understanding of immunological disorders.
Keywords: allo-major histocompatibility complex, ligand binding, molecular modeling, receptor, T cell
The existence of allo-major histocompatibility complex (MHC)-specific T cells in immunocompetent animals that have never encountered the allo antigen before is one of the old unresolved mysteries of immunology (1, 2). If the formation of the T-cell receptor (TCR) repertoire, i.e., the sum of all T-cell specificities of an individual, is controlled by that individual’s own MHC type (3–6), how then can the strong allo-MHC-specific reactivity found regularly in all individuals be rationalized? The most popular explanation for this phenomenon is that the complex of the allo-MHC molecule with one peptide resembles a complex of a self-MHC molecule plus another peptide (2). This model implies that the two complexes share structural features that make them look alike. Hence, alloreactivity would be a case of molecular mimicry by the different MHC peptide complexes.
2C (7) is a murine cytotoxic T lymphocyte clone, which was isolated from a BALB.B mouse (MHC haplotype: H-2b) that had been injected with cells from a DBA/2 mouse (MHC haplotype: H-2d). It recognizes the MHC class I molecule H-2Ld together with the naturally occurring endogenous peptide LSPFPFDL (8). H-2Kb was suspected to be the self-MHC counterpart because it controls positive selection of the 2C TCR specificity in the thymus (4). In fact, we were able to determine an epitope, SIYRYYGL, that is recognized together with H-2Kb by the 2C TCR (9). Both peptides are very different at the sequence level and so are the two MHC molecules (10, 11). To determine the molecular basis for the observed cross-recognition of the two ligands by one single receptor, MHC binding and T-cell response experiments with synthetic analogues of the two cognate peptides were combined with molecular modeling studies. Because the peptide constitutes an integral part of the protein structure (12, 13) this approach is equivalent to mutagenesis studies of the MHC in the vicinity of the peptide-binding groove but allows a much larger set of analogues to be tested. Models for the two MHC peptide complexes were generated, whose peptide conformations were in agreement with the binding experiments. In addition, the effects of conformational changes of the peptide main chains and side chains on the characteristics of the molecular surfaces were investigated and additional structures were generated for each complex that partially violated the experimental constraints to explore the conformational space available to exposed residues. The combination of the experimental and the modeling results allowed for the determination of the particular requirements for self- versus allo-restricted antigen recognition.
MATERIALS AND METHODS
Cell Culture.
The transporter-deficient thymoma cell line RMA-S and its parental RMA cell line (14) were used for stabilization and cytotoxicity assays. RLd-E2.1 is a subline of RLd-E2, which is a derivative of RMA-S transfected with the H-2Ld-gene (8). The cell line B2 was obtained from the mouse myeloma cell line Sp2/0 by transfection with the H-2Ld gene (8). The cells were maintained at 37°C in a humidified atmosphere with 8% CO2 in DMEM supplemented with heat inactivated fetal calf serum (5%), 100 units/ml penicillin, 100 μg/ml streptomycin, 2 mM glutamine, 5 mM Hepes, and 30 μM mercaptoethanol. In addition, the medium for RLd-E2 and B2 contained Geneticin (200 μg/ml). The cytotoxic T lymphocyte clone 2C (7) was a generous gift from H. N. Eisen (Massachusetts Institute of Technology). 2C cells were maintained by biweekly stimulations with irradiated P815 cells (H-2d) in supplemented DMEM medium, containing 2–4% rat ConA supernatant.
Stabilization Assay.
Stabilization assays (15, 16) for H-2Kb were carried out with RMA-S cells, those for H-2Ld with the cell line RLd-E2.1. The protocol was as described elsewhere (16). The monoclonal antibodies B8.24.3 (17) and 30-5-7S (18), which recognize the native conformation of the MHC molecules, were used for H-2Kb and H-2Ld, respectively. The levels of cell surface expression of the MHC molecules were measured with a FACScan (Becton Dickinson). After transformation of the raw data to linear mean fluorescence intensities (MFI) using the MFI software (E. Martz, University of Massachusetts, Amherst), the peptide concentrations required for half-maximal stabilization were calculated by employing formalisms of the occupancy concepts (16) and linear regressions over plots with logit(p) = ln[p/(1 − p)] versus log[peptide concentration] with p = (MFIexp − MFImin)/(MFImax − MFImin). Results are expressed as the negative logarithm of the concentration required for half-maximal stabilization [M]. All peptides were tested in duplicates and in two to three independent experiments.
Cytotoxicity Assay.
The 51Cr release assay was employed to measure cytolysis of targets cells by the T-cell clone 2C. The target cell line RMA was used for the H-2Kb-dependent reaction and B2 for the H-2Ld-dependent lysis. Cytotoxicity assays were conducted 4–6 days after stimulation. Target cells were labeled with 51Cr, washed, and incubated in DMEM containing BSA (0.5%) with serial dilutions of peptides for 30 min at 37°C in U-bottom microtiter plates. After addition of 2C cells to an effector-to-target ratio of 5:1 and further incubation at 37°C for 5 hr the 51Cr released from the cells was measured with a γ counter. Percent specific lysis was calculated as (experimental release − spontaneous release)/(total release − spontaneous release) × 100.
Molecular Modeling: General Procedures.
Except for the calculation and visualization of electrostatic potentials, the Biosym Molecular Modeling package (Insight II, Biopolymer, Discover, Homology, Analysis, Decipher) was used for molecular modeling (Biosym Technologies, San Diego). The former was done with grasp (19). Central processing unit time-intensive protocols were carried out on a Cray C90 supercomputer at the Computer Centre, University of Stuttgart; all other calculations and visualizations on a Silicon Graphics Iris Indigo Workstation (Silicon Graphics, Mountainview, CA). The consistent-valence forcefield (20) was applied for all simulations. Harmonic potentials and no-cross terms were chosen, if not indicated otherwise. For calculations in vacuo, a distance-dependent dielectric function was included. The time step was 1 fs. To avoid discontinuities in the calculation of electrostatic interactions the cut-off distance was set to 12 Å and the cut distance to 10 Å. Hydrogen atoms were added according to a pH of 7. Glutamic acids, aspartic acids, lysines, and arginines were modeled with charged side chains; histidine was neutral with the hydrogen at Nɛ. The termini were charged. Molecular surfaces were generated with a probe of 1.4-Å radius. The structures that corresponded best with the experimental results from the stabilization assays were relaxed by molecular dynamic simulations in an 8-Å water shell over 40 ps, preceded by a 10 ps molecular dynamic simulation on the water shell alone (yellow/brown structures in Figs. 3 and 4). The simulations took about 20 hr of Cray central processing unit time each. In contrast to earlier protocols (21), the α3- and β2-microglobulin domains were not removed. However, only the α1- and α2-domains were solvated and free to move. To generate a smooth transition to the fixed rest of the protein, side chains of the α3- and β2-microglobulin domains forming the interface to α1 and α2 were flexible as well.
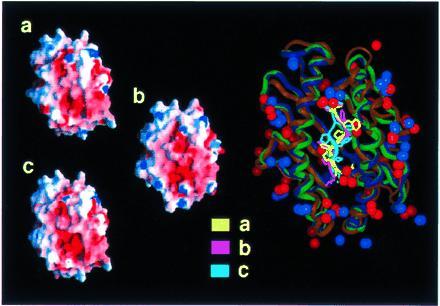
Figure 3.

Electrostatic potential at the surface of three alternative models for SIYRYYGL/H-2Kb (a–c, Left). The large picture on the right is a superposition of the backbone geometries. Positions of charged groups and conformations of the peptides of the three structures are displayed. The orientation is identical to the representation of the electrostatic potential, with the N terminus of the peptide pointing down. The backbones of the peptide conformations are displayed in bright colors, the backbones of the MHC conformations in dull colors (yellow/brown, pink/dark blue, cyan/green are used for the peptide MHC backbone corresponding to the representations a, b, and c, respectively). Charged groups of lysine and arginine are represented by blue, those of glutamic acid and aspartic acid by red spheres. Positive and negative electrostatic potentials are displayed in blue and red, respectively.
Figure 4.
Electrostatic potential at the surface of three alternative models for LSPFPFDL/H-2Ld (for details see Fig. 3).
Generation of a Starting Structure from the Crystallographic Coordinates of H-2Kb.
The structure of the MHC H-2Kb in complex with the octapeptide RGYVYQGL from the vesicular stomatitis virus was obtained from the Brookhaven Protein Databank (22, 23). The structure with all water molecules was intensively relaxed to the consistent valence forcefield over 3300 steps to a final root-mean-square (rms) derivative of 0.065. During the last 2000 steps cross-terms and Morse potentials were used. The rms deviation of the MHC and β2-microglobulin to the starting structure was 1.13 Å for backbone atoms only, and 1.35 Å for heavy atoms. This structure served as the starting geometry for the generation of the H-2Kb/SIYRYYGL and the H-2Ld/LSPFPFDL complexes. All minimizations started with a minimization of the peptide alone, followed by a minimization of the residues of the peptide binding pocket [all residues with an atom within 4 Å from the peptide (residues 5, 7, 9, 22, 24, 33, 45, 59, 63, 66, 70, 73, 74, 77, 80, 81, 84, 95, 97, 99, 114, 116, 123, 124, 143, 146, 150, 152, 155, 156, 159, 163, 167, and 171)]. Only then was the whole MHC free to move. During simulated annealing (24) only these residues, water molecules within the binding pocket, and the peptide were allowed to move.
Generation of Three Alternative Structures for H-2Kb in Complex with SIYRYYGL.
The peptide of the relaxed model for the crystal structure of RGYVYQGL/H-2Kb was mutated to SIYRYYGL. Except for isoleucine-2 and tyrosine-6, the side-chain geometries were retained. Two of the seven water molecules that were buried in the peptide binding cleft of the crystal structure were removed to avoid steric interference with isoleucine-2. This assumption was later confirmed by the crystal structure of SIINFEKL/H-2Kb (25). All other water molecules that were within 7 Å from the peptide were removed as well. One structure (see Fig. 3, structure a) was generated by minimization, followed by a molecular dynamic simulation in water. Two more structures were obtained by using simulated annealing protocols with heating to 1000 K (26). Because of the integrity of the MHC molecule (α3- and β2-microglobulins were left in place) no structural artefacts at the α2/α3-transition were observed (data not shown).
Generation of Three Alternative Structures for H-2Ld in Complex with LSPFPFDL.
The peptide and all water molecules were removed from the minimized crystal structure of the RGYVYQGL/H-2Kb complex (11). The amino acids of the MHC heavy chain were replaced according to the sequence of H-2Ld published by Moore et al. (11) with the following exceptions: threonylalanine was taken instead of threonine at positions 10 and 11, proline instead of arginine at position 15, glutamine instead of arginine at position 48, alanine instead of phenylalanine at position 135, and alanylalanine instead of serylserine at positions 158 and 159 (numbering according to H-2Kb). The geometry of the side chains was first corrected manually to remove severe steric conflicts, followed by simulated annealing for replaced residues only. For Fig. 3 (structure a), the peptide was fit into the binding pocket by a multi-step procedure employing simulated annealing protocols with constraints, which were deduced from the peptide binding experiments until optimal accordance with the experimental results was achieved. To minimize the divergence of the MHC and β2-microglobulin from the starting backbone geometry the backbone was kept fixed except for the very last minimizations of the multi-step protocols. The rms deviation from the starting structure was 1.24 Å (backbone atoms). Two more structures (Fig. 3, structures b and c) were generated without experimental constraints to explore different regions of the conformational space.
RESULTS
The cytotoxic T-cell clone 2C recognizes the syngeneic MHC allomorph H-2Kb in complex with the peptide SIYRYYGL und the allogeneic MHC allomorph H-2Ld in complex with the peptide LSPFPFDL. The two peptides differ greatly in sequence, particularly in type and positions of charged residues. A comparison of the distribution of exposed charged residues on the surfaces of the MHC molecules based on the H-2Kb crystal structure (11) revealed five prominent differences in the vicinity of the peptide binding pocket: lysine to isoleucine at position 66, aspartic acid to asparagine at position 77, glutamic acid to alanine at position 152, arginine to tyrosine at position 155, and threonine to glutamic acid at position 163 (residues in H-2Kb are given first). These differences add up to an excess in positive charge on the surface of the H-2Kb, which is further enhanced by arginine at position 4 of the H-2Kb bound peptide and aspartic acid at position 7 of the H-2Ld bound peptide. These comparisons were concentrated on exposed charged amino acid side chains, because mismatches of charges or unsaturated salt bridges in receptor ligand combinations provoke the highest energetic penalties and therefore have the strongest effects on ligand receptor interactions (26, 27).
The question arose as to whether the differences in charges on the primary sequence level of the peptides and the MHC allomorphs could compensate each other locally in the quaternary structure, thus generating similar molecular surfaces with respect to charge distribution. To address this question one set of peptides for each of the two MHC allomorphs were tested for their potential to elicit cytolytic activity of 2C (Figs. 1 and 2). Visualization of the electrostatic potentials at the surfaces of the resulting MHC peptide complexes was done by molecular modeling (see below). Each of the peptides differed only in one amino acid from the starting sequences SIYRYYGL or LSPFPFDL. Previous studies had shown that the effects of amino acids in different positions of the peptide on peptide binding to the MHC molecules and cytolytic activity are not independent (15). Each peptide side chain potentially influences the conformations of neighboring side chains, and thereby its contribution to binding or to cytolytic activity. Replacing one residue at a time gave the highest certainty that changes in the capacity of the peptide to bind to the MHC molecules or to induce cytotoxic responses were due to the local effect and not to global modifications of the peptide or of the MHC molecule structure.
Figure 1.
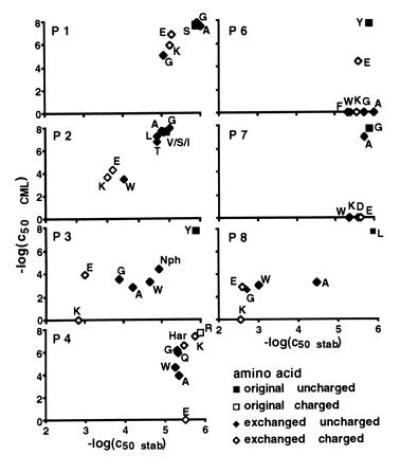
Dependence of 2C cytotoxic activity on the efficiency of peptide representation by H-2Kb. The negative logarithms of the concentrations required for half-maximal cytolytic activity of 2C were plotted against the respective values for the MHC stabilizing power of the peptides. Peptide transporter-deficient RMA-S cells were used for the stabilization assays. RMA cells were the targets for the cytotoxicity assays. Mutations of position 5 were not tested. P1–P8 are the positions in the peptide sequence.
Figure 2.
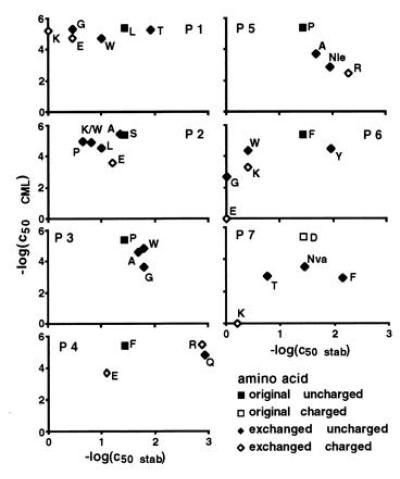
Dependence of 2C cytotoxic activity on the efficiency of peptide presentation by H-2Ld. Peptide transporter-deficient RLd-E2.1 cells were used for the stabilization assays. B2 cells were the targets for the cytotoxicity assays. Mutations at position 8 were not explored (see legend of Fig. 1 for further details).
To assess whether low activity in the cytolysis assay was due to poor presentation of the peptide, binding of these peptides to empty MHC molecules on the surface of the transporter-deficient cell lines RMA-S and RLd-E2 was measured. In the case of H-2Kb (Fig. 1), a positive correlation of binding to the MHC and induction of the T-cell response was seen for positions 1, 2, 3, and 8. Position 5 was not tested because its side chain is completely buried inside the peptide binding groove and inflexible. The amino acids at positions 4, 6, and 7 had little or no influence on peptide binding to the MHC molecule. T-cell responses, however, were strongly affected. In positions 6 and 7 most mutations led to complete abrogation of the cytolytic responses.
For H-2Ld (Fig. 2) no correlation between peptide binding and T-cell responses was detected. For positions 1, 2, 4, 6, and 7 the peptides with very different capacities to bind to H-2Ld had about the same potency in T-cell assays. Compared with the results for the H-2Kb-dependent cytolysis, far more mutations were tolerated by 2C.
The results of the peptide binding and cytolytic assays for H-2Kb were in good agreement with the classification peptide side chains at positions 1, 2, 3, and 8 as MHC contact residues and those in positions 4, 6, and 7 as residues that are exposed and potentially contact the TCR (12, 28). For mutations at peptide positions 1, 2, 3, and 8 the efficiency of the cytolytic response was positively correlated with binding to the MHC molecule. The slopes derived from regression analysis of the values in the double logarithmic representation (Fig. 3) were between 2 and 2.5, thus indicating highly cooperative correlations of binding of peptides by MHC molecules and induction of cytolysis.
Previous studies had shown that a positive charge at position 4 of the peptide SIYRYYGL is vital for the cytotoxic activity of the T-cell clone 2C (8). The density of positively charged side chains at the surface of H-2Kb was already higher than at the H-2Ld surface (Figs. 3 and 4). Therefore, a conformation in which the guanidino group of arginine-4 buried in the peptide binding groove of H-2Kb had to be considered. The data from the stabilization assays did not support this hypothesis (Fig. 1). A buried arginine would already cause a strained situation in the peptide binding groove. The larger homoarginine side chain would not fit into the groove and should lead to drastic reduction of cytolytic activity. This was not the case. Thus, the results are in favor of a peptide conformation with exposed side chains similar to RGYVYQGL and SIINFEKL in their complexes with H-2Kb (11, 25).
Attempts to reduce the charge differences at the surfaces of the two MHC peptide complexes by increasing the positive potential at the surface of H-2Ld did not result in improved stimulating power. Arginine at position 4 of LSPFPFDL was as active as phenylalanine, whereas arginine in position 5 or lysine at position 6 reduced the cytolytic activities of the peptides (Fig. 2). These results could not be attributed to poor binding of the peptides to the MHC molecule. The peptide with arginine instead of proline at position 5 bound better by one order of magnitude. At position 6, it also seems unlikely that the negative effect of lysine on cytolytic activity is due to poor presentation. Tryptophan in this position resulted in comparable binding efficiency. Its potency to stimulate the cytolytic activity, however, was about one order of magnitude higher than that of lysine.
Similarly, increasing the negative potential at the surface of the H-2Kb/SIYRYYGL complex resulted in a loss of activity in cytotoxic T lymphocyte assays. In H-2Ld threonine-163 of H-2Kb is replaced by glutamic acid. This side chain is situated in the vicinity of positions 3 and 4 of the peptide. However, increasing the negative potential in the central part of the H-2Kb peptide complex was detrimental to biological activity (Fig. 1). Glutamic acid in position 3 decreased the binding efficiency by three orders of magnitude and reduced the activity in the T-cell assay by about four orders of magnitude. Even though recognition was better than that of the lysine containing analogue, a more pronounced positive effect on recognition should have occurred. Replacing arginine with glutamic acid at position 4 had no effect on binding but caused complete loss of activity in T-cell assays.
Molecular Modeling.
Molecular modeling of the two MHC peptide complexes H-2Kb/SIYRYYGL and H-2Ld/LSPFPFDL served two purposes. First, the models were used to visualize the electrostatic charge distribution at the surfaces of both MHC peptide complexes and provided the basis for the design of single amino acid peptide variants. Second, the analyses of the alternative conformations for each MHC peptide complex allowed for the exploration of the conformational space available to exposed side chains and, thus, to identify possibilities to match the two surface structures.
The model of the SIYRYYGL/H-2Kb complex (Fig. 1) was derived from the crystal structure of the RGYVYQGL/H-2Kb complex published by Fremont and colleagues (12). The potential conformational space for the peptide SIYRYYGL was significantly reduced by information from the crystal structure. The predominant roles of the terminal charges and of the primary motif residues (29) tyrosine 5 and leucine 8 for anchoring the octapeptides in the groove of H-2Kb made it likely that the main and side chains of SIYRYYGL and RGYVYQGL would assume similar conformations.
The experimental data from the stabilization assays were used to introduce additional constraints during the modeling process. For positions 1, 2, and 3 at least partially buried side chains were deduced from the binding assays; for positions 4, 6, and 7 the side chains are apparently pointing out of the peptide binding pocket. The conformation of the peptide SIYRYYGL would therefore be largely identical to the conformations of RGYVYQGL and SIINFEKL in H-2Kb (11, 25). The rms deviation between structure a in Fig. 3 and the minimized crystal structure was 1.27 Å for the heavy atoms.
The molecular model of H-2Ld in complex with the peptide LSPFPFDL was generated from the crystal structure of H-2Kb/RGYVYQGL by homology modeling. The positions of the N and C termini were taken from the H-2Kb crystal structure. Comparison of crystal structures of different MHC allomorphs in complex with various peptides revealed very similar N- and C-terminal peptide binding pockets (12, 25, 30, 31). The orientations of the central six peptide side chains were deduced from the results of the stabilization assays. A multi-step molecular modeling procedure was employed to generate the structures shown in Fig. 4, structure a. The side chain of the amino acid at position 2 was exposed. The side chains of the amino acids at positions 1, 2, 6, and 7 were partially exposed but had a strong tendency to contact one of the flanking α-helices of the MHC molecule. Extended aliphatic side chains instead of prolines at positions 3 and 5 would point into the groove. It was difficult to reconcile all experimental data with one self-consistent model. For instance, how could it be explained that the proline to tryptophan mutation at position 3 resulted in the same increase in stabilization potential as the proline to glycine mutation? However, these problems turned out to be irrelevant for the distribution of the electrostatic surface potential (see below).
In contrast to the H-2Kb peptide complex, in which the central portion of the peptide was fixed by the primary anchor residue tyrosine at position 5, H-2Ld-bound peptides had more conformational freedom. As shown in Fig. 2, this led to considerable variations of the backbone geometries. The rms deviation for structure a to the minimized crystal structure was 1.61 Å (heavy atoms).
Electrostatic Surface Potentials of the MHC Peptide Complexes.
To validate the molecular modeling approach we analyzed how changes in main and side chain conformations of the peptides affected the distribution of the electrostatic potentials at the surfaces of the complexes. Three conformations for each MHC peptide complex were generated with different molecular modeling protocols. Structures were included into molecular modeling protocols that deliberately violated constraints from the cell biological experiments. The two alternative structures (b and c) varied from the first one (a) by an alternative conformation of the backbone at position 6 (b) and by a turn of the N terminus toward the α2-helix (c). The rms deviations from the starting structure for heavy atoms were 1.27 (0.97) Å, 0.66 (2.54) Å, 0.61 (2.17) Å for structures a, b, and c, respectively (values in parentheses refer to the peptide, backbone atoms only). In spite of these differences, the distribution of the electrostatic potentials at the surfaces of the three alternative structures were very much the same (Figs. 3 and 4, left).
The uncertainties inherent in the molecular modeling approach turned out not to influence the final result and the conclusions.
Comparison of the Electrostatic Surfaces of the Two MHC Peptide Complexes.
The comparison of the T-cell accessible surface areas of the SIYRYYGL/H-2Kb (Fig. 3) and of the LSPFPFDL/H-2Ld (Fig. 4) complexes revealed strong differences in density and distribution of positive and negative charges in the central part of the molecular surfaces of the two complexes. The most distinguished feature of the SIYRYYGL/H-2Kb complex (Fig. 1) is the high density of positive charges in the middle, which is mainly attributed to arginine-155 of the MHC molecule and arginine-4 of the peptide. The LSPFPFDL/H-2Ld complex (Fig. 2), on the other hand, is in its middle part dominated by a widespread negative potential, which results from glutamic acid instead of threonine at position 163 of the MHC molecule and the absence of the aforementioned positively charged residues. The negative charge of aspartic acid at position 7 of LSPFPFDL might replace aspartic acid-77 of H-2Kb in interactions with the TCR. However, a high excess of negative charges in the H-2Ld peptide complex remains.
The alternative molecular models for the two complexes show that even the most radical conformational change will have only limited impact on the electrostatic potential distribution.
DISCUSSION
The results presented in this paper illustrate a clear case of recognition of two different ligand structures by one TCR. Thus, crossreactivity in this case is not based on molecular mimicry by the MHC peptide complexes. The described functional mimicry does not require topological identity or sequence similarity of the recognized ligands. Instead, adaptation of the TCR to the different MHC peptide complexes has to be assumed. It cannot be decided whether this adaptation involves conformational changes. However, molecular modeling of the 2C TCR (data not shown) revealed a potentially high variability of the distribution of surface charges due to the conformational freedom of the hypervariable loops. Comparable cases of functional mimicry by structurally dissimilar ligands were reported for antibody antigen interactions (32, 33) and hormone receptors (34). The failure to enhance biological activity by increasing the similarity of the cross-recognized structures reflect the complex nature of interdependent interactions at protein–protein interfaces.
Besides the striking differences in the central part of the two MHC peptide complexes, there are also shared features. A ring of 10 regularly distributed, positively charged amino acids marks the perimeter of the potential TCR contact area (Figs. 3 and 4). These amino acids are arginines 6, 35, 62, 75, 79, 155, 169, and 170 and lysines 68 and 144. The negative charges of glutamic acids 55, 71, 148, and 166 are arranged in a section close to the C terminus of the peptide. Some of these charged residues are conserved in MHC genes (9). Partly conserved complementary charges could be shown in tentative molecular modeling studies at the potential contact surface of the TCR (R.B. and K. Sparbier, unpublished observations). The existence of such conserved complementary charged amino acids suggests that αβ TCR are biased toward recognition of MHC molecules. Ignatowicz and coworkers recently came to the same conclusion when they observed high frequencies of allo-MHC-specific T cells positively selected by a single MHC peptide ligand (35). Interaction of these charged groups could provide a minimal binding energy and thereby support the flexible arrangement of the hypervariable loops for adaptation to the different peptides. In addition, they might serve as navigation signals that guide docking of the TCR and the MHC peptide complexes.
The peptides play very different roles in the self- and allo-MHC-restricted T-cell responses shown in this communication. The self-MHC-restricted reaction of the clone 2C was finely tuned on the peptide and, thus, relatively intolerant to sequence variations. In the context of the allo-MHC, on the other hand, 2C largely ignored changes in the peptide sequence. These differences in the mode of peptide recognition could be a reflection of the selection processes that shape the TCR repertoire. There is negative selection by self-MHC plus peptide, but not by allo-MHC. As a consequence, allo-MHC molecules could provide an elevated baseline contribution to the binding energy reducing the share of the peptide on the threshold required for T-cell activation. This conclusion is in agreement with Sykulev and colleagues (36) who suggested that TCR affinities for peptide plus allo-MHC molecules tend to be higher than for peptide plus self-MHC molecules.
The results suggest that the current concepts of crossreactivity in immunology need to be revised. This would have consequences also for the etiology of auto-immune diseases. Major research efforts are based on the assumption that molecular mimicry by infectious agents might cause immune responses that subsequently become auto-aggressive. This assumption might be too limited, since completely dissimilar antigens and MHC peptide complexes can trigger crossreactivities. Degeneracy of peptide recognition by T-cells has been reported (37–39). Here we extend these observations and demonstrate that the differences between the cross-recognized peptides need not be compensated for by the presenting MHC molecule to elicit T-cell responses.
Acknowledgments
The general support of J. Klein is gratefully acknowledged. We would like to give special thanks to G. Labib for her technical assistance. R.B. was stipendiary of the Studienstiftung des Deutschen Volkes. This work was financed in part by the European Community–Biotech program (project 920 131), by the Bundesministerium für Forschung und Technologie (01KI 8909), and by the Deutsche Forschungsgemeinschaft (SFB 323-C2 Jung).
Footnotes
Abbreviations: MHC, major histocompatibility complex; TCR, T-cell receptor; rms, root-mean-square.
References
- 1.Bevan M J. Proc Natl Acad Sci USA. 1977;74:2094–2098. doi: 10.1073/pnas.74.5.2094. [DOI] [PMC free article] [PubMed] [Google Scholar]
- 2.Matzinger P, Bevan M J. Cell Immunol. 1977;29:1–5. doi: 10.1016/0008-8749(77)90269-6. [DOI] [PubMed] [Google Scholar]
- 3.Kisielow P, Blüthmann H, Staerz U D, Steinnmetz M, von Boehmer H. Nature (London) 1988;335:730–734. [Google Scholar]
- 4.Sha W C, Nelson C A, Newberry R D, Kranz D M, Russell J H, Loh D Y. Nature (London) 1988;336:73–76. doi: 10.1038/336073a0. [DOI] [PubMed] [Google Scholar]
- 5.Hogquist K A, Gavin M A, Bevan M J. J Exp Med. 1993;177:1469–1473. doi: 10.1084/jem.177.5.1469. [DOI] [PMC free article] [PubMed] [Google Scholar]
- 6.Ashton-Rickardt P G, von Kaer L, Schumacher T N M, Ploegh H L, Tonegawa S. Cell. 1993;73:1041–1049. doi: 10.1016/0092-8674(93)90281-t. [DOI] [PubMed] [Google Scholar]
- 7.Kranz D M, Sherman D H, Sitkovsky M V, Pasternack M S, Eisen H N. Proc Natl Acad Sci USA. 1984;81:573–577. doi: 10.1073/pnas.81.2.573. [DOI] [PMC free article] [PubMed] [Google Scholar]
- 8.Udaka K, Tsomides T J, Eisen H N. Cell. 1992;69:989–998. doi: 10.1016/0092-8674(92)90617-l. [DOI] [PubMed] [Google Scholar]
- 9.Udaka K, Wiesmüller K-H, Kienle S, Jung G, Walden P. J Immunol. 1996;157:670–678. [PubMed] [Google Scholar]
- 10.Klein J. Natural History of the Major Histocompatibility Complex. New York: Wiley; 1986. [Google Scholar]
- 11.Moore K W, Sher B T, Sun Y H, Eakle K A, Hood L. Science. 1982;215:679–682. doi: 10.1126/science.7058332. [DOI] [PubMed] [Google Scholar]
- 12.Fremont D H, Matsumura M, Stura E A, Peterson P A, Wilson I A. Science. 1992;257:919–926. doi: 10.1126/science.1323877. [DOI] [PubMed] [Google Scholar]
- 13.Matsumura M, Fremont D H, Peterson P A, Wilson I A. Science. 1992;257:927–934. doi: 10.1126/science.1323878. [DOI] [PubMed] [Google Scholar]
- 14.Ljunggren H-G, Kärre K. J Exp Med. 1985;162:1745–1759. doi: 10.1084/jem.162.6.1745. [DOI] [PMC free article] [PubMed] [Google Scholar]
- 15.Schumacher T N M, Heemels M-T, Neefjes J J, Kast W M, Melief C J M, Ploegh H L. Cell. 1990;62:563–567. doi: 10.1016/0092-8674(90)90020-f. [DOI] [PubMed] [Google Scholar]
- 16.Udaka K, Wiesmüller K-H, Kienle S, Jung G, Walden P. J Exp Med. 1995;181:2097–2108. doi: 10.1084/jem.181.6.2097. [DOI] [PMC free article] [PubMed] [Google Scholar]
- 17.Köhler G, Fischer-Lindahl K, Heusser C. In: The Immune System. Steinberg C, Lefkovitz I, editors. Basel: Karger; 1981. pp. 202–208. [Google Scholar]
- 18.Lie W-R, Myers N B, Gorka J, Rubocki R J, Connolly J M, Hansen T H. Nature (London) 1990;344:439–441. doi: 10.1038/344439a0. [DOI] [PubMed] [Google Scholar]
- 19.Nicholls A, Sharp K, Honig B. Proteins Struct Funct Genet. 1991;11:281–296. doi: 10.1002/prot.340110407. [DOI] [PubMed] [Google Scholar]
- 20.Dauber-Osguthorpe P, Roberts V A, Osguthorpe D J, Wolff J, Genest M, Hagler A T. Proteins Struct Funct Genet. 1988;4:31–47. doi: 10.1002/prot.340040106. [DOI] [PubMed] [Google Scholar]
- 21.Rognan D, Zimmermann N, Jung G, Folkers G. Eur J Biochem. 1992;208:101–113. doi: 10.1111/j.1432-1033.1992.tb17163.x. [DOI] [PubMed] [Google Scholar]
- 22.Abola E E, Bernstein F C, Bryant S H, Koetzle T F, Weng J. In: Protein Data Bank. Allen F H, Bergerhoff G, Sievers R, editors. Chester, U.K.: Data Commission of the International Union of Crystallography; 1987. [Google Scholar]
- 23.Bernstein F C, Koetzle T F, Williams G J B, Meyer E F, Jr, Brice M D, Rodgers J R, Kennard O, Shimanouchi T, Tasumi M. J Mol Biol. 1977;112:535–542. doi: 10.1016/s0022-2836(77)80200-3. [DOI] [PubMed] [Google Scholar]
- 24.Wilson S R, Cui W. Biopolymers. 1990;29:225–235. doi: 10.1002/bip.360290127. [DOI] [PubMed] [Google Scholar]
- 25.Fremont D H, Stura E A, Matsumura M, Peterson P A, Wilson I A. Proc Natl Acad Sci USA. 1995;92:2479–2483. doi: 10.1073/pnas.92.7.2479. [DOI] [PMC free article] [PubMed] [Google Scholar]
- 26.Anderson D E, Becktel W J, Dahlquist F W. Biochemistry. 1990;29:2403–2408. doi: 10.1021/bi00461a025. [DOI] [PubMed] [Google Scholar]
- 27.Kruse N, Shen B, Arnold S, Tony H P, Müller T, Sebald W. EMBO J. 1993;12:5121–5130. doi: 10.1002/j.1460-2075.1993.tb06207.x. [DOI] [PMC free article] [PubMed] [Google Scholar]
- 28.Udaka K, Wiesmüller K-H, Kienle S, Jung G, Walden P. J Biol Chem. 1995;270:24130–24134. doi: 10.1074/jbc.270.41.24130. [DOI] [PubMed] [Google Scholar]
- 29.Falk K, Rötzschke O, Stevanović S, Jung G, Rammensee H-G. Nature (London) 1991;351:290–296. doi: 10.1038/351290a0. [DOI] [PubMed] [Google Scholar]
- 30.Madden D R, Gorga J C, Strominger J L, Wiley D C. Cell. 1992;70:1035–1048. doi: 10.1016/0092-8674(92)90252-8. [DOI] [PubMed] [Google Scholar]
- 31.Madden D R, Garoczi D N, Wiley D C. Cell. 1993;75:693–708. doi: 10.1016/0092-8674(93)90490-h. [DOI] [PubMed] [Google Scholar]
- 32.Fields B A, Goldbaum F A, Ysern X, Poljak R J, Mariuzza R A. Nature (London) 1995;374:739–742. doi: 10.1038/374739a0. [DOI] [PubMed] [Google Scholar]
- 33.Bentley G A, Boulot G, Riottot M M, Poljak R J. Nature (London) 1990;348:254–257. doi: 10.1038/348254a0. [DOI] [PubMed] [Google Scholar]
- 34.de Vos A M, Ultsch M, Kossiakoff A A. Science. 1992;255:306–312. doi: 10.1126/science.1549776. [DOI] [PubMed] [Google Scholar]
- 35.Ignatowicz L, Kappler J, Marrack P. Cell. 1996;84:521–529. doi: 10.1016/s0092-8674(00)81028-4. [DOI] [PubMed] [Google Scholar]
- 36.Sykulev Y, Brunmark A, Tsomides T J, Kageyama S, Jackson M, Peterson P A, Eisen H N. Proc Natl Acad Sci USA. 1994;91:11487–11491. doi: 10.1073/pnas.91.24.11487. [DOI] [PMC free article] [PubMed] [Google Scholar]
- 37.Gavin M A, Dere B, Grandea A G, III, Hogquist K A, Bevan M J. Eur J Immunol. 1994;24:2124–2133. doi: 10.1002/eji.1830240929. [DOI] [PubMed] [Google Scholar]
- 38.Wucherpfennig K W, Strominger J L. Cell. 1995;80:695–705. doi: 10.1016/0092-8674(95)90348-8. [DOI] [PMC free article] [PubMed] [Google Scholar]
- 39.Gundlach B R, Junt T, Wiesmüller K-H, Jung G, Walden P. J Immunol. 1996;156:3645–3651. [PubMed] [Google Scholar]