

Abstract
Elastin provides recoil to tissues subjected to repeated stretch, such as blood vessels and the lung. It is encoded by a single gene in mammals and is secreted as a 60–70 kDa monomer call tropoelastin. The functional form of the protein is that of a large, highly crosslinked polymer that organizes as sheets or fibers in the extracellular matrix. Purification of mature, crosslinked elastin is problematic because its insolubility precludes its isolation using standard wet-chemistry techniques. Instead, relatively harsh experimental approaches designed to remove non-elastin ‘contaminates’ are employed to generate an insoluble product that has the amino acid composition expected of elastin. Although soluble, tropoelastin also presents problems for isolation and purification. The protein’s extreme stickiness and susceptibility to proteolysis requires careful attention during purification and in tropoelastin-based assays. This article describes the most common approaches for purification of insoluble elastin and tropoelastin. It also addresses key aspects of studying tropoelastin production in cultured cells, where elastin expression is highly dependent upon cell type, culture conditions, and passage number.
Keywords: elastin, elastic fiber, tropoelastin, microfibrils, fibrillin, purification
1. Introduction
In theory, elastin should be an easy protein to purify: simply expose a tissue to high heat and extreme conditions of pH and the residue that remains is elastin. While most proteins are easily denatured (and solubilized) under these conditions, elastin survives because of its unique chemical composition and highly cross-linked nature. Indeed, extraction with hot alkali has long been the method of choice for obtaining what is regarded as highly purified protein from elastin-rich tissues. We now know, however, that the hot alkali product is highly fragmented and lacks important sequences found in the intact protein.
In elastin biology, it is important to distinguish between elastin and elastic fibers. These terms are sometimes used interchangeably in the literature when, in fact, they refer to separate entities. Elastin in tissues is complexed with microfibrils to form elastic fibers (Figure 1). Elastin is the protein that imparts elasticity to the fiber and in adult tissue comprises the major component of elastic fibers. Microfibrils are 10–12 nm filaments and are thought to help structure the elastic fiber during tissue growth and maturation [1–3]. In fetal tissues, the ratio of microfibrils to elastin is high, but decreases quickly following birth as elastin deposition increases dramatically. Elastic fibers can only be defined using morphological criteria, and not by biochemical criteria, because the fibres bind a variety of proteins, some of which might not be integral components of the fiber.
Figure 1.
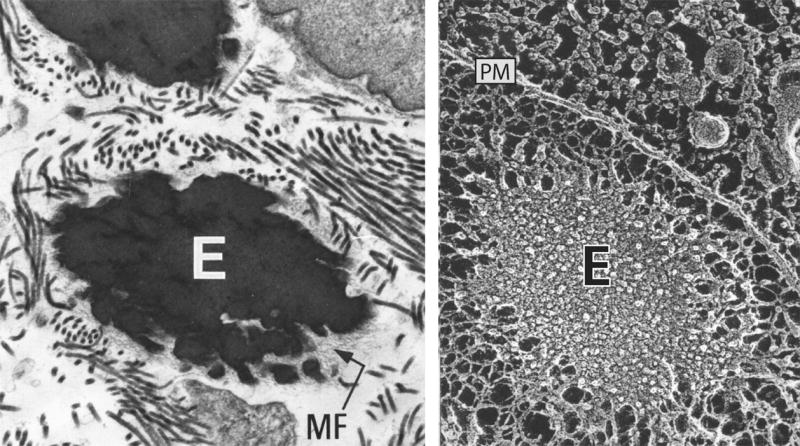
Electron micrographs of elastic fibers. Left: Standard transmission microscopy of developing lung showing an elastic fiber consisting of elastin (E) and microfibrils (MF). The microfibrils remain on the periphery of the fiber and are thought to help structure the fiber and assist in elastin crosslinking. Right: A similar elastic fiber visualized using quick-freeze, deep etch microscopy [78]. Unlike standard transmission microscopy, quick-freeze, deep etch images provide insight into organization of elastin within the fiber. The plasma membrane of an adjacent cell runs from top left to lower right and is indicated by PM.
Containing fibrillin and other associated proteins [1, 4], microfibrils are enriched in cysteine and acidic amino acids [5]. Monomeric elastin, in contrast, has only two cysteines and is low in acidic residues. Thus, the level of cysteine and acidic amino acids is an excellent indicator of elastin purity. As detailed below, relatively harsh techniques are required to remove microfibrils from elastin, most likely due to covalent interactions between the two [6].
In most animal species, a single gene encodes elastin. The only known exceptions are zebrafish and frogs, where two elastin genes have been identified [7]. In mammals, the elastin gene encodes a protein of 60–70 kDa called tropoelastin. All tropoelastins share a characteristic domain arrangement of hydrophobic sequences alternating with lysine-containing crosslinking motifs (Figure 2). In the extracellular space, >80% of the lysine residues form covalent crosslinks between and within elastin molecules. It is this crosslinked polymer that is the functional form of the protein.
Figure 2.
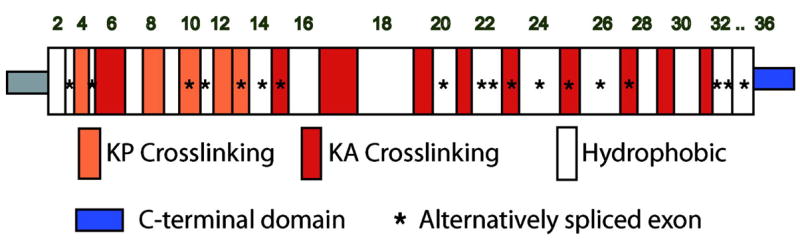
Schematic diagram of exon and domain structure of human tropoelastin. Colored squares represent lysine-crosslinking domains that contain prolines (KP) or are enriched in alanines (KA). White squares are hydrophobic sequences. The unique C-terminal region important for fiber assembly is in blue. Stars indicate exons that are alternatively spliced. Human elastin lacks exons 34 and 35 found in other mammalian elastins.
Crosslinking is initiated by one of the lysyl oxidase family members whose major function is the oxidative deamination of the ε-amino group on lysine side chains (reviewed in [8–10]). The resultant aldehyde can then condense with another aldehyde residue through an aldol condensation reaction or with an unoxidized lysyl amino group through a Shiff base reaction to form the bifunctional crosslinks aldol condensation product and dehydrolysinonorleucine, respectively. These two crosslinks can then condense to form the tetrafunctional crosslinks desmosine and isodesmosine (Figure 3). Lysyl oxidase is also responsible for crosslinking collagen, with the difference being that collagen contains 1–2 crosslinks per collagen unit whereas elastin contains 15–20. This high degree of crosslinking is important for elastin’s elastic properties and is also responsible for the proteins insolubility. It must be remembered that once crosslinked, it is impossible to dissociated elastin into monomeric tropoelastin chains.
Figure 3.
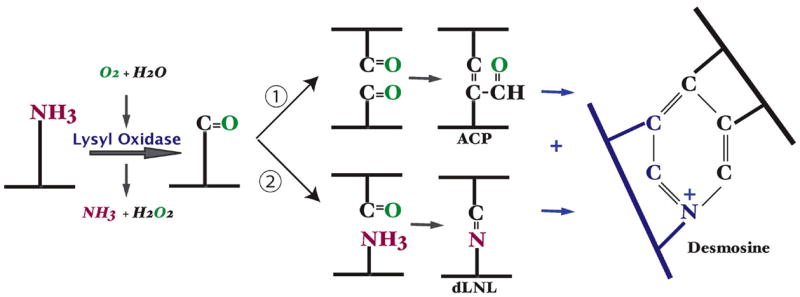
Modification of lysine side chains in crosslinking of elastin. Crosslinking of elastin monomers is initiated by the oxidative deamination of lysine side chains by the enzyme lysyl oxidase in a reaction that consumes molecular oxygen and releases ammonia. The aldehyde that is formed can condense with another modified side chain aldehyde (1) to form the bivalent aldol condensation product (ACP) crosslink. Reaction with the amine of an unmodified side chain through a Shiff base reaction (2) produces dehydrolysinonorleucine (dLNL). ACP and dLNL can then condense to form the tetrafunctional crosslink desmosine or isodesmosine.
2. Description of Methods
2.1 Purification of Insoluble Elastin
Techniques for purification of mature elastin take advantage of the protein’s insolubility, resistance to proteolysis, and ability to withstand extreme temperature and pH. More than 10 different procedures have been published for purifying elastin (e.g. see [11–21] and all have their relative advantages and disadvantages. Other than the hot alkali and autoclaving protocols, all other procedures employ chaotropic agents, buffers with reducing agents, and protease treatment to remove unwanted contaminants. Soskel and Sandburg [22] undertook a comparison of six of the most commonly used methods for purifying elastin and found that the Starcher method [20] yielded a product as pure as that obtained by the hot alkali procedure yet had fewer free amino groups, demonstrating that it was less degraded and more intact than the hot alkali product. Daamen et al. [23] have also compared various purification methods and have proposed different extraction steps and enzyme digestions to remove non-elastin contaminants. The hot alkali, autoclaving, and Starcher protocols are described in detail below.
For all of the procedures that follow, elastin purification is more efficient if tissues are thoroughly washed with saline (to remove soluble proteins) and defatted. With large amounts of tissue, the initial washes should be repeated until the supernatants are free of protein. It also helps to mince the tissue as fine as possible or grind to a fine power in liquid nitrogen before the extraction steps. Removal of fat can be accomplished using 2:1 (v/v) chloroform: methanol or by refluxing in ether. Alternatively, sequential extractions in 100% ethanol (2 times), 50:50 (v/v) ether:ethanol (2 times), then 100 % ether (2 times) can be used. When working with small samples, saline washes and fat extraction can be eliminated to minimize sample loss.
2.1.1 Hot Alkali [14, 24]
Hot alkali extraction results in a protein product that has an amino acid composition that best matches the expected values for elastin. However, due to the harsh conditions, hot alkali-purified elastin shows evidence of degradation [22, 25], which must be taken into account when designing experiments with the purified product. It is important to note that incubation at high temperature for longer than 50 minutes will result in extensive peptide bond cleavage.
Ten volumes of 0.1N NaOH are added to minced, defatted tissue (dry or wet) in an appropriate container containing a stir bar to provide mixing. The sample is placed in a boiling water bath and stirred. After 45 minutes the sample is removed to cool to room temperature then washed with cold 0.1N NaOH followed by distilled water in a Büchner funnel or by centrifugation. The washed sample is lyophilized and analyzed for purity by amino acid analysis.
2.1.2 Autoclaving [15]
The autoclaving method is milder than hot alkali so the final product is less degraded. However, autoclaved elastin often contains more contaminates. Fetal tissues generally require more autoclave cycles than do tissues from mature animals.
Washed tissue is autoclaved in 20 volumes distilled water at 1 atmosphere for 45 minutes in a container fitted with a loose fitting gauze plug. The autoclave step is repeated with fresh distilled water until no further protein is detected in the supernatant (usually 3–4 times). The residue is dried by lyophilization or in room air after treatment with ethanol.
2.1.3 Starcher Method [20]
The Starcher method combines autoclave treatment with extraction using reducing and chaotropic agents and enzymatic digestion. Because elastin lacks methionine, cyanogen bromide is used to cleave non-elastin proteins. This method works well with tissues where elastin is difficult to purify, including lung [22]. As stated above, the product obtained using this technique can be equivalent to elastin prepared using hot NaOH with less internal peptide bond degradation.
Minced or pulverized tissue is extracted for 72 hr with repeated changes of 0.05 M Na2HPO4 buffer, pH 7.6, containing 1% NaCl and 0.1% EDTA. After the final extraction, the residue is washed twice with distilled water and lyophilized. Approximately 200 mg of the lyophilized material is suspended in 30 ml of water and autoclaved for 45 min at 25-lb pressure. The sample is centrifuged and the residue washed twice with water, suspended in 30 ml of 0.1 M Tris buffer, pH 8.2, containing 0.02M CaCl2, and incubated with 4 mg of trypsin (twice crystallized) at 37°C for 18 hr. The sample is centrifuged and the residue washed twice with water, and suspended in 10 ml of 97% formic acid. Cyanogen bromide (200 mg) is added and the suspension shaken in a well ventilated fume hood at room temperature for 5 hr. The sample is then centrifuged and the residue washed twice with water and resuspended in 30 ml of 0.05M Tris buffer, pH 8.0, which contains 6 M urea and β-mercaptoethanol (0.5%, v/v). The suspension is stirred overnight at room temperature, centrifuged, washed successively with three washes each of ethanol and acetone, and dried in vacuo over P2O5.
2.1.4 Accessing Purity of Isolated Insoluble Elastin
Elastin’s insolubility makes it impossible to assess purity using standard techniques such as SDS-PAGE or column chromatography. Instead, amino acid analysis is the best quality control available for judging the purity of the isolated protein. Purity is assessed by the absence of collagen (hydroxylysine and high hydroxyproline), the absence of carbohydrate, glycine levels that represent about one-third of the total residues, high levels of alanine, proline, and valine, and low content of polar amino acids (aspartate, glutamate, lysine, histidine, and arginine). In most instances, the levels of aspartate and glutamate give the most accurate assessment of elastin purity. Figure 4 shows the expected amino acid composition of human, mouse, and bovine elastins. Comparisons should be made to these expected values when assessing sample purity.
Figure 4.
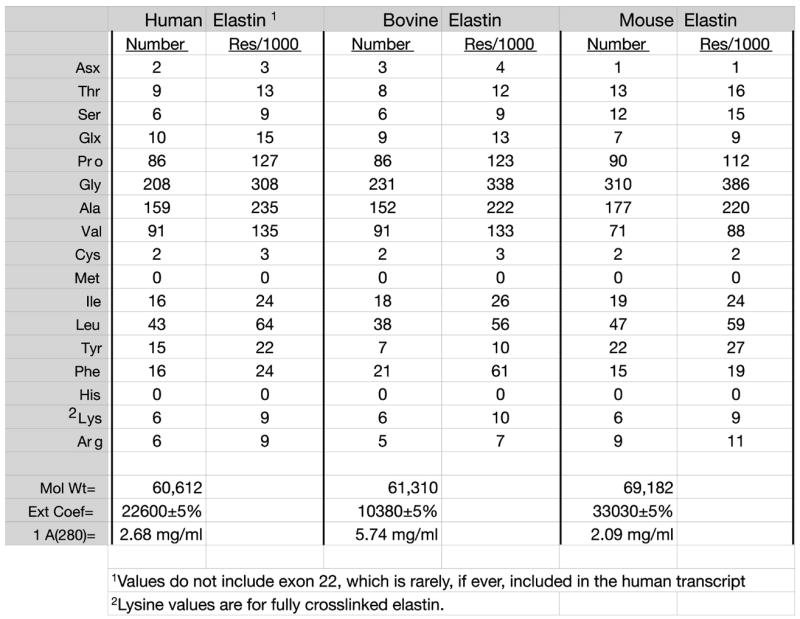
Amino acid composition of elastin. Amino acid composition of human, bovine, and mouse elastins expressed as residues per molecule (Number) and residues per 1000 residues (res/1000). Composition was determined from sequences found in Genebank. Lysine values are estimates based on full crosslinking.
For amino acid analysis, small aliquots of purified sample are hydrolyzed in 6 M HCl in vacuo under nitrogen at 110°C for 48 hours. Amino acid analysis is done on the dried residue after removal of HCl.
2.1.5 Quantitation of Desmosine Crosslinks
The crosslinking amino acids desmosine and isodesmosine are liberated by acid hydrolysis and, together with total amino acid analysis, provide an assessment of elastin purity and concentration. Because desmosine is unique to elastin in mammals (it is, however, found in avian and reptilian egg-shell membranes [26, 27]), it can be used as a quantitative marker for insoluble elastin levels in tissues and cultured cells. Many methods have been employed for detection and quantification of desmosine, including HPLC [28–33], radioimmunoassay [27, 34–37], ELISA [38–40], capillary electrophoresis, [41] and mass spectrometry [42–44]. Of these techniques, only RIA and ELISA are applicable to high throughput analysis.
3. Isolation and Purification of Tropoelastin
The elastin precursor protein, tropoelastin, has physical properties quite different from the insoluble product. First, because the lysine residues have not been crosslinked, tropoelastin has an overall net positive charge, with a pI >10. The lysine residues also render the protein susceptible to degradation by trypsin-like proteases – in contrast to the insoluble form of the protein that is resistant to trypsin digestion.
Intact tropoelastin has a molecular weight of ~60–70 kDa, depending on the species of origin (Figure 4). However, it is common to detect multiple bands by SDS-PAGE (especially when using gradient gels [45]) in this size range after tropoelastin purification. The bands close to the parent molecule result from alternative splicing, which is tissue and age specific [46–51]. Major bands at ~55 kDa, ~45 kDa, ~25 kDa and ~15 kDa are degradation products resulting from cleavage by tryptic-like proteases [25, 52–54]. Extreme care must be taken during tropoelastin purification and storage to include protease inhibitors in all extraction, purification, and storage buffers to prevent proteolytic breakdown. DEAE-cellulose chromatography of isolated tropoelastin has been shown to greatly enhance the protein’s stability, most likely due to removal of contaminating proteases by the ion-exchange resin [54].
It is our experience that purified tropoelastin is extremely “sticky” and significant loses can occur when tropoelastin is stored in solution. For this reason, purified tropoelastin should be kept as small aliquots of lyophilized protein and stored frozen.
3.1 Purification of tropoelastin from animal tissues
Tissues rich in elastin, such as the aorta or elastic ligaments, are good sources of tropoelastin. Elastin production is highest in the late fetal and neonatal stages of development, so tissues from these ages should be used. Note that it is difficult, if not impossible, to obtain tropoelastin from adult tissues because of the low rate of elastin synthesis in mature animals (Figure 5). Furthermore, because tropoelastin is rapidly crosslinked into the insoluble polymer upon secretion, crosslinking must be inhibited in order to isolate the elastin monomer. Traditionally, this has been accomplished by inhibiting lysyl oxidase through feeding animals (mostly newborn pigs and chickens) a diet deficient in copper (a critical cofactor for lysyl oxidase activity) [55, 56] or a diet containing the lysyl oxidase inhibitors β-aminopropionitrile (BAPN) or α-aminoacetonitrile (AAN) [57, 58]. Tropoelastin is then extracted using either neutral salt [56, 57] or acidic [55] buffers. Because whole animal approaches have been largely superseded by in vitro methods or recombinant expression techniques, the interested reader is referred to the primary literature cited above.
Figure 5.
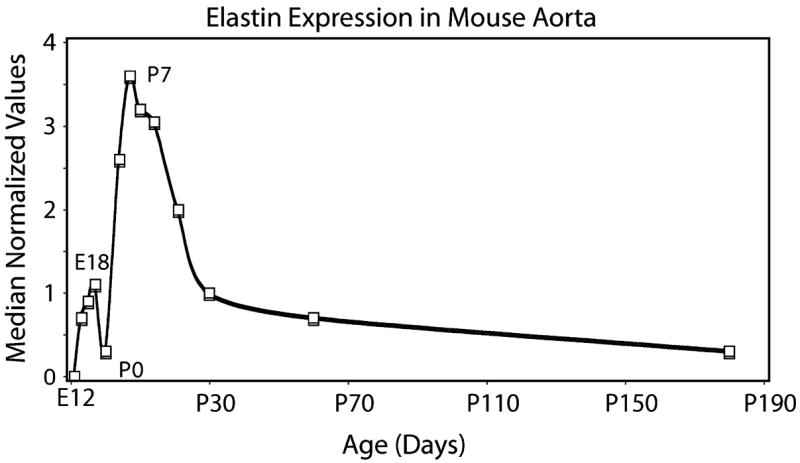
Temporal expression profile of elastin in mouse aorta. Expression of elastin as determined by oligonucleotide microarray (median normalized values) in developing mouse aorta. The pattern shows a major increase in expression beginning around embryonic day 14 and continuing through postnatal days 7–10. Thereafter, expression rapidly decreases to low levels that persist into the adult period.
3.2 In vitro technique for isolating tropoelastin from viable animal tissues
An alternative to using live animals as a source of tropoelastin is extraction of the protein from freshly obtained tissues after overnight incubation with a crosslinking inhibitor. We have been successful at isolating relatively large quantities of tropoelastin from fetal bovine ligamentum nuchae or aorta obtained from a local abattoir. Fetal tissues are used because elastin production is high and the tissue is easily manipulated. As elastin and collagen accumulate postnatally, the ligament and aorta become difficult to extract. The following procedure uses an acid extraction of tissue followed by a propanol:butanol separation. Because tropoelastin has hydrophobic properties, it partitions into the organic solvents whereas most other proteins precipitate. After drying the organic phase on a rotary evaporator, tropoelastin can be further purified using ion exchange chromatography or other techniques. The description that follows uses fetal bovine ligamentum nuchae [45], but other fetal/neonatal animal tissues can be used.
The ligamentum nuchae is removed at a local abattoir from a late gestation (200–270 day) bovine fetus and placed immediately in ice-cold Dulbecco’s modified Eagle’s medium (DMEM) containing 10% calf serum with 2X antibiotics. In the laboratory, adherent tissue is removed and the ligament finely minced (1–3 mm3) using a McIlwain tissue chopper or sterile instruments. The minced tissue is incubated overnight at 37°C in DMEM supplemented with 100 μg/ml ®-aminopropionitrile fumerate (BAPN) 50 μg/ml penicillamine, 80 μg/ml gentamycin, 1 ng/ml dexamethasone, 20 mM HEPES and 3% calf serum. The pH of the medium should be 7.4. After the incubation, the tissue is extensively washed with ice cold water to remove serum components and homogenized using a Brinkman Polytron in 0.5 M acetic acid containing 2.5 μg/ml pepstatin A. Following overnight stirring at 4°C, insoluble material is removed by centrifugation at 16,000 × g for 30 min at 4°C and discarded. Tropoelastin is extracted from the supernatant by the drop-wise addition (on ice) of 1.5 volumes of n-propanol and 2.5 volumes of n-butanol to the stirred solution [55, 56]. The precipitate that forms during this step is removed by centrifugation and the supernatant is flash evaporated to dryness on a rotary evaporator at 40°C. The residue is resuspended in a minimal volume of ice-cold dilute acetic acid (0.25% v/v) and tropoelastin is precipitated with 3 volumes of ice-cold acetone. The precipitated tropoelastin is collected by centrifugation (50,000 × g for 30 min), dissolved in water and lyophilized. Purity is assessed by SDS-PAGE and amino acid analysis. Subsequent purification can be achieved using reverse phase HPLC or ion exchange chromatography [54, 59, 60]
3.3 Bacterial expression systems
Because tropoelastin does not undergo posttranslational modification (e.g., glycosylation, proteolytic processing, etc.), bacterial expression systems are ideal for preparing relatively large amounts of purified protein. cDNAs encoding full-length tropoelastin can be easily generated and cloned into bacterial expression vectors with or without tags and fusion proteins [59, 61–63]. Martin and coworkers were able to obtain high yields of human tropoelastin by optimizing codon usage to that of the host organism [64].
In designing the expression construct, care must be taken to carefully consider whether or not to incorporate a fusion protein to facilitate purification. Because of tropoelastin’s sensitivity to proteolysis, techniques that require proteolytic removal of fusion protein components is not advised (e.g., thrombin to remove GST). Because tropoelastin does not contain methionine, one approach is to engineer a methionine residue between tropoelastin and the fusion protein, then use cyanogen bromide to cleave off the fusion protein [59]. Martin et al. [64] used a variation of the propanol:butanol technique described above to isolate unfused tropoelastin from bacterial lysates with great success. Our laboratory has used nickel chromatography to isolated tropoelastins containing 6-histidine tags. The six histidine residues have little adverse effect on tropoelastin function and allow for a rapid, single isolation step that produces tropoelastin with relatively high purity. Subsequent purification can be achieved using reverse phase HPLC or ion exchange chromatography [54, 59, 60].
Full-length tropoelastin cDNA is expressed in the M-15 strain of Escherichia coli as His6 fusion proteins using the pQE expression system (Qiagen, Inc.). Following induction with IPTG, the bacteria are harvested and lysed for 4 hrs in the cold using 0.1M NaH2PO4, 10 mM Tris, 8 M urea, pH 8.0. The lysate supernatant is harvested by centrifugation and 1 ml of 50% Ni:NTA resin slurry is added for every 4 mls of lysate. After mixing for 60 minutes at room temperature, the resin-lysate mixture is loaded into an empty column and washed twice with 4 ml of 0.1 M NaH2PO4, 10 mM Tris, 8M urea, pH 6.3. Bound tropoelastin is then eluted from the resin by 4 washes with 0.5 ml of 0.1M NaH2PO4, 10 mM Tris, 8M urea, pH 4.5. Eluted protein is dialyzed against 50 mM acetic acid and lyophilized. Lyophilized protein is further purified using reverse phase high performance liquid chromatography on a C-4 reverse phase column using a 0–50% linear acetonitrile gradient. Purity is assessed by SDS-PAGE and amino acid analysis.
4. Studies of Elastin in Cultured Cells
Studies of elastin biosynthesis in intact tissues have been impeded by the insolubility of elastin and the rapidity with which tropoelastin is crosslinked into the insoluble polymer. As a result, investigators have utilized cell culture systems to assess elastin synthesis and elastic fiber formation. While the in vitro approach has, in general, been productive, the elastin phenotype in cultured cells is extremely labile and studies using cell culture techniques require careful controls before valid conclusions can be made about elastin synthesis in intact tissues. Elastin production by cultured cells is uniquely different from most other matrix proteins, so it is imperative that investigators understand how elastin production changes with time, passage, and tissue culture conditions.
4.1 Effects of culture conditions on elastin production
Below is a summary of how culture conditions, passage number, age of donor, and other variables influence elastin production. It is also important to realize that, except for a few cell types, the great majority of elastin produced by cultured cells is released into the medium and is not retained in the cell layer. Cells in culture are inefficient at crosslinking elastin and forming functional fibers, which is in stark contrast to cells in tissues where crosslinking and fiber formation occur so efficiently that a soluble pool of tropoelastin is never seen.
4.1.1 Cells in tissues vs. culture
The bovine ligamentum nuchae has been an excellent tissue to study elastin production. The tissue contains essentially a single cell type (FCL, a myofibroblast) that produces large quantities of elastin during the late fetal and neonatal periods. We have used the ligamentum nuchae as a model system to study the effects of culture conditions on the elastin phenotype [65]. Other investigators using cells from different animals and tissues have described findings similar to those for ligament cells [66–68].
A major change that occurs when cells from intact tissues are placed in culture is a large drop (4-fold in the case of the ligamentum nuchae) in elastin production when normalized to cell number [65]. A change in cell phenotype associated with cell culture is not surprising, but the drop in elastin production is particularly pronounced. While the initial effect of removing cells from their native tissue environment has not been extensively studied for cells from all tissues, there is evidence in the literature that similar drops in elastin expression occur in vascular ([66, 67] and our unpublished results) and skin [68] cells.
4.1.2 Effects of passage number
Soluble elastin production by cultured primary cells decreases with serial subcultivation and age in culture. This is true for cells from all tissues examined to date. After six trypsinizations over a period of 8 weeks, for example, soluble elastin production by FCL cells decreased ~60% from the levels measured in primary culture [65]. In addition, soluble elastin production by sixth-passage cells was much less sensitive to dexamethasone stimulation than was elastin production by first-passage cells.
4.1.3 Effects of cell density
Figure 6 shows the relationship between cell density and elastin production by ligamentum nuchae fibroblasts. Soluble elastin was not detected in culture medium of proliferating cells until the cultures approached confluence. Elastin production was greatest during the late log phase and remained relatively constant in confluent cultures. When third passage FCL cells were maintained for 12 weeks in culture without passage, soluble elastin production dropped 10–20 fold compared to levels after the first week. Similar effects of cell passage and cell density were observed for vascular smooth muscle cells [67].
Figure 6.
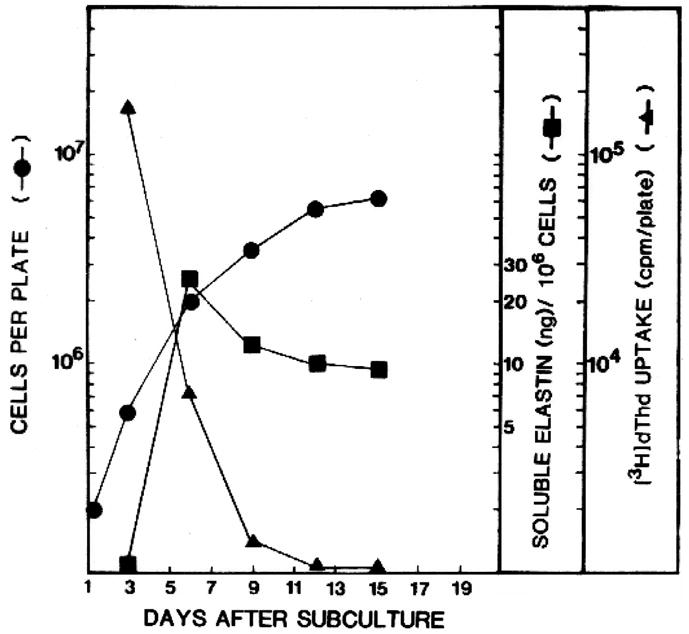
Effects of cell density on elastin synthesis. Tropoelastin production was monitored in cultures of ligamentum nuchae fibroblasts as cells were grown from sparse density (3 × 10⁵ cells/100 dish) to confluence (~7 × 10⁶ cells per dish). Tropoelastin (soluble elastin--squares) was not detected until cells approached confluence, indicated by a reduction in the rate of increase in cell number (circles) and a diminution in thymidine incorporation (triangles). Data from [65], used with permission.
4.1.4 Effects of serum
Elastin production in both primary and stable cell lines is sensitive to changes in serum levels and serum types. In studies with FCL cells, total protein and elastin synthesis were maximal in medium containing 5% fetal calf serum and remained constant in higher serum concentrations [65]. Cells grown in the presence of 5% fetal calf serum produced approximately four times as much tropoelastin as cells grown in serum-free medium. There can be big differences in how lots of FCS support elastin production. Fetal calf serum generally works better than calf serum, although some lots of calf serum have worked well for us, especially those that contain supplements [such as Cosmic Calf Serum from Hyclone (Logan, UT)]. It is advisable to test numerous serum lots and purchase sufficient quantities of the one that best supports cell growth and elastin production. Given the difference in price, it is worth including calf serum in your testing protocol.
4.1.5 Age of donor and tissue location
Elastin expression varies throughout development with highest expression levels occurring during the late embryonic and early postnatal periods [67, 69–73]. Figure 5 shows the elastin expression pattern in developing mouse aorta, which is representative for most elastin-rich tissues (aorta, lung, and ligaments). The level of expression by cells in intact tissue persists when cells are put in culture, such that cells from tissues at peak periods of elastin expression have higher levels of elastin synthesis in culture than do cells from the same tissue taken a later time points when elastin expression is lower. This is an important consideration when working with adult cells; elastin production in the adult period is at its lowest and is not representative of the cellular phenotype when cells are producing elastic fibers.
In addition to developmental factors that influence elastin levels, elastin expression can vary at different sites within the same tissue. In the developing porcine aorta, for example, elastin expression levels were highest in cells from the thoracic vs. abdominal aorta [67] whereas the inverse was true for collagen production. Thus, like developmental age, positional effects must be taken into consideration when designing experiments using cultured cells to study elastin biology.
4.2 Quantification of tropoelastin production by cultured cells
Because tropoelastin can partition into both the medium (as a soluble protein) and the cell layer (insoluble, crosslinked protein), quantification of elastin protein production can be sometimes difficult. The most accurate approach for assessing total elastin synthesis is by determining mRNA levels through Northern or RT-PCR assays. It is well established that elastin mRNA levels accurately reflect protein synthesis levels and there is extensive literature describing mRNA assays for different animal species. Immunoassays with antibodies specific for elastin are, however, extremely useful for assessing tropoelastin levels in cultured cells and in cell and tissue extracts [66, 74–77]. With the availability of monoclonal and polyclonal antibodies to tropoelastin (e.g., Elastin Products Company, Owensville, MO), sensitive ELISA assays can now be used to directly measure tropoelastin levels in experimental samples.
4.2.1 Direct binding ELISA for determining tropoelastin levels in culture medium or tissue extracts
Our laboratory has developed a direct binding ELISA that takes advantage of tropoelastin’s propensity to bind rapidly and irreversibly to plastic, even in the presence of high concentrations of serum [45]. Because serum can greatly affect elastin synthesis (see above), its inclusion in culture medium is necessary to obtain an accurate picture of elastin production by cultured cells. However, the presence of serum can adversely alter competitive binding assays and it is difficult to purify proteins from serum-containing medium. Indeed, we have shown that the simple process of dialysis will reduce tropoelastin levels substantially due to irreversible absorption of tropoelastin onto the dialysis membrane [45]. Hence, being able to determine tropoelastin levels in the presence of serum, without purification or other sample manipulations, offers a great advantage when studying cells in culture.
To assess the effects of serum on elastin binding to microtiter plates, purified tropoelastin was diluted with DMEM that contained different concentrations of calf serum. The tropoelastin solution was then added to the ELISA plate and processed as described below. The highest levels of tropoelastin binding to plastic microtiter plates were obtained in the absence of serum, although nonspecific binding of primary and secondary antibodies was relatively high. The dilution curve in the absence of serum was linear from 10 to 80 ng/ml, with saturation of binding sites for tropoelastin at about 160 ng/ml. Non-specific antibody binding could be completely blocked by the addition of 2.5% calf serum, but with some reduction in sensitivity. Increasing the calf serum concentration to 5% produced a further minimal reduction in sensitivity, and no further decrease was noted in tropoelastin binding from 5% to a maximum of 10 % calf serum. Calibration curves remained linear in the range from 20 to 160 ng/ml, with linear regression coefficients typically greater than 0.95 (Figure 7). From these studies, we recommend switching cells to culture medium containing 3% fetal calf serum when elastin levels are to be determined by direct binding ELISA. However, reliable data can be obtained with 5–10% calf serum.
Figure 7.
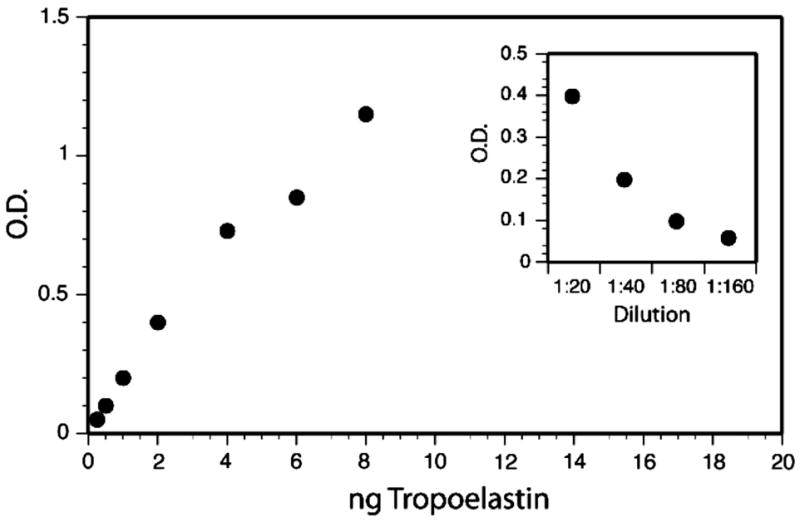
Binding of tropoelastin in cell culture medium to microtiter plates. Shown is a typical standard curve generated with purified tropoelastin dissolved in DMEM-10% calf serum and developed with tropoelastin antibody. Serial dilution of culture medium from fetal bovine chondrocytes is shown in the insert. From [45]. Used with permission.
A tropoelastin stock solution is made by dissolving purified tropoelastin at a concentration of 100 μg/ml in DMEM containing 5% calf serum and 30 mM HEPES. Before use, the tropoelastin solution is diluted to a final working concentration of 320 ng/ml in tissue culture medium identical to that used for the cell type to be studied. Serial dilutions (in triplicate) are then made in acid-washed microtiter plates to yield a range of 32 to 1 ng per well in a volume of 100 μl. For determining tropoelastin levels in conditioned medium, HEPES is added to the harvested conditioned medium to a final concentration of 30 mM and 100 μl aliquots are added directly to each well of the microtiter plate (samples should be run in triplicate). The plate is then incubated for 3 hrs at 37°C to allow the tropoelastin to absorb, then washed three times with PBS-0.1% Tween-20. There is sufficient albumin in the serum-containing culture medium to block nonspecific binding sites on the plastic so that a specific blocking step is not required prior to addition of antibody. Tropoelastin antibody diluted in the same buffer is added to the plate and incubated for 1.5 hrs at 37°C. Pre-immune rabbit serum and unconditioned serum-containing medium controls are included on each plate. Plates are then washed three times with PBS-0.1% Tween-20, incubated for 1.5 h at 37°C with peroxidase-labeled secondary antibody, washed three times with PBS-0.1% Tween-20, and developed with diamino-benzidine. Absorption values (optical density) for the experimental samples are compared to the standard curve to determine tropoelastin concentration. Optimal concentrations of primary and secondary antibodies are determined by checkerboard titration to yield a standard curve that is linear in the range 1–20 ng/well with a maximal optical density less than 1.5. Pretreatment of microtiter plates by washing for 30 minutes in 4 N sulfuric acid, rinsing with water and air-drying, enhanced tropoelastin binding and reduced plate-to-plate variability.
For most cell types, virtually all of the elastin is secreted into the medium when the crosslink inhibitors BAPN and penicillamine are included in the culture medium. Therefore, only the cell conditioned medium needs to be tested under these conditions. However, if a cell type or treatment has not been examined, tropoelastin in the cell layer should be evaluated. This can be done by washing the cell layer with cold PBS then scraping the cells with a minimal volume of 0.5 N acetic acid containing 2.5 μg/ml pepstatin A. After extraction, and equivalent volume of DMEM-20% calf serum-20 mM HEPES along with ¼ volume of 1 M HEPES, pH 7.4 are added to the sample. If necessary, the pH is adjusted to neutrality by addition of 5–10 μl aliquots of 1 N NaOH until the sample turns the characteristic orange-red color of phenol red at neutral pH. The sample is then assayed using direct binding ELISA as above. Note that tropoelastin levels in the cell layer are generally substantially lower than in culture medium so small volumes of extraction buffer are recommended.
5. Concluding remarks
Investigators not familiar with elastin’s unique properties are disappointed when ‘extraction’ of an elastin-rich tissue produces no soluble elastin protein. As described above, mature elastin is insoluble under all extraction conditions and can only be solubilized by enzymatic or chemical cleavage of peptide bonds. Even then, it is not possible to recover intact the monomeric unit (tropoelastin) that went into building this unique polymer. While elastin synthesis and assembly can be studied using cultured cells, one must be aware of how culture conditions influence elastin expression. Elastin production by cultured cells is highly variable and dependent on numerous conditions that influence cellular phenotypes. In experiments where elastin levels are to be compared between two or more experimental variables, every effort should be made to work with cells of similar passage number, from the same tissue, and at the same level of confluency in order to obtain valid results.
Acknowledgments
Original work discussed in this report was supported by NIH grants HL53325, HL71960, and HL74138. The author thanks Dr. John Heuser for providing the quick-freeze deep etch image used in Figure 1.
Footnotes
Publisher's Disclaimer: This is a PDF file of an unedited manuscript that has been accepted for publication. As a service to our customers we are providing this early version of the manuscript. The manuscript will undergo copyediting, typesetting, and review of the resulting proof before it is published in its final citable form. Please note that during the production process errors may be discovered which could affect the content, and all legal disclaimers that apply to the journal pertain.
References
- 1.Kielty CM, Sherratt MJ, Marson A, Baldock C. Adv Protein Chem. 2005;70:405–436. doi: 10.1016/S0065-3233(05)70012-7. [DOI] [PubMed] [Google Scholar]
- 2.Kielty CM, Shuttleworth CA. Int J Biochem Cell Biol. 1995;27:747–760. doi: 10.1016/1357-2725(95)00028-n. [DOI] [PubMed] [Google Scholar]
- 3.Ramirez F, Sakai LY, Dietz HC, Rifkin DB. Physiol Genomics. 2004;19:151–154. doi: 10.1152/physiolgenomics.00092.2004. [DOI] [PubMed] [Google Scholar]
- 4.Kielty CM, Sherratt MJ, Shuttleworth CA. J Cell Sci. 2002;115:2817–2828. doi: 10.1242/jcs.115.14.2817. [DOI] [PubMed] [Google Scholar]
- 5.Sakai LY, Keene DR, Glanville RW, Bachinger HP. J Biol Chem. 1991;266:14763–14770. [PubMed] [Google Scholar]
- 6.Rock MJ, Cain SA, Freeman LJ, Morgan A, Mellody K, Marson A, Shuttleworth CA, Weiss AS, Kielty CM. J Biol Chem. 2004;279:23748–23758. doi: 10.1074/jbc.M400212200. [DOI] [PubMed] [Google Scholar]
- 7.Miao M, Bruce AE, Bhanji T, Davis EC, Keeley FW. Matrix Biol. 2007;26:115–124. doi: 10.1016/j.matbio.2006.09.011. [DOI] [PubMed] [Google Scholar]
- 8.Lucero HA, Kagan HM. Cell Mol Life Sci. 2006;63:2304–2316. doi: 10.1007/s00018-006-6149-9. [DOI] [PMC free article] [PubMed] [Google Scholar]
- 9.Csiszar K. Prog Nucleic Acid Res Mol Biol. 2001;70:1–32. doi: 10.1016/s0079-6603(01)70012-8. [DOI] [PubMed] [Google Scholar]
- 10.Kagan HM. In: Regulation of Matrix Accumulation. Mecham RP, editor. Academic Press; New York: 1986. pp. 321–398. [Google Scholar]
- 11.Daamen WF, Hafmans T, Veerkamp JH, van Kuppevelt TH. Tissue Eng. 2005;11:1168–1176. doi: 10.1089/ten.2005.11.1168. [DOI] [PubMed] [Google Scholar]
- 12.Jackson DS, Cleary EG. Methods Biochem Anal. 1967;15:25–76. doi: 10.1002/9780470110331.ch2. [DOI] [PubMed] [Google Scholar]
- 13.John R, Thomas J. Biochem J. 1972;127:261–269. doi: 10.1042/bj1270261. [DOI] [PMC free article] [PubMed] [Google Scholar]
- 14.Lansing AT, Rosenthal TB, Alex M, Dempsey EW. Anat Rec. 1952;114:555–575. doi: 10.1002/ar.1091140404. [DOI] [PubMed] [Google Scholar]
- 15.Partridge SM, Davis HF, Adair GS. Biochem J. 1955;61:11–21. doi: 10.1042/bj0610011. [DOI] [PMC free article] [PubMed] [Google Scholar]
- 16.Paz MA, Keith DA, Traverso HP, Gallop PM. Biochemistry. 1976;15:4912–4918. doi: 10.1021/bi00667a025. [DOI] [PubMed] [Google Scholar]
- 17.Rasmussen BL, Bruenger E, Sandberg LB. Anal Biochem. 1975;64:255–259. doi: 10.1016/0003-2697(75)90426-1. [DOI] [PubMed] [Google Scholar]
- 18.Richmond V. Biochim Biophys Acta. 1974;351:173–177. doi: 10.1016/0005-2795(74)90178-0. [DOI] [PubMed] [Google Scholar]
- 19.Ross R, Bornstein P. J Cell Biol. 1969;40:366–381. doi: 10.1083/jcb.40.2.366. [DOI] [PMC free article] [PubMed] [Google Scholar]
- 20.Starcher BC, Galione MJ. Anal Biochem. 1976;74:441–447. doi: 10.1016/0003-2697(76)90224-4. [DOI] [PubMed] [Google Scholar]
- 21.Steven FS, Jackson DS. Biochim Biophys Acta. 1968;168:334–340. doi: 10.1016/0005-2795(68)90155-4. [DOI] [PubMed] [Google Scholar]
- 22.Soskel NT, Sandburg LB. Exp Lung Res. 1983;4:109–119. doi: 10.3109/01902148309055008. [DOI] [PubMed] [Google Scholar]
- 23.Daamen WF, Hafmans T, Veerkamp JH, Van Kuppevelt TH. Biomaterials. 2001;22:1997–2005. doi: 10.1016/s0142-9612(00)00383-5. [DOI] [PubMed] [Google Scholar]
- 24.Lowry OH, Gilligan DR, Katersky EM. J Biol Chem. 1941;139:795–804. [Google Scholar]
- 25.Mecham RP, Broekelmann T, Fliszar CJ, Shapiro SD, Welgus HG, Senior RM. J Biol Chem. 1997;272:18071–18076. doi: 10.1074/jbc.272.29.18071. [DOI] [PubMed] [Google Scholar]
- 26.Cox DL, Mecham RP, Sexton OJ. Comp Biochem Physiol B. 1982;72:619–623. doi: 10.1016/0305-0491(82)90515-6. [DOI] [PubMed] [Google Scholar]
- 27.Starcher BC, King GS. Connect Tissue Res. 1980;8:53–55. doi: 10.3109/03008208009152122. [DOI] [PubMed] [Google Scholar]
- 28.Faris B, Ferrera R, Glembourtt M, Mogayzel PJ, Jr, Crombie G, Franzblau C. Anal Biochem. 1981;114:71–74. doi: 10.1016/0003-2697(81)90453-x. [DOI] [PubMed] [Google Scholar]
- 29.Salomoni M, Muda M, Zuccato E, Mussini E. J Chromatogr. 1991;572:312–316. doi: 10.1016/0378-4347(91)80496-y. [DOI] [PubMed] [Google Scholar]
- 30.Soskel NT. Anal Biochem. 1987;160:98–104. doi: 10.1016/0003-2697(87)90618-x. [DOI] [PubMed] [Google Scholar]
- 31.Stone PJ, Bryan-Rhadfi J, Lucey EC, Ciccolella DE, Crombie G, Faris B, Snider GL, Franzblau C. Am Rev Respir Dis. 1991;144:284–290. doi: 10.1164/ajrccm/144.2.284. [DOI] [PubMed] [Google Scholar]
- 32.Yamaguchi Y, Haginaka J, Kunitomo M, Yasuda H, Bando Y. J Chromatogr. 1987;422:53–59. doi: 10.1016/0378-4347(87)80439-5. [DOI] [PubMed] [Google Scholar]
- 33.Chen JR, Takahashi M, Kushida K, Suzuki M, Suzuki K, Horiuchi K, Nagano A. Anal Biochem. 2000;278:99–105. doi: 10.1006/abio.1999.4412. [DOI] [PubMed] [Google Scholar]
- 34.King GS, Mohan VS, Starcher BC. Connect Tissue Res. 1980;7:263–267. doi: 10.3109/03008208009152362. [DOI] [PubMed] [Google Scholar]
- 35.Starcher BC, Mecham RP. Connect Tissue Res. 1981;8:255–258. doi: 10.3109/03008208109152385. [DOI] [PubMed] [Google Scholar]
- 36.Skinner SJ, Schellenberg JC, Liggins GC. Connect Tissue Res. 1983;11:113–121. doi: 10.3109/03008208309004848. [DOI] [PubMed] [Google Scholar]
- 37.Harel S, Yu SY, Janoff A, Hurewitz A, Bergofsky EH. Bull Eur Physiopathol Respir. 1980;16 Suppl:75–82. doi: 10.1016/b978-0-08-027379-2.50008-9. [DOI] [PubMed] [Google Scholar]
- 38.Gunja-Smith Z. Anal Biochem. 1985;147:258–264. doi: 10.1016/0003-2697(85)90036-3. [DOI] [PubMed] [Google Scholar]
- 39.Osakabe T, Seyama Y, Yamashita S. J Clin Lab Anal. 1995;9:293–296. doi: 10.1002/jcla.1860090503. [DOI] [PubMed] [Google Scholar]
- 40.Watanabe T, Ishimori K, Verplanke AJ, Matsuki H, Kasuga H. Tokai J Exp Clin Med. 1989;14:347–356. [PubMed] [Google Scholar]
- 41.Annovazzi L, Viglio S, Perani E, Luisetti M, Baraniuk J, Casado B, Cetta G, Iadarola P. Electrophoresis. 2004;25:683–691. doi: 10.1002/elps.200305607. [DOI] [PubMed] [Google Scholar]
- 42.Kaga N, Soma S, Fujimura T, Seyama K, Fukuchi Y, Murayama K. Anal Biochem. 2003;318:25–29. doi: 10.1016/s0003-2697(03)00134-9. [DOI] [PubMed] [Google Scholar]
- 43.Ma S, Lieberman S, Turino GM, Lin YY. Proc Natl Acad Sci U S A. 2003;100:12941–12943. doi: 10.1073/pnas.2235344100. [DOI] [PMC free article] [PubMed] [Google Scholar]
- 44.Ma S, Lin YY, Turino GM. Chest. 2007;131:1363–1371. doi: 10.1378/chest.06-2251. [DOI] [PubMed] [Google Scholar]
- 45.Prosser IW, Whitehouse LA, Parks WC, Stahle-Bäckdahl M, Hinek A, Park PW, Mecham RP. Connect Tiss Res. 1991;25:265–279. doi: 10.3109/03008209109029162. [DOI] [PubMed] [Google Scholar]
- 46.Foster JA, Rich CB, Horrigan SK. Coll Relat Res. 1986;6:387–396. doi: 10.1016/s0174-173x(86)80015-2. [DOI] [PubMed] [Google Scholar]
- 47.Parks WC, Secrist H, Wu LC, Mecham RP. J Biol Chem. 1988;263:4416–4423. [PubMed] [Google Scholar]
- 48.Wrenn DS, Parks WC, Whitehouse LA, Crouch EC, Kucich U, Rosenbloom J, Mecham RP. J Biol Chem. 1987;262:2244–2249. [PubMed] [Google Scholar]
- 49.Rich CB, Foster JA. Biochem Biophys Res Commun. 1987;146:1291–1295. doi: 10.1016/0006-291x(87)90789-3. [DOI] [PubMed] [Google Scholar]
- 50.Raju K, Anwar RA. J Biol Chem. 1987;262:5755–5762. [PubMed] [Google Scholar]
- 51.Indik Z, Yeh H, Ornstein-Goldstein N, Sheppard P, Anderson N, Rosenbloom JC, Peltonen L, Rosenbloom J. Proc Natl Acad Sci U S A. 1987;84:5680–5684. doi: 10.1073/pnas.84.16.5680. [DOI] [PMC free article] [PubMed] [Google Scholar]
- 52.Jensen SA, Vrhovski B, Weiss AS. J Biol Chem. 2000;275:28449–28454. doi: 10.1074/jbc.M004265200. [DOI] [PubMed] [Google Scholar]
- 53.Kozel BA, Wachi H, Davis EC, Mecham RP. J Biol Chem. 2003;278:18491–18498. doi: 10.1074/jbc.M212715200. [DOI] [PubMed] [Google Scholar]
- 54.Mecham RP, Foster JA. Biochemistry. 1977;16:3825–3831. doi: 10.1021/bi00636a017. [DOI] [PubMed] [Google Scholar]
- 55.Rucker RB. Methods Enzymol. 1982;82(Pt A):650–657. doi: 10.1016/0076-6879(82)82093-4. [DOI] [PubMed] [Google Scholar]
- 56.Sandberg LB, Wolt TB. Methods Enzymol. 1982;82(Pt A):657–665. doi: 10.1016/0076-6879(82)82094-6. [DOI] [PubMed] [Google Scholar]
- 57.Rich CB, Foster JA. Methods Enzymol. 1982;82(Pt A):665–673. doi: 10.1016/0076-6879(82)82095-8. [DOI] [PubMed] [Google Scholar]
- 58.Sykes BC, Partridge SM. Biochem J. 1974;141:567–572. doi: 10.1042/bj1410567. [DOI] [PMC free article] [PubMed] [Google Scholar]
- 59.Indik Z, Abrams WR, Kucich U, Gibson CW, Mecham RP, Rosenbloom J. Arch Biochem Biophys. 1990;280:80–86. doi: 10.1016/0003-9861(90)90521-y. [DOI] [PubMed] [Google Scholar]
- 60.Rich CB, Foster JA. Biochem J. 1984;217:581–584. doi: 10.1042/bj2170581. [DOI] [PMC free article] [PubMed] [Google Scholar]
- 61.Grosso LE, Parks WC, Wu L, Mecham RP. Biochem J. 1991;273:517–522. doi: 10.1042/bj2730517. [DOI] [PMC free article] [PubMed] [Google Scholar]
- 62.Marigo V, Sitta A, Volpin D, Bressan GM. Connect Tissue Res. 1992;28:13–28. doi: 10.3109/03008209209014225. [DOI] [PubMed] [Google Scholar]
- 63.Broekelmann TJ, Kozel BA, Ishibashi H, Werneck CC, Keeley FW, Zhang L, Mecham RP. J Biol Chem. 2005;280:40939–40947. doi: 10.1074/jbc.M507309200. [DOI] [PubMed] [Google Scholar]
- 64.Martin SL, Vrhovski B, Weiss AS. Gene. 1995;154:159–166. doi: 10.1016/0378-1119(94)00848-m. [DOI] [PubMed] [Google Scholar]
- 65.Mecham RP, Lange G, Madaras JG, Starcher BC. J Cell Biol. 1981;90:332–338. doi: 10.1083/jcb.90.2.332. [DOI] [PMC free article] [PubMed] [Google Scholar]
- 66.Giro MG, Hill KE, Sandberg LB, Davidson JM. Collagen Rel Res. 1984;4:21–34. doi: 10.1016/s0174-173x(84)80026-6. [DOI] [PubMed] [Google Scholar]
- 67.Ruckman JL, Luvalle PA, Hill KE, Giro MG, Davidson JM. Matrix Biol. 1994;14:135–145. doi: 10.1016/0945-053x(94)90003-5. [DOI] [PubMed] [Google Scholar]
- 68.Sephel GC, Davidson JM. J Invest Dermatol. 1986;86:279–285. doi: 10.1111/1523-1747.ep12285424. [DOI] [PubMed] [Google Scholar]
- 69.Burnett W, Finnigan-Bunick A, Yoon K, Rosenbloom J. J Biol Chem. 1982;257:1569–1572. [PubMed] [Google Scholar]
- 70.Cleary EG, Sandberg LB, Jackson DS. J Cell Biol. 1967;33:469–479. doi: 10.1083/jcb.33.3.469. [DOI] [PMC free article] [PubMed] [Google Scholar]
- 71.Hsu-Wong S, Katchman SD, Ledo I, Wu M, Khillan J, Bashir MM, Rosenbloom J, Uitto J. J Biol Chem. 1994;269:18072–18075. [PubMed] [Google Scholar]
- 72.Kelleher CM, McLean SE, Mecham RP. Curr Top Dev Biol. 2004;62:153–188. doi: 10.1016/S0070-2153(04)62006-0. [DOI] [PubMed] [Google Scholar]
- 73.McLean SE, Mecham BH, Kelleher CM, Mariani TJ, Mecham RP. In: Extracellular Matrices and Development. Miner JH, editor. Vol. 15. Elsevier; New York: 2005. pp. 82–128. [Google Scholar]
- 74.Kucich U, Christner P, Lippmann M, Kimbel P, Williams G, Rosenbloom WGJ. Am Rev Respir Dis. 1985;131:709–713. doi: 10.1164/arrd.1985.131.5.709. [DOI] [PubMed] [Google Scholar]
- 75.Mecham RP, Lange G. Connect Tiss Res. 1980;7:247–252. doi: 10.3109/03008208009152360. [DOI] [PubMed] [Google Scholar]
- 76.Mecham RP, Lange G. Methods Enzymol. 1982;82:744–759. doi: 10.1016/0076-6879(82)82099-5. [DOI] [PubMed] [Google Scholar]
- 77.Wrenn DS, Mecham RP. Methods Enzymol. 1987;144:246–259. doi: 10.1016/0076-6879(87)44182-7. [DOI] [PubMed] [Google Scholar]
- 78.Heuser JE. Trends Biochem Sci. 1981:64–68. [Google Scholar]