Abstract
Despite the widespread use of cement as a means of fixation of implants to bone, surprisingly little is known about the micromechanical behavior in terms of the local interfacial motion. In this work, we utilized digital image correlation techniques to quantify the micromechanics of the cement–bone interface of laboratory-prepared cemented total hip replacements subjected to nondestructive, quasistatic tensile and compressive loading. Upon loading, the majority of the displacement response localized at the contact interface region between cement and bone. The contact interface was more compliant (p = 0.0001) in tension (0.0067 ± 0.0039 mm/MPa) than compression (0.0051 ± 0.0031 mm/MPa), and substantial hysteresis occurred due to sliding contact between cement and bone. The tensile strength of the cement–bone interface was inversely proportional to the compliance of the interface and proportional to the cement/bone contact area. When loaded beyond the ultimate strength, the strain localization process continued at the contact interface between cement and bonewith microcracking (damage) to both. More overalldamage occurredto the cement than to the bone. The opening and closing at the contact interface from loading could serve as a conduit for submicron size particles. In addition, the cement mantle is not mechanically supportedby surrounding bone as optimally as is commonly assumed. Both effects may influence the longevity of the reconstruction and could be considered in preclinical tests.
Keywords: implant fixation, micromotion, micromechanics, interface
INTRODUCTION
A mechanically stable cement–bone interface is essential for long-term viability of joint replacements that utilize cement fixation. Postoperatively the bone–cement interface may be immediately compromised due to cement polymerizing heat necrosis,1 the reaming process,2 or local monomer toxicity.3 Hence, a small layer of inferior tissue could develop between cement and bone that may make the interface more compliant, reduce its strength, and lead to early implant migration. However, relationships between these factors have not been established. In well-vascularized areas, necrotic bone may remodel into healthy bone,4 resulting in direct bone–cement contact, though this bone may not be fully mineralized.5–7
Under ideal conditions, the cement–bone interface may remain intact for years without an adverse biological response.8 However, conditions are often compromised, leading to progressive interface failure accompanied by clinical radio-lucencies, component migration, and pain. The exact mechanism for loosening is likely multi-factorial with contributions from osteolysis and micromotion at the interface, bony changes due to stress adaptation and aging, and locally high fluid pressure.9
A great deal is known about the strength of the cement–bone interface,10–14 but surprisingly little is known about its micromechanical behavior (local deformations, stress levels, and motions due to loading). The term micromotion is often used to describe the small motions that can occur between implant, cement, and bone, but these descriptions are often indicative of global motion between different components of the reconstruction.6,15 Which of the two materials (bone or cement) fails first and how failure is affected by the quality and architecture of the (trabecular) bone and the cement interdigitation remain unknown. Further, substantial micromotion (via sliding and opening) at the intact interface might occur, thereby promoting particle migration. An understanding of deformations and motion that occur at the interface is important to understand the role of mechanical loading in the loosening process as this may influence, or be influenced by each of the mechanisms described above.
We utilized digital image correlation techniques to quantify the micromechanics of the cement–bone interface of laboratory-prepared cemented total hip replacements when subjected to quasistatic tensile and compressive loading. We addressed four research questions: (1) does the majority of deformation localize to the contact interface between cement and bone?; (2) is the interface more compliant in tension than in compression?; (3) does a relationship exist between interface compliance, interface contact area, and interface strength?; and (4) when loaded to failure, does the majority of damage occur at the cement or bone adjacent to the interface?
METHODS
Specimen Preparation
Cement–bone specimens were created with interfaces that would represent those generated at the time of surgery for cemented total hip replacement. Six fresh-frozen proximal femurs were obtained from the SUNY Upstate Anatomical Donors Program (mean age, 74; range, 50–92, 4 male). Specimens were stripped of soft tissue, potted in an alignment fixture, and prepared for cementation of a femoral component. The femoral neck was cut about 1 cm above the lesser trochanter, the canal was broached for an Exeter implant, bottle-brush lavage with aggressive irrigation was used, and a distal plug was placed beyond the stem tip. To simulate endosteal bleeding conditions, the femur was immersed in a blood analog solution to just below the level of the cut. The blood analog was warmed to 37°C. Surgical bone cement (Simplex P, Stryker Corp., Mawah, NJ) was mixed in an ACM mixer (Stryker Instruments, Kalamazoo, MI) for 2 min with vacuum (−580 mm Hg) applied for the final 90 s. Cement was introduced to the canal in a retrograde fashion when the cement reached a viscosity of 1000 Pa-s, the mantle was then pressurized, and a PMMA replica Exeter stem was inserted when the cement reached a viscosity of 2000 Pa-s. A replica Exeter stem was used to allow for adequate cement for gripping following sectioning.
Following cement cure for 4 days in the blood analog, parallel-piped specimens were prepared by transverse sectioning of the femurs using a water-irrigated diamond-bladed saw with further sectioning to produce cement/bone composite specimens that were nominally 5 × 10 mm in cross-section. These specimens were further machined with an end mill to insure that the faces were orthogonal. A total of 21 specimens were prepared using this protocol.
Experimental Apparatus and Mechanical Testing
The mechanical testing apparatus consisted of a set of parallel grips housed in an environmental chamber into which the specimen was placed (Fig. 1). An LVDT was used to measure grip displacements. Loading was provided by a screw-driven machine in displacement control at 0.5 mm/min; force was measured by an in-line load cell. Prior to testing, a black enamel paint was used to provide contrast and texture for one specimen face containing cement and bone. A digital camera (Spot RT) with 8.9 micron/pixel resolution and telecentric lens was used to capture surface images during loading at a frequency of 4 Hz. The image resolution of the tests was lower than that used for crack damage imaging (described later) because the field of view was larger, encompassing the entire specimen and edge of grips. The loading and camera images were synched via a TTL signal from the camera. Specimens were placed in the environmental chamber at 37° C, which was filled with circulating calcium buffered saline, and was allowed to equilibrate for 10 min before testing.
Figure 1.
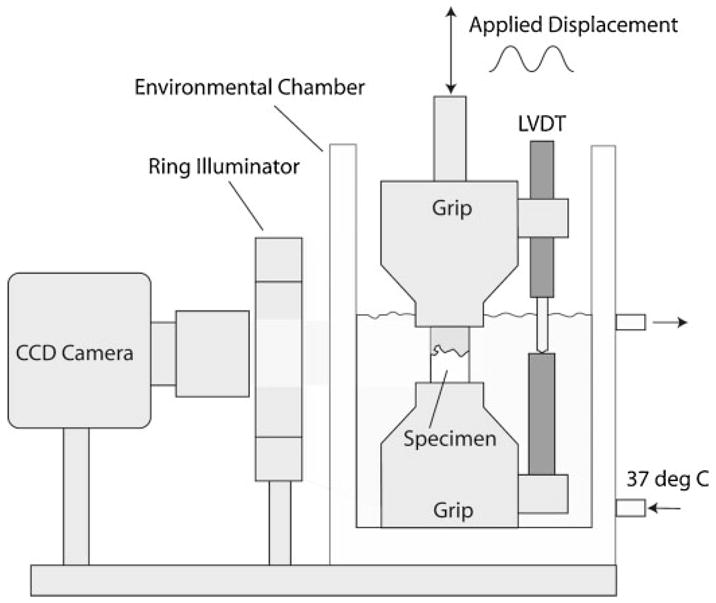
Schematic representation of the experimental setup used to capture deformation of cement/bone composites during mechanical loading.
The initial testing consisted of fully reversible tension–compression loading for 10 cycles to ± 0.01 mm based on grip-to-grip displacement. This magnitude was chosen based on pilot work to insure that permanent damage did not occur. On the 10th full loading cycle, images were obtained of the specimen face, resulting in about 90 frames of data. Following this test, specimens were loaded in uniaxial tension to failure, defined as a 50% drop in peak load. The goal was to impart substantial damage to the specimen, while still allowing it to remain intact for postprocessing.
Digital Image Correlation Analysis
Commercial digital image correlation (DIC) software (RapidCorrelator, Xstream Software, Ottawa, Ontario, Canada) was used to determine displacements of discrete zones of the cement/bone composite specimens during loading. Displacement fields at discrete locations [40 by 40 pixels (0.12 mm2) in Fig. 2] along the center line were determined. Relative displacements between adjacent markers were then calculated to indicate motion of the bone, contact interface, visible interdigitated region, and cement. At the contact interface, measurement squares were placed immediately above and below the interface. The RMS error for the DIC system using the LVDT as the standardized measurement device was 0.000395 mm. Visible interdigitated regions were not always evident on the image face. As such, displacements on the surface were measured at either four (11 specimens) or five (10 specimens) locations, depending on whether an interdigitated region was visible.
Figure 2.
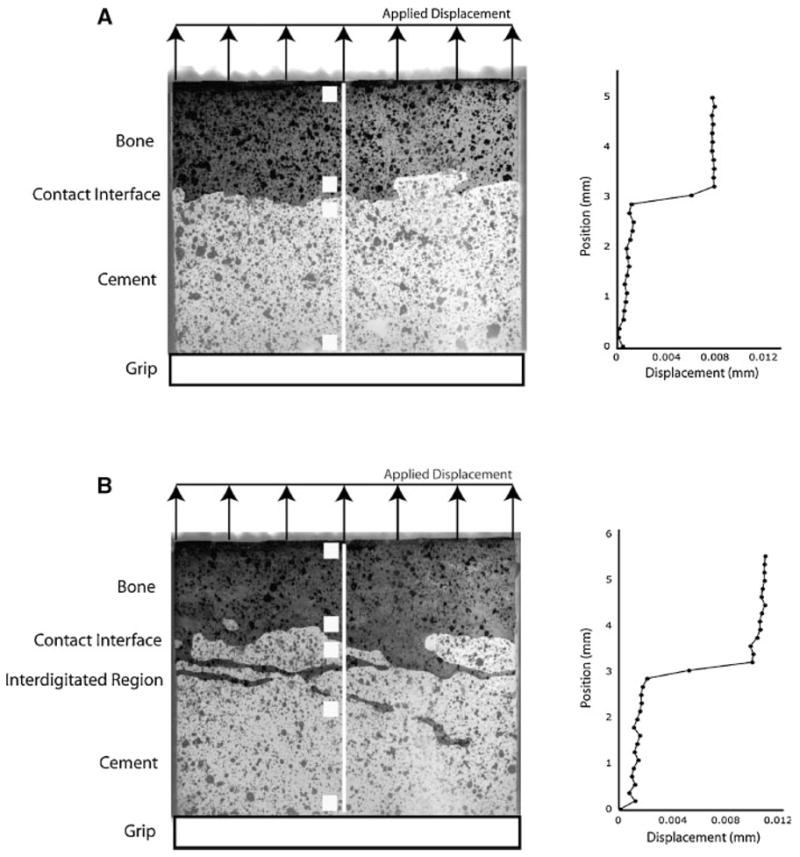
Digital images of specimens with contact interface (A) and interdigitated/contact interface regions (B) along the midline of the cement–bone interface. Graphs to the right represent vertical displacement fields along the white center line of the respective specimens with specimens loaded in tension (vertical direction). Sampling areas for digital image correlation measurements are shown as white squares indicating regions that span displacement measurements for bone, contact interface, interdigitated region, and cement.
Using the DIC data, the local motion of the contact interface/visible interdigitated region was quantified for the cyclic nondestructive testing in terms of tensile compliance, compressive compliance, creep displacement at 10th loading cycle, and span displacement at 10th loading cycle (Fig. 3). Apparent stress was calculated as force divided by cross-sectional area of the specimen. Strain was not determined because of material/interface discontinuities. For tensile tests to failure, yield strength was determined using a linear offset of 0.003 mm (Fig. 3). The displacement at yield, tensile strength, and displacement at tensile yield were also calculated.
Figure 3.
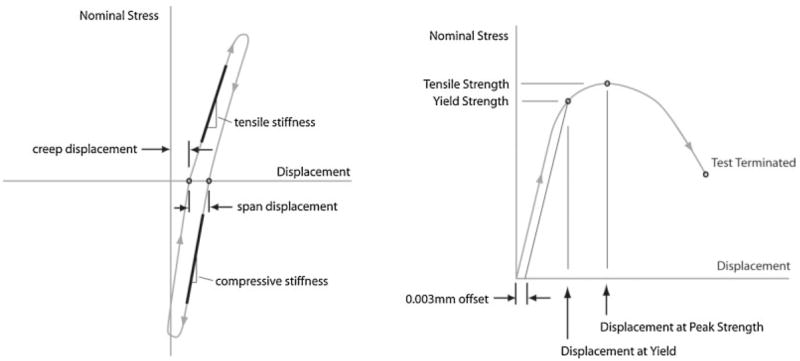
Descriptive measures for cyclic (left) tension–compression loading and single cycle tensile load-to-failure (right) experiments.
Specimen Microstructure Imaging
To document microstructure, specimens were scanned at 12 μ isotropic resolution using a microCT (55 kV/145 μA, Scanco μCT 40, SCANCO Medical AG, Basserdorf, Switzerland) prior to loading. Interface contact area was estimated using MIMICS solid modeling software (Fig. 4). First, cement and bone three-dimensional (3D) objects were created from the CT scan data by separately thresholding cement and bone regions based on CT gray scale intensity. The 3D cement object was then dilated by two voxels (24 μ), and the Boolean intersection between the cement and bone objects was determined. This volume was divided by the amount of the cement dilation operation (24 μ), resulting in an estimated contact area between cement and bone. This is only an estimate of contact area and is limited by the microCT resolution.
Figure 4.
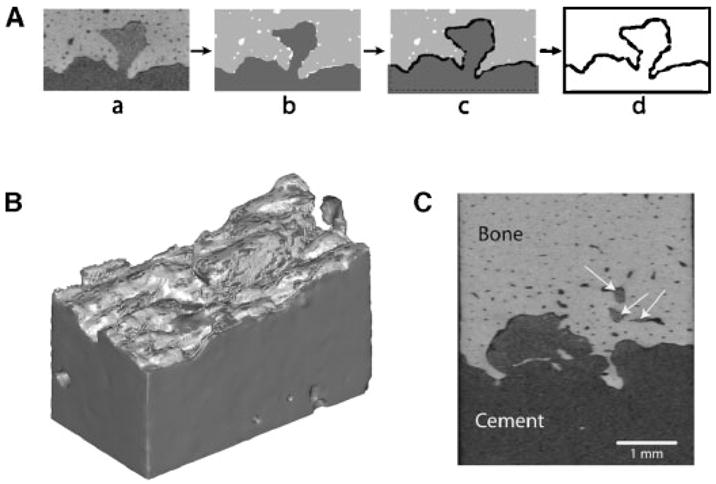
Approach used to estimate contact area between cement and bone (A): the initial microCT scan set (a) was segmented into cement and bone (b), followed by a region growing operation of the cement (c), and calculation of the Boolean intersection between cement and bone (d). A 3D reconstruction (B) of the cement (dark gray) and region of intersection with bone (light gray). Also illustrated (C) are regions of cement flow into lacunar scale spaces in the cortical bone (arrows).
Measures of Cement and Bone Damage
Prior to loading, to document initial bone damage, specimens were immersed in 0.1% calcein for 12 h followed by 10-min rinse in deionized water. Specimen surfaces were sanded to remove surface stain to reveal any microcracks. A fluorescent dye penetrant (Aquacheck, Sherwin Inc, South Gate, CA) was applied for 10 min followed by 10-min rinse. Epifluorescence imaging of all four specimen faces were collected at 5.8 μ resolution using a stereomicroscope with digital camera (Spot RT, Diagnostic Instruments, Sterling Hts., MI). Following loading, the staining and imaging process was repeated to document crack growth. Cracks in cement and bone were manually traced and measured (Image Pro, Media Cybernetics, Bethesda, MD) to document number, average length, and length sum of cracks for the four image surfaces. Crack measurements were divided into preexisting cracks (before loading), growth from preexisting cracks, new cracks, and total crack growth. Growth from preexisting cracks was defined as cracks extending from existing cracks or immediately adjacent to existing cracks. Crack numbers and average length were not calculated for the growth measures because cracks sometimes bifurcated from existing cracks and also grew diffusely adjacent to an existing crack. Images from the posttest specimens were superimposed over those from pretest specimens to differentiate between new and existing cracks.
Paired t-tests were used to determine if compliance was different in tension and compression. Linear regression analysis was used to determine relationships between interface compliance and strength, estimated interface contact area and strength, displacement at yield and yield strength, and compliance and contact area. Because compliance and contact area were not coupled, a stepwise regression was performed to determine if both compliance and contact area contributed to specimen strength. Finally, paired t-tests with Bonferroni corrections for multiple sampling were used to determine if crack damage quantified (the length sum measurements) was greater in the cement or bone.
RESULTS
The majority of the displacement during both tensile (83%) and compressive (64%) elastic loading occurred at the cement–bone interface (Table 1). A clear displacement jump or discontinuity between the cement and bone was indicated by the graphs of displacements along the center line of the specimens (Fig. 2). In regions where there was visible interdigitation (the central region of Fig. 2b), the displacement distribution became more complex with areas of displacement compatibility, indicating limited relative displacement between cement and bone.
Table 1.
Fraction of Total Displacement Attributed to Various Components of the Cement/Bone Composite Structure
| Component | Tension | Compression |
|---|---|---|
| Contact interface/interdigitated region | 0.83 (0.19) | 0.64 (0.28) |
| Cement | 0.07 (0.08) | 0.21 (0.20) |
| Bone | 0.11 (0.16) | 0.15 (0.17) |
Measurements taken at maximum tension/compression stress levels during cyclic loading. Mean values for 21 specimens (standard deviation in parentheses).
The tension/compression load-displacement response (Fig. 5) revealed hysteresis during the loading cycle. Displacements of bone and cement were small in comparison with the contact interface/interdigitation region and had relative displacements on the order of the RMS error of the DIC system. The total DIC excursions (from top of bone to base of cement) were lower in magnitude than the LVDT measurements, due to motion between the grips and the specimen and the outboard location of the LVDT that would exaggerate any off axis motion.
Figure 5.
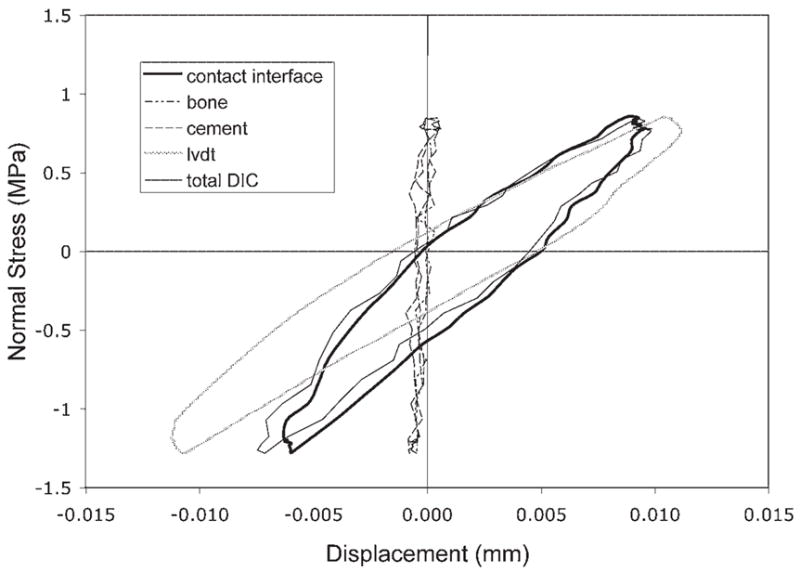
Example of cyclic nominal stress versus displacement response for the cement/bone composite structure. Total DIC displacement was measured from the top of the bone to the bottom of the cement and does not include the grips. The LVDT measurement indicates outboard displacements measured between the grips.
Specimens with surface evidence of a contact interface alone were delineated from those with a contact interface and an apparent interdigitated region (Table 2). All specimens had lower interface compliance in compression than in tension (p = 0.0001), and those with a visible interdigitated region were more compliant than those with only a contact interface (p = 0.049). For a 1 MPa applied stress, the mean opening and closing displacements across the interface were 0.0048 and 0.0036 mm, respectively. Limited creep deformation occurred between the 1st and 10th loading cycle (0.0008 mm), and hysteresis quantified using the span was about 0.003 mm.
Table 2.
Mechanical Response of the Contact Interface/Interdigitated Region for Nondestructive Tension/Compression Loading
| Test Parameter | Specimens Exhibiting Contact Interface (n = 11) | Specimens Exhibiting Interdigitated Region (n = 10) | All Specimens |
|---|---|---|---|
| Tensile compliance (mm/MPa) | 0.0049 (0.0027) | 0.0088 (0.0042) | 0.0067 (0.0039) |
| Compressive compliance (mm/MPa) | 0.0036 (0.0021) | 0.0067 (0.0034) | 0.0051 (0.0031) |
| 10th cycle creep (mm) | 0.0011 (0.0024) | 0.0006 (0.0025) | 0.0008 (0.0024) |
| 10th cycle span (mm) | 0.0026 (0.0013) | 0.0036 (0.0019) | 0.0031 (0.0017) |
Mean (standard deviation) values are shown.
The tensile strength of the specimens (Table 3) was negatively correlated with tensile interface compliance (r2 = 0.47, p = 0.0006), indicating that specimens with less motion at the interface were stronger. In addition, tensile strength and the contact area between cement and bone were positively correlated (r2 = 0.48, p = 0.0005). Interestingly, compliance and contact area measures were very weakly correlated (r2 = 0.096, p = 0.174). In a stepwise regression model, both interface compliance and contact area contributed to interface strength (r2 = 0.72, p <0.0001).
Table 3.
Mechanical Response of the Contact Interface/Interdigitated Region for Tensile Strength Tests
| Test Parameter | Specimens Exhibiting Contact Interface (n = 11) | Specimens Exhibiting Interdigitated Region (n = 10) | All Specimens |
|---|---|---|---|
| Yield strength (MPa) | 2.54 (1.14) | 1.92 (1.32) | 2.24 (1.24) |
| Tensile strength (MPa) | 3.38 (1.30) | 2.64 (1.45) | 3.03 (1.39) |
| Displacement at yield (mm) | 0.013 (0.003) | 0.016 (0.005) | 0.014 (0.004) |
| Displacement at tensile strength (mm) | 0.037 (0.014) | 0.046 (0.019) | 0.041 (0.017) |
Mean (standard deviation) values are shown.
Interface displacement at yield (0.014 mm ± 0.004 mm) was not a function of yield strength (r2 = 0.006, p = 0.737, Fig. 6), and this parameter exhibited a moderate coefficient of variation (0.3). The postyield response as measured by interface displacement at peak tensile strength (0.041 mm ± 0.017 mm) had a variance four times greater than was found for the displacement at yield. These findings suggest that interface displacement at yield could be used as a failure criterion, given that it was independent of specimen strength and exhibited low variability.
Figure 6.
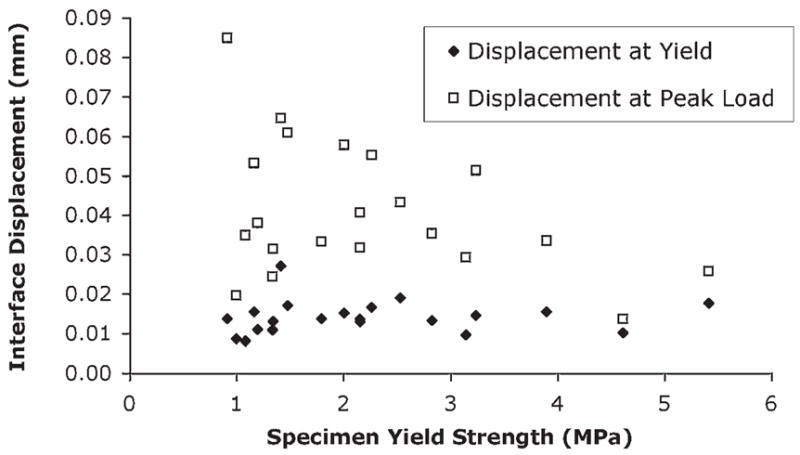
Displacement at yield and peak load as a function of specimen yield strength. The displacement at yield was not a function of yield strength (r2 = 0.006; p = 0.74) and had much less variability than displacement at peak load.
Significantly more preexisting damage was found in the cement than bone and more total crack growth occurred in the cement as measured by crack length sum (Table 4). While virtually none of the bone crack growth occurred from existing damage regions, 42% of the cement crack growth was from preexisting damage regions. Cracks were generally short (about 0.20 mm), but were more numerous in the cement compared to the bone.
Table 4.
Crack Number (N), Average Length, and Length Sum Measurements for Bone and Cement Microcracks
| Cement
|
Bone
|
||||||
|---|---|---|---|---|---|---|---|
| Type | Crack Number (N) | Average Length (mm) | Length Sum (mm) | Crack Number (N) | Average Length (mm) | Length Sum (mm) | p Value |
| Preexisting cracks | 33 (21) | 0.19 (0.05) | 6.22 (4.20) | 7 (6) | 0.17 (0.10) | 1.13 (1.02) | 0.003 |
| Growth from preexisting cracks | 2.30 (2.33) | 0.20 (0.43) | 0.003 | ||||
| New cracks | 25 (17) | 0.13 (0.04) | 3.30 (2.32) | 10 (5) | 0.26 (0.10) | 2.48 (1.36) | 0.129 |
| Total crack growth | 5.61 (3.49) | 2.68 (1.40) | 0.003 | ||||
Measurements were made for preexisting cracks (prior to loading), load-induced growth from preexisting cracks, and load-induced new cracks.
Total crack growth is the sum of growth from preexisting cracks and new cracks.
Data presented are means (standard deviations) for 21 specimens.
p Values represent Bonferroni corrected paired t-tests between cement and bone with correction for multiple sampling to test for differences in length sum.
DISCUSSION
Our results show that the actual contact interface is responsible for the majority of motion of cement–bone structures when subjected to tensile or compressive loading. This interface is more compliant in tension than in compression, but even in compression, considerable closing motion occurrs at the interface. To date, the compliance of the contact interface has not been considered in terms of modeling the load transfer in cemented implant applications.16,17 However, a simple exercise with a one-dimensional system can illustrate the potential relevance. Consider a 3-mm-thick cement mantle between stem and bone subjected to 1 MPa tensile load; a displacement of 1 μm would be attributable to the cement and nearly 5 μm attributable to the contact interface, based on our compliance measurements. Hence, inclusion of a realistic compliant interface is equivalent to reducing the cement modulus to 17% of a nominal level. Of course, load transfer is more complex than what is described here, but this clearly shows that micromotion at the contact interface can markedly affect the load transfer mechanism.
Our study has limitations including the lack of biological reaction due to polymerization heat, trauma, and monomer toxicity. Moreover, neither incorporation of a long-term response of the bone due to the presence of the cement material, nor adaptation to a new loading environment was considered. The contact interface could become either more or less compliant with time in vivo, depending on multiple factors. To assess this possibility, test samples from retrieved hip reconstructions should be tested and compared with our in vitro results. We believe that our samples were nevertheless representative of the immediate postoperative environment; care was taken to simulate initial conditions through realistic bony preparation, cementing technique, and simulated surgical environment.
An additional limitation was that the fatigue damage response of the interface was not considered. Creep damage was previously documented under fatigue loading, but how this is manifested at the cement–bone interface is unclear. The micro-crack generation in cement and bone as well as sliding and opening between cement and bone surfaces seen here under single-cycle failure loading may also occur under fatigue loading conditions. Additional experimental work is needed to delineate the role of micromechanical behavior and gross structural response under fatigue loading. In general, the cyclic loading response determined here, including hysteresis, should also occur in high-cycle fatigue tests.
That the strength of the cement–bone interface was correlated with the contact area between cement and bone was not surprising. Previous studies showed that interface strength can depend on appositional contact18 or amount of bone interdigitated with cement.19,20 The morphology and orientation of the trabecular bone adjacent to the interface likely play a role in the strength and compliance of the visible interdigitated regions. Further work is needed to quantify trabecular structure, particularly in high stress regions where failure would be expected. Interestingly, the apparent elastic modulus and strength of interdigitated cement/bone composites from vertebroplasty procedures was not a function of bone volume fraction, though a reduction in both strength and elastic modulus was noted when compared to bulk cement.21
Dividing specimens into two groups, those that exhibit a visible interdigitated region and those that did not, provides only an approximation of the complete structure of the interface. All specimens had interdigitation to some degree. Because only surface displacements could be determined, the 3D deformation through the specimen is unknown. However, specimens with documented interdigitation had greater compliance compared to specimens exhibiting only a contact interface. This is reasonable because specimens with interdigitated regions had more surface discontinuities between cement and bone compared to the contact interface cases. Tensile stiffness of a cement–bone construct is related to tensile strength.22 However, we showed that the opening motion at the interface was correlated with strength. The mechanism behind this relationship is unclear, but may be influenced by load transfer paths and relative interlock between cement and bone. This interlock was not quantified, other than contact area, but may relate to cement flow along the endosteal wall of the bone (Fig. 4). Further work to identify factors contributing to interface compliance will likely rely on computational modeling to understand load transfer mechanisms and the role of bone/cement morphology, in combination with improved quantification of the interlock. Micro-interlock may also occur on another level where bone grows in apposition with the cured cement. Skripitz and Aspenberg showed that the cement–bone tensile strength can reach 0.9 MPa for naturally cured cement against cortical bone compared to limited strength (0.07 MPa) of polished cement placed against cortical bone.23
Our ability to quantify apposition between cement and bone was limited by the resolution of the microCT scanner. Small interface gaps, about 1 to 2 voxels (12–24 μ) would likely not be detected due to partial volume effects in the thresholding operation. Because the dilation operation of the cement was 2 voxels, the estimated contact area will likely be high, thereby neglecting smaller gaps. Synchrotron source microCT may be capable of resolving submicron gaps, but was not available for our study. Even so, the potential for apposition between cement and bone was quantified and represents a reasonable representation of interdigitation.
Implementation of compliance to interface elements between cement and bone in finite element models using these new measures would not be difficult and could account for differences in tensile and compressive compliance.24,25 Two components of additional compliance might be needed: one for the contact interface and one for the interdigated region. A displacement-based damage model could be implemented, which is appealing because displacement at yield was independent of interface strength. However, further work is needed with fatigue loading to develop a comprehensive damage model.
For our loading regime, damage occurred to both bone and cement. Interestingly, there was an appreciable amount of pretest damage to the cement possibly due to high residual stresses from shrinkage upon curing.26 Pretest damage was recorded previously in laboratory-prepared cemented components.27 Additional damage might have been induced from specimen preparation. However, bulk cement subjected to cutting does not exhibit such damage.27 The load-induced damage occurred about 40% of the time from regions that had previously been damaged. The high prevalence of new damage from regions with existing damage suggests that residual stress-induced damage may be an important contributor to interface failure.
Interface motions on the order of 5 μ for a nominal 1 MPa load across the interface28 suggests that the interface can serve as a conduit for submicron size particles and as a mechanism to generate fluid pressures. Massin and colleagues29 showed that polyethylene particles can migrate around nonloosened cemented femoral components to the distal end of the mantle and suggested that they progress through porosity in cancellous bone. Particles might also move along the interface, aided by fluid motion upon loading. Local pressure generation is also possible at the interface given the conformity between cement and bone. Pressure related bone loss is well documented.30,31 The combination of fluid pressure, interface motion, and potential for the interface to act as a conduit for particles may lead to an osteolytic response.
In summary, (1) the vast majority (up to 83%) of the total motion is localized at the contact interface between cement and bone, (2) the interface compliance is higher in tension than in compression, (3) under tensile loading, the interface compliance is inversely proportional to the strength but only weakly correlated with contact area and, in addition, the strength is higher with increasing contact area, and (4) when loaded to failure most crack growth is in the cement rather than in the bone.
Acknowledgments
This work was funded by the NIH grant AR42017-11. Cement was donated by Stryker Orthopaedics.
References
- 1.Mjoberg B. Loosening of the cemented hip prosthesis. The importance of heat injury. Acta Orthop Scand Suppl. 1986;221:1–40. [PubMed] [Google Scholar]
- 2.Garcia OG, Mombiela FL, De La Fuente CJ, et al. The influence of the size and condition of the reamers on bone temperature during intramedullary reaming. J Bone Joint Surg [Am] 2004;86:994–999. doi: 10.2106/00004623-200405000-00016. [DOI] [PubMed] [Google Scholar]
- 3.Lu JX, Huang ZW, Tropiano P, et al. Human biological reactions at the interface between bone tissue and polymethylmethacrylate cement. J Mater Sci Mater Med. 2002;13:803–809. doi: 10.1023/a:1016135410934. [DOI] [PubMed] [Google Scholar]
- 4.Paul HA, Bargar WL. Histologic changes in the dog acetabulum following total hip replacement with current cementing techniques. J Arthroplasty. 1987;2:71–76. doi: 10.1016/s0883-5403(87)80033-5. [DOI] [PubMed] [Google Scholar]
- 5.Gruen TA, McNeice GM, Amstutz HC. Modes of failure” of cemented stem-type femoral components: a radiographic analysis of loosening. Clin Orthop. 1979;141:17–27. [PubMed] [Google Scholar]
- 6.Karrholm J, Borssen B, Lowenhielm G, et al. Does early micromotion of femoral stem prostheses matter? 4–7-year stereoradiographic follow-up of 84 cemented prostheses. J Bone Joint Surg [Br] 1994;76:912–917. [PubMed] [Google Scholar]
- 7.Morberg PH, Johansson CB, Reigstad A, et al. Vital staining of bone in stable retrieved femoral surface replacement prostheses. J Arthroplasty. 2001;16:1004–1009. doi: 10.1054/arth.2001.27255. [DOI] [PubMed] [Google Scholar]
- 8.Jasty M, Maloney WJ, Bragdon CR, et al. Histomorphological studies of the long-term skeletal responses to well fixed cemented femoral components. J Bone Joint Surg [Am] 1990;72A:1220–1229. [PubMed] [Google Scholar]
- 9.Sundfeldt M, Carlsson LV, Johansson CB, et al. Aseptic loosening, not only a question of wear: a review of different theories. Acta Orthop. 2006;77:177–197. doi: 10.1080/17453670610045902. [DOI] [PubMed] [Google Scholar]
- 10.Balu GR, Noble PC, Alexander JW, et al. The effect of intramedullary reaming on the strength of the cement/bone interface. Trans Orthop Res Soc. 1994;19:797. [Google Scholar]
- 11.Bugbee WD, Barrera DL, Lee AJC, et al. Variations in shear strength of the bone-cement interface in the proximal femur. Trans Orthop Res Soc. 1992;17:22. [Google Scholar]
- 12.Dohmae Y, Bechtold JE, Sherman RE. Reduction in cement-bone interface shear strength between primary and revision arthroplasty. Clin Orthop. 1988;236:214–240. [PubMed] [Google Scholar]
- 13.MacDonald W, Swarts E, Beaver R. Penetration and shear strength of cement-bone interfaces in-vivo. Clin Orthop. 1993;286:283–288. [PubMed] [Google Scholar]
- 14.Stone JJ, Rand JA, Chiu EK, et al. Cement viscosity affects the bone-cement interface in total hip arthroplasty. J Orthop Res. 1996;14:834–837. doi: 10.1002/jor.1100140523. [DOI] [PubMed] [Google Scholar]
- 15.Race A, Miller MA, Clarke MT, et al. The effect of low-viscosity cement on mantle morphology and femoral stem micromotion: a cadaver model with simulated blood flow. Acta Orthop. 2006;77:6007–6616. doi: 10.1080/17453670610012683. [DOI] [PubMed] [Google Scholar]
- 16.Janssen D, Aquarius R, Stolk J, et al. Finite-element analysis of failure of the Capital Hip designs. J Bone Joint Surg [Br] 2005;87:1561–1567. doi: 10.1302/0301-620X.87B11.16358. [DOI] [PubMed] [Google Scholar]
- 17.Jeffers JR, Browne M, Lennon AB, et al. Cement mantle fatigue failure in total hip replacement: Experimental and computational testing. J Biomech. 2007;40:1525–1533. doi: 10.1016/j.jbiomech.2006.07.029. [DOI] [PubMed] [Google Scholar]
- 18.Miller MA, Race A, Gupta S, et al. The role of cement viscosity on cement-bone apposition and strength an in vitro model with medullary bleeding. J Arthroplasty. 2007;22:109–116. doi: 10.1016/j.arth.2006.02.076. [DOI] [PubMed] [Google Scholar]
- 19.Graham J, Ries M, Pruitt L. Effect of bone porosity on the mechanical integrity of the bone-cement interface. J Bone Joint Surg [Am] 2003;85:1901–1908. doi: 10.2106/00004623-200310000-00006. [DOI] [PubMed] [Google Scholar]
- 20.Mann KA, Ayers DC, Werner FW, et al. Tensile strength of the cement-bone interface depends on the amount of bone interdigitated with PMMA cement. J Biomech. 1997;30:339–346. doi: 10.1016/s0021-9290(96)00164-9. [DOI] [PubMed] [Google Scholar]
- 21.Race A, Mann KA, Edidin AA. Mechanics of bone/PMMA composite structures: an in vitro study of human vertebrae. J Biomech. 2007;40:1002–1010. doi: 10.1016/j.jbiomech.2006.04.003. [DOI] [PubMed] [Google Scholar]
- 22.Kim D-G, Miller MA, Mann KA. Creep dominates tensile fatigue damage of the cement-bone interface. J Orthop Res. 2004;22:633–640. doi: 10.1016/j.orthres.2003.09.007. [DOI] [PubMed] [Google Scholar]
- 23.Skripitz R, Aspenberg P. Attachment of PMMA cement to bone: force measurements in rats. Biomaterials. 1999;20:351–356. doi: 10.1016/s0142-9612(98)00175-6. [DOI] [PubMed] [Google Scholar]
- 24.Moreo P, Perez MA, Garcia-Aznar JM, et al. Modelling the mixed-mode failure of cement-bone interfaces. Eng Fracture Mech. 2006;73:1379–1395. [Google Scholar]
- 25.Waide V, Cristofolini L, Stolk J, et al. Modeling the fibrous tissue layer in cemented hip replacements: experimental and finite element methods. J Biomech. 2004;37:13–26. doi: 10.1016/s0021-9290(03)00258-6. [DOI] [PubMed] [Google Scholar]
- 26.Lennon AB, Prendergast PJ. Residual stress due to curing can initiate damage in porous bone cement: experimental and theoretical evidence. J Biomech. 2002;35:311–321. doi: 10.1016/s0021-9290(01)00216-0. [DOI] [PubMed] [Google Scholar]
- 27.Race A, Miller MA, Ayers DC, et al. Early cement damage around a femoral stem is concentrated at the cement/bone interface. J Biomech. 2003;36:489–496. doi: 10.1016/s0021-9290(02)00460-8. [DOI] [PubMed] [Google Scholar]
- 28.Chang PB, Mann KA, Bartel DL. Cemented femoral stem performance: effects of proximal bonding, geometry, and neck length. Clin Orthop. 1998;355:57–69. [PubMed] [Google Scholar]
- 29.Massin P, Viguier E, Flautre B, et al. Migration of polyethylene debris along well-fixed cemented implants. J Biomed Mater Res B Appl Biomater. 2004;68:140–148. doi: 10.1002/jbm.b.10072. [DOI] [PubMed] [Google Scholar]
- 30.Aspenberg P, Van der Vis H. Migration, particles, and fluid pressure. A discussion of causes of prosthetic loosening. Clin Orthop. 1998;352:75–80. [PubMed] [Google Scholar]
- 31.Astrand J, Skripitz R, Skoglund B, et al. A rat model for testing pharmacologic treatments of pressure-related bone loss. Clin Orthop. 2003;409:296–305. doi: 10.1097/01.blo.0000052938.71325.46. [DOI] [PubMed] [Google Scholar]


