

Abstract
Gastric epithelial cells liberate prostaglandin E2 in response to cytokines as part of the process of healing of gastric lesions. Treatment of the rat gastric epithelial cell line RGM1 with transforming growth factor-α and interleukin-1β leads to synergistic release of arachidonate and production of prostaglandin E2. Results with highly specific and potent phospholipase A2 inhibitors and with small interfering RNA show that cytosolic phospholipase A2-α and group IIA secreted phospholipase A2 contribute to arachidonate release from cytokine-stimulated RGM1 cells. In the late phase of arachidonate release, group IIA secreted phospholipase A2 is induced (detected at the mRNA and protein levels), and the action of cytosolic phospholipase A2-α is required for this induction. Results with RGM1 cells and group IIA secreted phospholipase A2-transfected HEK293 cells show that the group IIA phospholipase acts prior to externalization from the cells. RGM1 cells also express group XIIA secreted phospholipase A2, but this enzyme is not regulated by cytokines nor does it contribute to arachidonate release. The other eight secreted phospholipases A2 were not detected in RGM1 cells at the mRNA level. These results clearly show that cytosolic and group IIA secreted phospholipases A2 work together to liberate arachidonate from RGM1 cell phospholipids in response to cytokines.
There is current interest in phospholipases A2 (PLA2)2 because of their involvement in the liberation of arachidonic acid from membrane phospholipids for the biosynthesis of the eicosanoids (prostaglandins, leukotrienes, and others). There is general consensus that cytosolic PLA2 (cPLA2-α, also known as group IVA PLA2) plays a critical role in arachidonic acid release in mammalian cells (1, 2). For example, studies in mice have shown that disruption of the gene coding for cPLA2-α eliminates or greatly reduces arachidonic acid release in a number of cells, including agonist-stimulated macrophages and neutrophils (3–6).
The mouse and human genomes also contain genes encoding 10 distinct secreted PLA2s (sPLA2s) (7, 8) suggesting multiple physiological functions for sPLA2s. The role of these enzymes in promoting arachidonic acid release in mammalian cells is much less clear than for cPLA2-α and is under active investigation. In mouse blood platelets, disruption of the cPLA2-α gene leads to a significant reduction in the amount of thromboxane release when collagen is the agonist but not when cells are triggered with ATP, suggesting that another PLA2 could be involved in arachidonate release (9). In mouse peritoneal macrophages, it has been shown recently that disruption of the group V sPLA2 gene leads to an ~ 50% reduction in zymosan-stimulated leukotriene C4 and prostaglandin E2 (PGE2) production (10), yet in the same cell/agonist system disruption of the cPLA2-α gene nearly completely abrogates eicosanoid generation (5). This demonstrates that there is coordinate action between sPLA2 and cPLA2-α in mammalian cells. This has also been observed in mouse mesangial cells and human embryonic kidney cells (HEK293) transfected with various sPLA2s (11, 12) and in human neutrophils treated with exogenously added group V sPLA2 (13). The molecular basis for this sPLA2-cPLA2-α coordinate action is unknown.
In our recent studies of arachidonate release in transfected HEK293 cells, we found that forcible overexpression of group IIA sPLA2 led to arachidonate release, that the sPLA2 was acting prior to externalization from the cell, and that highly specific cPLA2-α inhibitors significantly reduced arachidonate release showing that this latter enzyme was also involved (12). Key observations were that exogenously added human group IIA sPLA2 was inefficient at liberating arachidonate and that the cell-impermeable and potent group IIA sPLA2 inhibitor Me-indoxam (Fig. 1) was not able to reduce arachidonate release. The results of this recent study (12) are inconsistent with the earlier model proposed for the action of group IIA sPLA2 in transfected HEK293 cells in which the enzyme is first secreted into the extracellular medium where it binds to cell surface proteoglycan and finally is internalized into caveolae-like compartments where it acts on membrane phospholipid to liberate arachidonate (14). We also showed that Me-indoxam fails to block arachidonate release in zymosan-stimulated mouse peritoneal macrophages and in agonist-stimulated p388D1 macrophage-like cells (12) despite convincing evidence that group V sPLA2, a Me-indoxam-sensitive enzyme, augments arachidonate release in mouse macrophages (10). This again suggests that the sPLA2 acts prior to release from these cells (12).
FIGURE 1.

cPLA2-α and sPLA2 inhibitor structures.
Based on our findings with Me-indoxam described above, we were intrigued by the report of Akiba et al. (15) that the sPLA2 inhibitor indoxam, which is structurally similar to Me-indoxam (Fig. 1), blocks PGE2 generation in a rat gastric mucosa cell line (RGM1) stimulated with TGF-α and IL-1β. As pointed out by Akiba et al. (15) RGM1 cells produce PGE2 via cyclooxygenase-2 when stimulated by TGF-α. The latter is known to induce the proliferation of gastric epithelial cells as part of the gastric lesion wound healing process (16). Also, PGE2 generated in gastric cells, including epithelial cells and fibroblasts, promotes healing of gastric mucosal lesions and the maintenance of gastric mucosal integrity as shown by several studies (for example see Ref. 17). More recent studies by Akiba et al. (15) showed that IL-1β synergizes with TGF-α to elicit PGE2 production from RGM1 cells and that this cytokine may also be involved in healing of gastric lesions through generation of PGE2.
We now report additional studies on the production of arachidonate and PGE2 from RGM1 cells, with particular focus on the use of cell-permeable and cell-impermeable sPLA2 inhibitors. In addition, we studied the coordinate action between sPLA2 and cPLA2-α in these cells. Finally, we have carried out additional studies with group IIA sPLA2-transfected HEK293 cells that provide further evidence that the sPLA2 acts prior to release from the cells. Similarities were found for the coordinate action of group IIA sPLA2 and cPLA2-α in transfected HEK293 cells and in nontransfected RGM1 cells.
EXPERIMENTAL PROCEDURES
Materials
[3H]Arachidonic acid is from PerkinElmer Life Sciences. Fatty acid free bovine serum albumin is from Sigma (catalog number A6003). Recombinant human IL-1β and TGF-α are from R & D Systems (catalog numbers 201-LB-005 and 239-A-100). IL-1β and TGF-α stock solutions were made according to the manufacturer’s recommendation. Sterile phosphate-buffered saline containing 0.1% bovine serum albumin was used to prepare a stock solution of 10 ng/μl of IL-1β, and 10 mM acetic acid containing 0.1% bovine serum albumin was used to prepare a stock solution of 50 ng/μl of TGF-α. Recombinant rat group IIA sPLA2 was obtained as a gift from M. Janssen (University of Utrecht, The Netherlands) (18). RGM1 cells were obtained from the Riken Cell Bank (cell number RCB0876) with permission from Dr. Hirofumi Matsui (University of Tsukuba). The preparation of anti-mouse group IIA sPLA2 antiserum will be described elsewhere. Wyeth-1 was prepared as described (19), and its structure and purify were confirmed by reverse-phase high pressure liquid chromatography, 1H NMR, and electrospray ionization mass spectrometry (not shown). Pyrrolidine-2 (also known as pyrrophenone), Me-indoxam, and indoxam were prepared as described (12, 20, 21) and characterized as for Wyeth-1.
Cell Culture
RGM1 cells were maintained in DMEM/F-12 medium (catalog number 11320–033, Invitrogen) containing 20% heat-inactivated, fetal bovine serum, 100 units/ml penicillin, and 100 μg/ml streptomycin (22) in plastic dishes in a humidified atmosphere of 5% CO2 at 37 °C. Cells were routinely split with trypsin/EDTA.
Arachidonate Release and PGE2 Production
Cells were plated at 2 × 10⁵ cells/well in 24-well plates in DMEM/F-12 containing 20% FBS and were allowed to adhere for 5–7 h. The medium was replaced with serum-free DMEM/F-12 containing 0.01% fatty acid-free bovine serum albumin and 0.1 μCi/ml [3H]arachidonic acid and incubated for 20–24 h. The labeled cells were covered with 1 ml of DMEM/F-12 containing 0.01% fatty acid-free bovine serum albumin. After about 10 min, the medium was removed. For time course experiments, the labeled cells were covered with 0.5 or 1 ml of DMEM/F-12 medium containing 5 ng/ml IL-1β, 100 ng/ml TGF-α, or their combination for the desired time period (0, 12, and 24 h). For the experiment to check cPLA2-α and sPLA2 inhibitors, recombinant rat group IIA sPLA2 or heparin, the labeled cells were covered with 0.5 or 1 ml of DMEM/F-12 medium containing the combination of 5 ng/ml IL-1β and 100 ng/ml TGF-α in the absence or presence of various concentrations of cPLA2-α and sPLA2 inhibitors or heparin for 24 h. In studies with exogenously added recombinant rat group IIA sPLA2, cytokines were omitted in some studies. As noted under “Results,” cPLA2-α and sPLA2 inhibitors were added either at the time of cytokine addition or added 12 h after the addition of cytokines. In both cases, arachidonate release was measured 24 h after the addition of cytokines.
The medium was removed and centrifuged for 7 min at 3,000 rpm to pellet any dislodged cells. A 0.25- or 0.5-ml aliquot of the supernatant was submitted to scintillation counting. Trypsin/EDTA (0.5 ml) was added to the cell pellet in the well, and the plate was placed in the incubator for about 30 min. The cells were resuspended by pumping the solution up and down several times with a pipette, and all of the liquid was submitted to scintillation counting to give the cell-associated counts/min. The percentage of [3H]arachidonate release to the medium was calculated as 100 × (dpm in medium)/(dpm in medium + cell-associated dpm) (12).
For PGE2 production measurements, cells were plated at 1 × 10⁶ cells/well in 6-well plates in DMEM/F-12 containing 20% FBS, and allowed to adhere for 5–7 h. The medium was replaced with serum-free DMEM/F-12 containing 0.01% fatty acid-free bovine serum albumin and 1 μCi/ml [3H]arachidonic acid and incubated for 20–24 h. The labeled cells were washed two times with DMEM/F-12 containing 0.01% fatty acid-free bovine serum albumin and a further time with DMEM/F-12. The labeled cells were covered with 1 ml of DMEM/F-12 medium containing 5 ng/ml IL-1β and 100 ng/ml TGF-α in the absence or presence of various cPLA2-α or sPLA2 inhibitors for 24 h. For PGE2 analysis, 1 ml of culture medium was centrifuged to pellet any dislodged cells, and 0.8 ml of supernatant was mixed with 0.2 ml of 2 mM aqueous EDTA (adjusted to pH 3.0 with HCl). Lipids were extracted twice with 2 ml of ethyl acetate, and ethyl acetate was evaporated under a nitrogen stream. Samples were spotted onto a aluminum-back silica gel plate (20 × 20 cm) with small amounts of ethyl acetate and separated by thin layer chromatography using the upper phase of ethyl acetate/isooctane/acetic acid/H2O (9:5:2:10, v/v) (15, 28). Authentic PGE2 was added to each sample before spotting, and the plate was placed in a glass tank containing I2 to visualize the PGE2-containing plate region. The appropriate regions of the plate were removed with scissors, and the slices were added to scintillation fluid in a vial for liquid scintillation counting.
Quantification of sPLA2 Activity
Cells were plated at 1 × 10⁶ cells/well in 6-well plates in DMEM/F-12 containing 20% FBS and allowed to adhere for 5–7 h. The medium was replaced with serum-free DMEM/F-12 containing 0.01% fatty acid-free bovine serum albumin, and cells were incubated for 20–24 h. For time course experiments, the cells were covered with 1 ml of DMEM/F-12 medium containing 5 ng/ml IL-1β and 100 ng/ml TGF-α for 0, 12, or 24 h. For 24 h inhibition experiments, the cells were covered with 1 ml of serum-free DMEM/F-12 containing 5 ng/ml of IL-1β and 100 ng/ml of TGF-α in the presence or absence of various concentrations of sPLA2 or cPLA2-α inhibitors for 24 h. The sPLA2 activity was measured using the fluorometric assay using 50 μl of culture medium as described previously (12). The assay was calibrated with a standard amount of recombinant rat group IIA sPLA2 (23). In some studies we also measured the sPLA2 activity in cells after lysis with the same lysis buffer used for Western blotting (see below).
Immunoprecipitation and Western Blotting
Protein A-Sepharose slurry (50 μl; catalog number 17-0780-01, Amersham Biosciences) was incubated with 10 μl of antiserum against mouse group IIA sPLA2 or preimmune serum in phosphate-buffered saline for 2 h with gentle shaking on ice. The gel was pelleted and washed six times with phosphate-buffered saline. Culture medium (100 μl) was incubated with 5 μl of washed protein A-Sepharose (containing either preimmune, immune serum, or nothing), and the solution was gently shaken for 4 h on ice. The sample was centrifuged, and 50 μl of supernatant was subjected to the fluorometric sPLA2 assay.
For detection of cPLA2-α by Western blotting, RGM1 cells were treated with cytokines as above and then washed three times with ice-cold phosphate-buffered saline and scraped into ice-cold buffer (50 mM Hepes, 150 mM NaCl, 1 mM EGTA, 1 mM EDTA, 10% glycerol, 1% Triton X-100, 1 mM phenylmethylsulfonyl fluoride, 10 μg/ml aprotinin, 10 μg/ml leupeptin). The lysate was centrifuged at 16,000 rpm at 4 °C for 15 min, and the supernatant was used for Western blot analysis. Each lane of the 10% SDS-polyacrylamide gel was loaded with 40 μg of cell protein (Bio-Rad Bradford assay). Proteins in the gel were electrotransfered to a nitrocellulose membrane, and the membrane was blocked overnight at 4 °C with 5% (w/v) milk protein in buffer (per liter, 3 g of Tris, 8 g of NaCl, 0.2 g of KCl, 1 ml of Tween 20, pH 7.4). The membrane was probed with anti-cPLA2-α polyclonal IgG (1:5,000 dilution; catalog number Sc-438, Santa Cruz Biotechnology), and detection was carried out with ECL (Amersham Biosciences).
RNA Purification and Quantitative PCR
Cells were plated at 1 × 10⁶ cells/well in 6-well plates and were stimulated with TGF-α and IL-1β in the absence or presence of various concentrations of cPLA2-α or sPLA2 inhibitors for 24 h (see above for stimulation and inhibition procedures). Total RNA was extracted using an SV total RNA isolation kit (catalog number Z3100, Promega) according to the manufacturer’s instructions. Total RNA (1 μg, based on the absorbance at 260 nm) was reverse-transcribed with the first-strand cDNA synthesis system for quantitative RT-PCR kit (catalog number 11801-025, Marligen Biosciences) following the manufacturer’s protocol. Real time PCR was carried out on a DNA Engine Opticon 2 real time PCR detection system (MJ Research, Inc.) using a DyNAmo SYBR Green qPCR kit (catalog number F-400L, Finnzymes) following the manufacturer’s instructions.
PCR primers are as follows (numbers in parentheses are the expected length in base pairs for the PCR product): group IB (139), TGCTACAATCAGGCCAAGAAGCTG and TGCAGATGAAGCTCTCACAGTCGT; group IIA (117), CTATGGCTTCTACGGTTGCCATTGTG and CATCCACGTTTCTCCAGACGGTTGTA; group IIC (133), ATTCCTGCCCTGGAATCAGACCAT and TCTTGCCTCCACCTCTCAAATGCT; group IID (104), TGGCCTTGATGATGTCCTCTTGGT and AGGCCCAGAAAGACCAGAGTTTGA; group IIE (130), ATTCCTCTCCTGCAAACCCATCCT and TTAGGGTCTTGTGAGCGCTGTTGA; group IIF (127), AGGGTTCAGGAAGAAGGTGTTGGT and CAGGACTGCGATGGCGAAGAATTT; group III (147), CGTGTGGAACCCGACTCAATACAA and AGCCCAGGAAGCTGATGTAGACAA; group V (124), TCTGGAACCCAACTGCCATTACCA and TGGTGTTCTTCTCGCCTCGTGAAT; group X (137), TGCCATTGACTGGTGCTGCTACTA and ATTTGTTCTCTGCCGGTCCACACA; group XIIA (133), GCTGCGTGTTGGTGTCGTTATGAA and AAACCAAGGCAGCTTTAGGCTGTG; and GAPDH (141), TGACTCTACCCACGGCAAGTTCAA and ACGACATACTCAGCACCAGCATCA.
For each target gene, different primer concentrations and annealing temperatures were tested to optimize PCR amplification and to reduce the possible formation of primer-dimers. In all cases the optimal primer concentration was 200 nM. Thermal cycling parameters were as follows: 10 min at 95 °C for initial denaturation followed by 36 cycles (94 °C for 10 s, 64 °C for 20 s, 72 °C for 10 s, temperature ramp to 79 °C over 1 s followed by fluorescence data collection at 79 °C). After the last cycle, the sample was heated at 72 °C for 7 min for final extension and then submitted to a melting curve analysis to check for the formation of primer-dimers and nonspecific products. The temperature of 79 °C for data collection is below the Tm of products and above the Tm of possible primer-dimers; this helps to eliminate detection of primer-dimers. Each measurement was run in duplicate. PCR efficiencies for target and reference genes (GAPDH) were determined by generating a standard curve using serial dilutions of cDNA. Real time PCR data were analyzed using a relative quantification method as described previously (24). Briefly, the relative expression ratio of a target gene is calculated based on PCR efficiency and threshold cycle deviation of an unknown sample versus a calibrator (12 h of cells without stimulation), which was normalized to the reference gene (GAPDH). After quantitative PCR analysis, a portion of the amplification products was separated by electrophoresis on a 3% ultra-agarose gel (catalog number 15510-019, Invitrogen).
Caco-2 Permeability Studies
Permeability of Me-indoxam and indoxam across tight monolayers of Caco-2 cells was measured as described previously (12).
RNA Interference Studies
Stealth small interfering RNA (siRNA) duplex against cPLA2-α (sense, 5′-AUCCGAUGGACCCAACUUGCUUGGU-3′; antisense, 5′-ACCAAGCAAGUUGGGUCCAUCGGAU-3′) and rat group IIA sPLA2 (sense, 5′-GCCUUCUGGAGUUUGGGCAAAUGAU-3′; antisense, AUCAUUUGCCCAAACUCCAGAAGGC) were synthesized by Invitrogen. Validated Stealth negative control RNAi duplex with medium GC content (catalog number 12935-300, Invitrogen,) was used as control. The transfection efficiency was monitored using fluorescent RNA duplex (catalog number 13750070, Invitrogen). Eighty nM of Stealth siRNA was transfected into cells using Lipofectamine 2000 reagent (catalog number 13750070, Invitrogen) according to the manufacturer’s instructions. For arachidonate release experiments, 1 × 10⁵ cells were plated into 24-well plates, and cells were incubated in DMEM/F-12 medium containing 20% FBS for 24 h. The medium was replaced with serum-free DMEM/F-12 medium containing siRNA-Lipofectamine complex. After 6 h post-transfection, the medium was replaced with serum-free DMEM/F-12 containing 0.01% fatty acid-free bovine serum albumin and 0.1 μCi/ml [3H]arachidonic acid, and cells were incubated for 20–24 h. For sPLA2 activity assays or preparation of cell lysates for Western blot, 3 × 10⁵ cells were plated into 6-well plates, and cells were incubated in DMEM/F-12 medium containing 20% FBS for 24 h. The medium was replaced with DMEM/F-12 medium containing siRNA-Lipofectamine complex. After 6h post-transfection, the medium was replaced with DMEM/F-12 containing 20% FBS for another 20–24 h. The cells were made quiescent using serum-free DMEM/F-12 containing 0.01% fatty acid-free bovine serum albumin for 16–20 h followed by TGF-α/IL-1β treatment.
Studies with HEK293 Cells
HEK293 cells stably transfected with human group IIA sPLA2 were cultured and labeled with [3H]arachidonic acid as described previously (12). After labeling the cells with 0.1 μCi of [3H]arachidonic acid per well for 18–24 h, the medium was removed, and the cells were covered with complete medium containing 15 μg/ml brefeldin A or Me2SO vehicle. The cells were incubated at 37 °C with 5% CO2 for 1 h and then the medium was removed, and the cells were covered with complete medium containing 1 mg/ml heparin (catalog number H3149, Sigma) with brefeldin A or with vehicle. After incubation as above for 30 min, the medium was removed, and cells were washed twice with complete medium without heparin and with brefeldin A or vehicle and then covered with complete medium with brefeldin A or vehicle. Finally, the cells were covered with complete medium containing 2 ng/ml IL-1β (added from a 0.1 ng/μl stock in phosphate-buffered saline, 0.2% bovine serum albumin (catalog number A6003, Sigma)) and with brefeldin A or vehicle. After incubation as above for 4 h, the medium was removed and centrifuged at 3,000 rpm in a table top centrifuge for 7 min. A 500-μl aliquot of the supernatant was submitted to scintillation counting. 0.5 ml of trypsin/EDTA was added to the remaining cell layer, and the cells were incubated 30 min as above, and the cell suspension was submitted to scintillation counting. The percent [3H]arachidonate release is obtained as 100 times the total tritium in the culture medium divided by total tritium (culture medium + cell-associated). In some studies, cells were washed with high salt-containing medium to remove extracellular sPLA2 prior to brefeldin A treatment. In this case, the above procedure was used except that heparin was replaced with 1 M NaCl.
To measure secretion of human group IIA sPLA2, cells were cultured, pretreated with brefeldin A or vehicle, and pretreated with heparin (or 1 M NaCl) in complete medium as for the arachidonate release studies. After removing the heparin-containing medium, cells were covered with complete medium containing 2 ng/ml IL-1β and with 15 μg/ml brefeldin A or vehicle. After incubation for 4 h, a 200-μl aliquot of the cultured medium was withdrawn and centrifuged as above, and the supernatant was submitted to the fluorometric sPLA2 assay (12). The remaining medium was removed, and the cells were covered with complete medium containing 1 mg/heparin (or 1 M NaCl) with brefeldin A or with vehicle. After incubation for 30 min, a 200-μl aliquot of medium was removed, centrifuged, and submitted to the fluorometric sPLA2 assay.
RESULTS
Studies with RGM1 Cells
Sato and co-workers (15) have shown previously that stimulation of RGM1 cells with IL-1β and TGF-α leads to a synergistic generation of PGE2. Fig. 2 shows [3H]arachidonate release measured in the present study. Release of [3H]arachidonate in the culture medium of RGM1 cells in the absence of cytokine stimulation increases linearly over 24 h. In the presence of TGF-α and IL-1β, [3H]arachidonate release increases beyond the nonstimulated value, with the increase being most significant during the 12–24-h period post-cytokine addition. TGF-α alone caused an intermediate increase in [3H]arachidonate release, and fatty acid release with IL-1β alone was similar to that seen without cytokine stimulation (Fig. 2). The data show that TGF-α and IL-1β act synergistically to promote arachidonate release.
FIGURE 2.
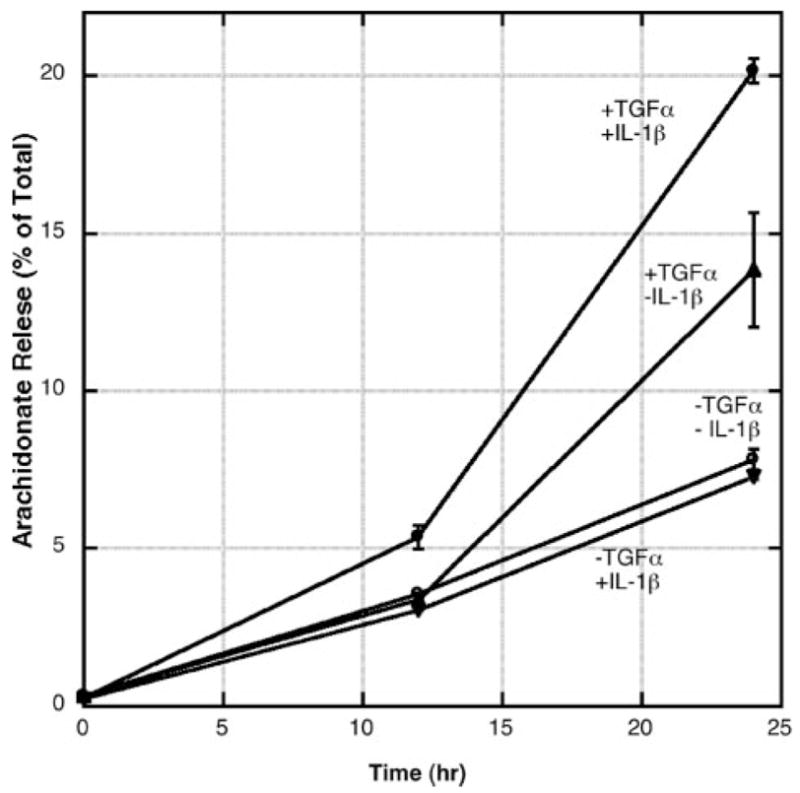
Release of [3H]arachidonate into the culture medium from RGM1 cells. Cytokine stimulation was carried out as described under “Experimental Procedures.” Each point is the average and standard deviation of three independent experiments.
As shown in Fig. 3A, cytokine stimulation of RGM1 cells leads to a marked increase in the amount of sPLA2 enzymatic activity measured in the culture medium. The increase occurs mainly during the 12–24 period. sPLA2 enzymatic activity was detected with a real time, fluorometric assay using a pyrene-labeled phosphatidylglycerol analog. We also measured the amount of sPLA2 activity in the washed cells 24 h after cytokine stimulation. We found that 25% of the total sPLA2 activity is in the cell lysis, whereas 75% is in the culture medium. No activity was measured in the presence of 1 mM EGTA (not shown), consistent with a Ca2+-dependent sPLA2 being responsible for the hydrolysis of the fluorometric phospholipid. Phosphatidylglycerol is the most preferred substrate for all mammalian sPLA2s (25). If it is assumed that all of the released sPLA2 is the group IIA enzyme (see below), it can be deduced that 106 RGM1 cells release 3.8 ng of sPLA2 into the culture medium after stimulation with cytokines for 24 h (based on the measured specific activity of recombinant rat group IIA sPLA2 of 42.3 pmol/(min × ng)).
FIGURE 3.
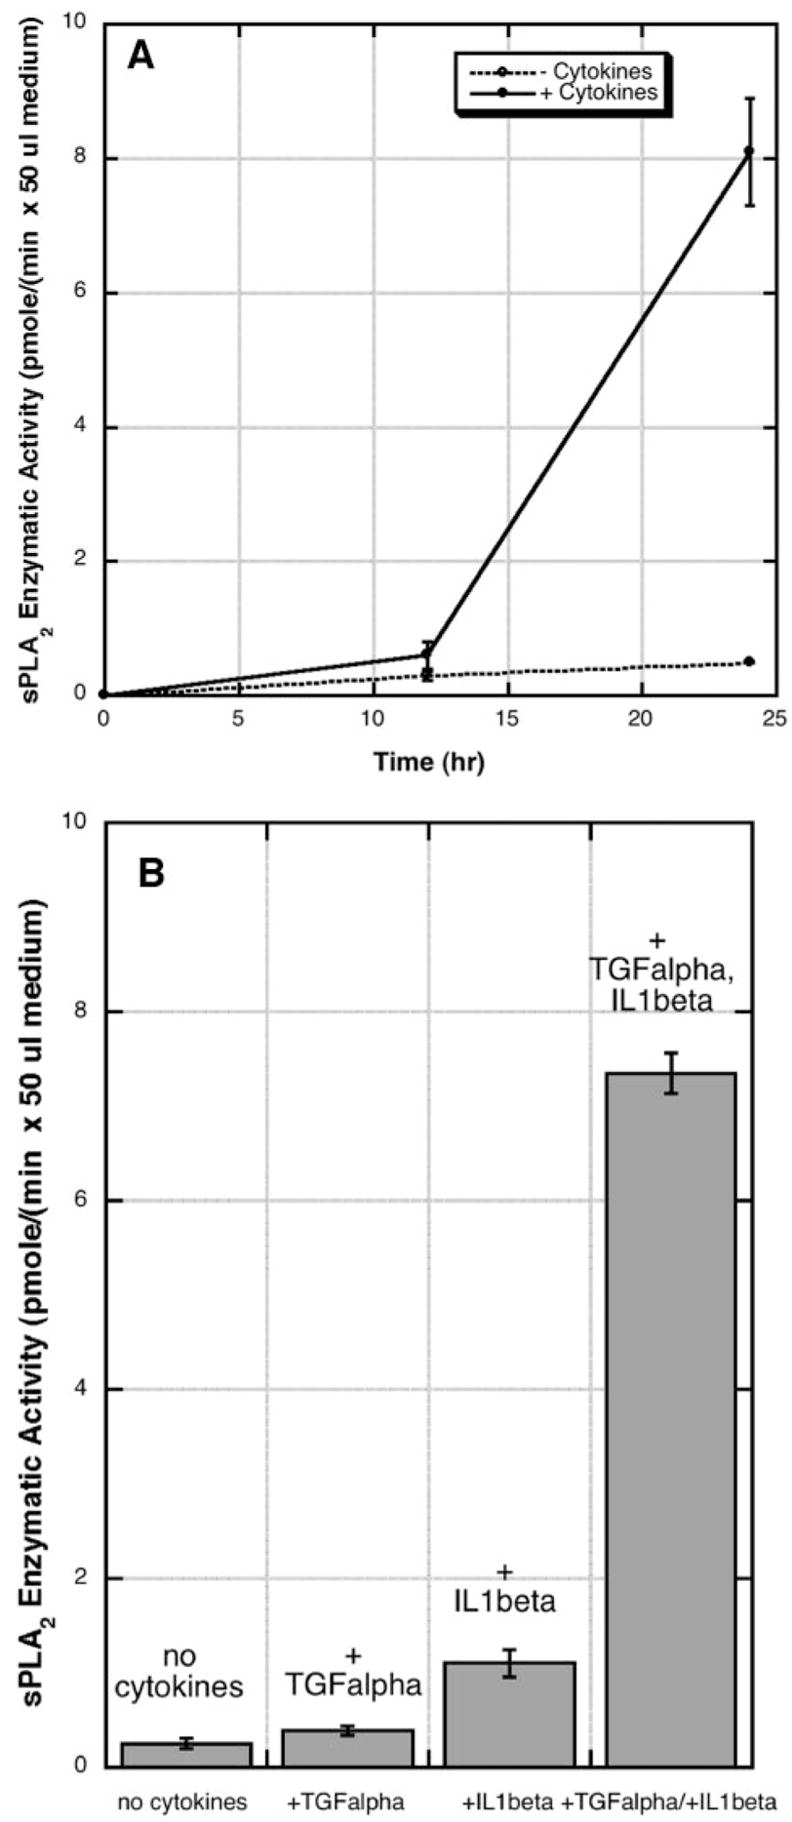
A, sPLA2 enzymatic activity in the culture medium of RGM1 cells. Cytokine stimulation (TGF-α × IL-1β) and sPLA2 activity analysis were carried out as described under “Experimental Procedures.” B, cells were stimulated with the indicated cytokines, and sPLA2 activity was measured after 24 h. Each point is the average and standard deviation of two independent experiments.
As shown in Fig. 3B, after 24 h of stimulation, TGF-α alone led to less than a 2-fold increase in sPLA2 activity in the culture medium; IL-1β alone led to a 4-fold increase in sPLA2 activity, and both cytokines together led to a 29-fold increase in sPLA2 activity. Thus, as for arachidonate release, there is a synergistic action between TGF-α and IL-1β in promotion of sPLA2 enzymatic activity secreted into the culture medium.
Fig. 4 shows that the lipolytic enzymatic activity released into the culture medium from cytokine-stimulated RGM1 cells is highly sensitive to Me-indoxam and indoxam. Both compounds display virtually identical dose-response curves with a concentration required for 50% inhibition (IC50) of 3 nM. Previous studies have shown that Me-indoxam is a potent inhibitor of human and mouse groups IIA, IIC, IIE, and V sPLA2s with IC50 values in the 5–60 nM range (25). Thus, the results in Fig. 4 are consistent with the enzymatic activity being detected with the fluorometric phospholipid substrate arising from an sPLA2. The results in Fig. 5 show that essentially all of the sPLA2 enzymatic activity secreted from cytokine-stimulated RGM1 cells is due to the group IIA enzyme. In this experiment, the culture medium from cytokine-stimulated RGM1 cells was treated with anti-mouse group IIA sPLA2 antiserum bound to protein A-Sepharose. Virtually all of the sPLA2 enzymatic activity was removed, whereas half of the activity remained in the medium when protein A-Sepharose alone was used or when protein A-Sepharose loaded with preimmune serum was used. Previous studies have shown that the anti-mouse group IIA sPLA2 antiserum detects this protein at the 0.1–1 ng level in Western blots but does not give a signal for 50 ng of each of the other mouse sPLA2s.3 All together, the results clearly show that virtually all of the sPLA2 activity released during the 12–24-h period post-stimulation of RGM1 with cytokines is due to the rat group IIA sPLA2. This is also supported by quantitative PCR studies described below.
FIGURE 4.

Culture medium from RGM1 cells stimulated with TGF-α and IL-1β for 24 h was submitted to the fluorometric sPLA2 assay in the presence of the indicated concentration of Me-indoxam or indoxam added to the assay cuvette.
FIGURE 5. Immunodepletion of sPLA2 from the medium of RGM1 cells stimulated with TGF-α and IL-1β for 24 h.

Culture medium was treated with nothing, with protein A-Sepharose (Prot A-Seph) alone, with protein A-Sepharose loaded with pre-immune serum, or with protein A-Sepharose loaded with anti-mouse group IIA sPLA2 immune serum as described under “Experimental Procedures.” The sPLA2 enzymatic activity in the supernatant above the Sepharose pellet was assayed using the fluorometric assay.
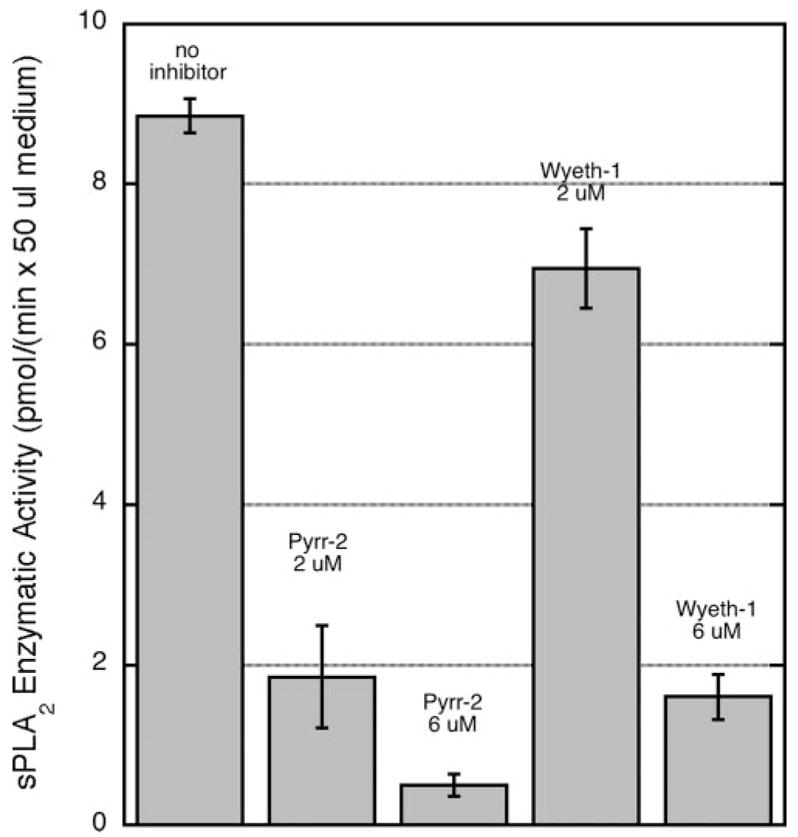
In order to explore the contribution of group IIA sPLA2 and cPLA2-α to arachidonate release and PGE2 production in cytokine-stimulated RGM1 cells, studies with highly selective, and potent inhibitors were carried out. As shown in Fig. 6A, 1, 10, and 20 μM indoxam dose-dependently inhibited arachidonate release; 20 μM caused 75% inhibition of the cytokine-dependent arachidonate released. Remarkably, 1, 10, and20μM Me-indoxam had almost no effect (18%inhibition of cytokine-dependent arachidonate release with 20 μM Me-indoxam). Both cPLA2-α inhibitors caused significant dose-dependent inhibition of arachidonate release; pyrrolidine-2 inhibited cytokine-dependent arachidonate release by 68% at 2 μM and Wyeth-1 by 100% at 6 μM. When 10 μM indoxam was added 12 h after cytokine addition, cytokine-dependent arachidonate released was reduced by 16 ± 1% (three independent experiments; data not shown) compared with 43% inhibition seen when the inhibitor was added along with cytokines 24 h before arachidonate release was measured (Fig. 6A).
FIGURE 6.

A, effect of PLA2 inhibitors on arachidonate release from cytokine-stimulated RGM1 cells. PLA2 inhibitors were added at the indicated concentrations at the time of addition of TGF-α and IL-1β, and arachidonate release to the medium, expressed as a percent of total cellular arachidonate, was measured after 24 h (additional details are given under “Experimental Procedures”). The average and standard deviations from four independent experiments are shown. The vehicle used to add inhibitors was Me2SO in all cases, and vehicle alone had no effect on arachidonate release (not shown). B, same as for Fig. 6A except PGE2 release from 1 × 10⁶ RGM1 cells was measured. Pyrr-2, pyrrolidine-2.
Indoxam also inhibited cytokine-dependent PGE2 production (Fig. 6B). When 10 μM indoxam was added to the culture medium together with cytokines, cytokine-dependent PGE2 production measured after 24 h was inhibited by 35%, whereas 10 μM Me-indoxam had no effect. Pyrrolidine-2 at 2 μM reduced cytokine-dependent PGE2 production by 87% and 6 μM Wyeth-1 by 81%.
To address whether Me-indoxam was being destroyed by cultured RGM1 cells, we added 1 μM Me-indoxam to the culture medium of RGM1 cells along with cytokines. After 24 h, a 50-μl aliquot of culture medium was added to the fluorometric sPLA2 assay. The amount of enzymatic activity was 7% of that measured in an aliquot of medium from cells that were not treated with Me-indoxam (not shown). In this experiment, the concentration of Me-indoxam in the fluorometric sPLA2 assay would be 50 nM if it was not destroyed upon incubation with cytokine-stimulated RGM1 cells. This experiment shows that most, if not all, of the Me-indoxam remains after a 24-h incubation with RGM1 cells. The same was found with indoxam (not shown).
We also measured the permeability of Me-indoxam and indoxam across tight monolayers of Caco-2 cells as a way to estimate the ability of these compounds to cross the plasma membrane of mammalian cells. As found in our earlier study (12), Me-indoxam displayed a very low permeability across these cells of Papp = 0.1 × 10⁻⁶ cm/s. In contrast indoxam displays increased permeability compared with Me-indoxam, with Papp value of 0.3 × 10⁻⁶ cm/s.
Arachidonate release induced by TGF-α alone was also inhibited by pyrrolidine-2 (65% inhibition at 2 μM), by Wyeth-1 (100% inhibition at 6μM), and by indoxam (78% inhibition at 20 μM) (not shown).
Consistent with the reduction in arachidonate release caused by addition of cPLA2-α inhibitors, Western blot analysis showed the presence of cPLA2-α in RGM1 cells (Fig. 7). In the absence of cytokine stimulation, most of the cPLA2-α migrated as the faster, nonphosphorylated form. After 12 or 24 h of culture in the absence of cytokines or in the presence of IL-1β alone, cPLA2-α remained mostly in the nonphosphorylated form. In contrast, after 12 or 24 h of stimulation with TGF-α with or without IL-1β, cPLA2-α mostly shifted to the phosphorylated form (Fig. 7).
FIGURE 7. Western blot analysis of cPLA2-α in RGM1 cells.
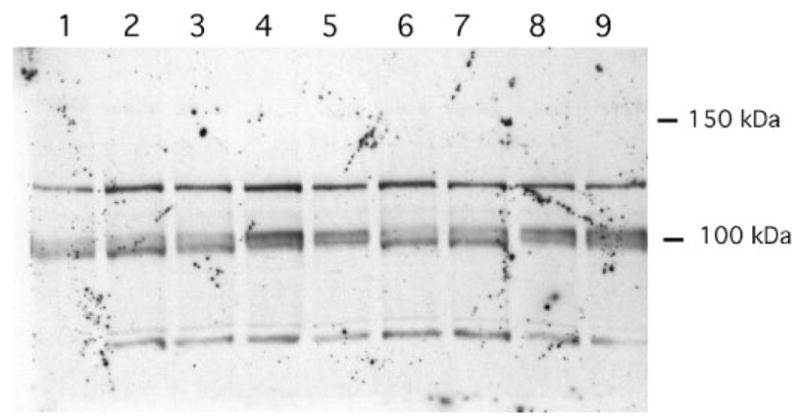
Lane 1, 0 h treatment; lane 2, 12 h without cytokine treatment; lane 3, 12 h with IL-1β; lane 4, 12 h with TGF-α; lane 5, 12 h with both cytokines; lane 6, 24 h without cytokine treatment; lane 7, 24 h with IL-1β; lane 8, 24 h with TGF-α; lane 9, 24 h with both cytokines. cPLA2-αruns with the 100-kDa marker. The identities of the cross-reacting bands at ~ 80 and ~ 120 kDa are unknown.
Group IIA sPLA2s are highly basic proteins and are known to bind tightly to anionic polymers, including heparin (26). Addition of extra-cellular heparin to the culture medium of cells has been used to reduce the amount of extracellular group IIA sPLA2 that is bound to cell surface proteoglycans (12, 27). As shown in Fig. 8, addition of heparin to the culture medium of cytokine-stimulated RGM1 cells had little, if any, effect on arachidonate release. The highest dose of heparin used (1 mg/ml) has been more than sufficient to remove most of the group IIA sPLA2 bound to the cell surface of various mammalian cells (12, 27).
FIGURE 8. Arachidonate release from cytokine-stimulated RGM1 cells in the absence and presence of the indicated amount of heparin added to the culture medium at the time of cytokine addition (24 h prior to measurement of released arachidonate.

). Shown are the average values and standard deviations from three independent experiments.
We also tested if exogenously added recombinant rat group IIA sPLA2 could elicit arachidonate release from RGM1 cells. As shown in Fig. 9, addition of up to 1000 ng of this enzyme to the culture medium in the absence or presence of cytokine stimulation failed to elicit arachidonate release. High amounts of recombinant group IIA sPLA2 caused some reduction in the cytokine-dependent arachidonate release for reasons that are not known. Based on the amount of endogenous group IIA sPLA2 produced by these cells (~ 4 ng, see above), it can be concluded that exogenously added enzyme is at least 3 orders of magnitude less efficient than endogenously produced enzyme at eliciting arachidonate release.
FIGURE 9. Arachidonate released from RGM1 cells with and without cytokine stimulation by the indicated amounts of exogenously added recombinant rat group IIA sPLA2.

Enzyme and cytokines were added 24 h prior to measurement of arachidonate release Shown are the average values and standard deviations from two independent experiments.
The effect of the cPLA2-α inhibitors on the appearance of group IIA sPLA2 in the extracellular medium following cytokine stimulation was studied. Pyrrolidine-2 or Wyeth-1 added at the time of cytokine addition caused significant reduction in the amount of sPLA2 enzymatic activity measured in the culture medium taken at 24 h (Fig. 10). Near-complete inhibition was seen with 6 μM pyrrolidine-2, whereas 6 μM Wyeth-1 was less effective at reducing the amount of sPLA2 secreted to the medium (Fig. 10). These cPLA2-α inhibitors do not directly inhibit sPLA2 enzymatic activity; when they were added to the fluorometric assay of recombinant rat group IIA sPLA2 at twice the concentration present in the cell culture studies, no inhibition was observed. The dose-response data for the ability of pyrrolidine-2 and Wyeth-1 to reduce the amount of group IIA sPLA2 released from cytokine-stimulated RGM1 cells (Fig. 10) corresponds to the dose response for the effect of these compounds on arachidonate release (Fig. 6A). We also found that treatment with 6 μM pyrrolidine-2 or Wyeth-1 leads to an 85 and 70% decrease, respectively, in the amount of sPLA2 enzymatic activity in washed cells (in the cell lysate) (not shown). Thus, inhibition of the amount of sPLA2 in the culture medium and in the cells by the cPLA2-α inhibitors are approximately the same.
FIGURE 10. Appearance of sPLA2 enzymatic activity in the culture medium of RGM1 cells in the presence and absence of cPLA2-α inhibitors.
Inhibitors were added at time 0 along with cytokines, and sPLA2 enzymatic activity was measured after 24 h. Shown are the average values and standard deviations from two independent experiments.
We examined the expression of group IIA sPLA2 in RGM1 cells at the mRNA level by using quantitative PCR. As shown in Fig. 11A, stimulation of RGM1 cells with TGF-α and IL-1β led to a dramatic increase in the amount of group IIA sPLA2 mRNA (6-fold in the first 12 h and then 460-fold after 24 h; all data are given as mRNA level relative to the minus cytokine/12-h mRNA level). Thus, group IIA sPLA2 mRNA levels track with the amount of sPLA2 enzymatic activity seen in the RGM1 culture medium (Fig. 3). Both pyrrolidine-2 and Wyeth-1 dose-dependently reduced group IIA sPLA2 mRNA levels (Fig. 11B). Pyrrolidine-2 was more potent than Wyeth-1; 6 μM leads to an ~ 100-fold reduction, whereas 6 μM Wyeth-1 reduces the mRNA level by 3-fold. This is consistent with pyrrolidine-2 being more potent than Wyeth-1 at reducing arachidonate release and group IIA sPLA2 enzymatic activity in the culture medium (Figs. 6 and 10). Indoxam at 20 μM had no effect on the group IIA sPLA2 mRNA level (Fig. 11B).
FIGURE 11.
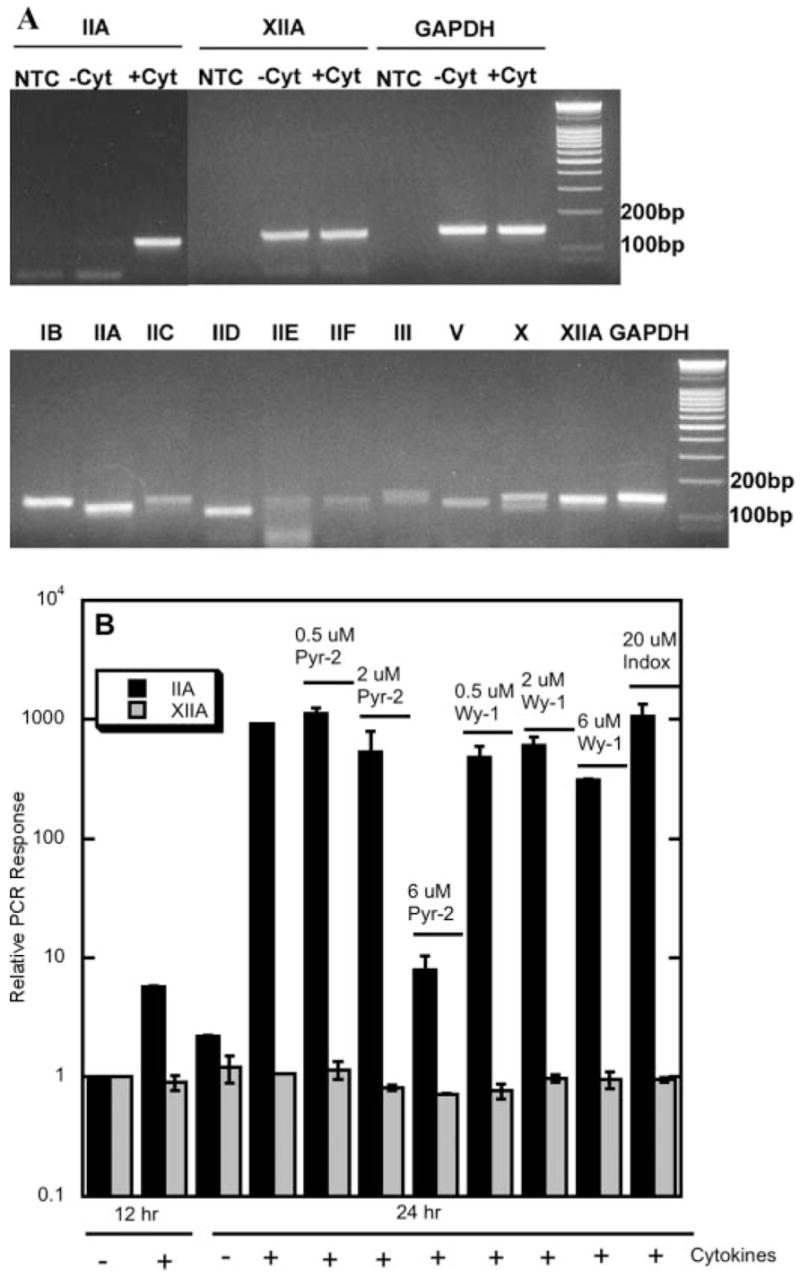
A, detection of sPLA2 mRNAs by RT-PCR. After quantitative RT-PCR analysis, a portion of the reaction mixture was examined by gel electrophoresis (top panel). RGM1 cells were stimulated with TGF-α and IL-1β (+Cyt) or without cytokines (−Cyt) for 24 h. NTC is the no-template control (bottom panel). B, cDNA from a mixture or rat tissue was used as a positive control for PCR. B, the level of mRNA for either group IIA or XIIA sPLA2 is plotted relative to the signal obtained after culturing the cells for 12 h in the absence of cytokines. In some experiments, pyrrolidine-2 (Pyr-2), Wyeth-1 (Wy-1), or indoxam (Indox) was present during the 24-h cytokine stimulation period. The reduction seen with 6 μM Wyeth-1 is 3-fold, and the error bar is so small that it does not display well. Data shown are the averages and standard deviations of two independent experiments.
We also carried out quantitative RT-PCR for all known rat sPLA2s (groups IB, IIC, IID, IIE, IIF, III, V, X, and XIIA). As shown in Fig. 11A (top panel), group XIIA sPLA2 mRNA was detected along with IIA sPLA2 mRNA, but its level was much lower than the level of IIA at 24 h, and its level was not influenced by cytokines or the presence of cPLA2 inhibitors. For both group IIA and XIIA sPLA2, gel analysis of the PCR mixtures showed the expected size DNA band, and no other reaction products were observed. The PCR efficiencies for GAPDH and groups IIA and XIIA sPLA2s were measured to be 1.71, 1.84, and 1.81, respectively. mRNA for all of the other rat sPLA2s was not observed in RGM1 cells either before or after 24 h of cytokine stimulation (not shown). However, as shown in Fig. 11 (bottom panel), the correct size PCR bands were observed for all of these sPLA2s when cDNA from a mixture of rat tissues was used as a target.
We also used RNA interference to knockdown the level of rat group IIA sPLA2 and cPLA2-α in RGM1 cells followed by arachidonate release studies. As shown in Fig. 12A, group IIA sPLA2 RNAi led to an ~ 3-fold decrease in the amount of sPLA2 enzymatic activity secreted into the culture medium after cytokine treatment. Western blot analysis shows a significant reduction in cPLA2-α protein after transfection of cells with the cPLA2-α RNAi (Fig. 12B). As shown in Fig. 12C, knockdown of cPLA2-α led to a small but statistically significant reduction in the amount of group IIA sPLA2 secreted into the culture medium. Fig. 12C shows that RNAi knockdown of cPLA2-α or group IIA sPLA2 led to a reduction in the amount of cytokine-stimulated arachidonate release. These results are consistent with the studies with PLA2 inhibitors described above but are less dramatic, presumably because a higher level of PLA2 inhibition was achieved with inhibitors compared with the level of knockdown achieved with RNAi.
FIGURE 12. RNA interference of group IIA sPLA2 and cPLA2-α.
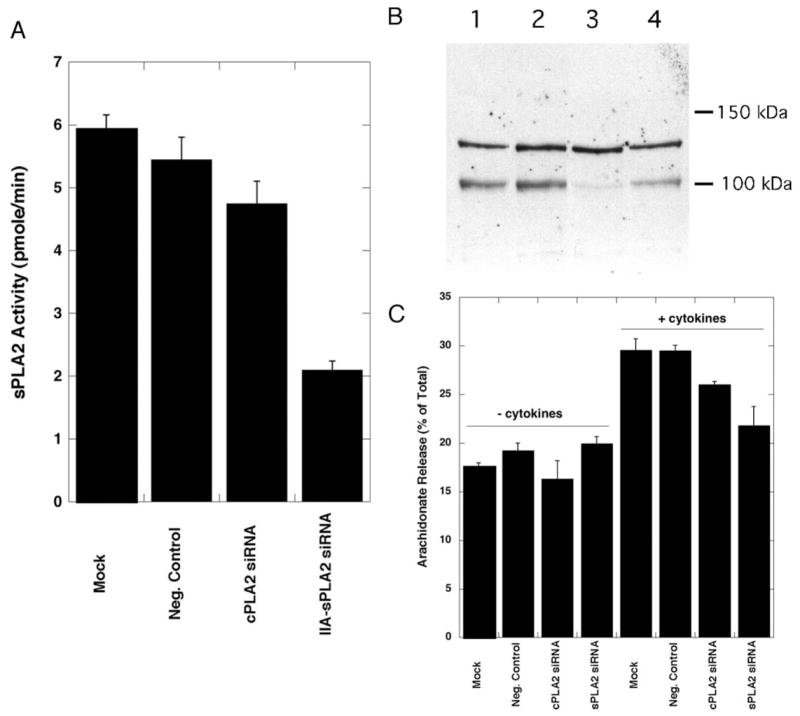
A, amount of group IIA sPLA2 in 50 μl of RGM1 culture medium (measured with the fluorometric PLA2 assay) after treatment of cells with the indicated siRNA. Shown are the averages and standard deviations from three independent experiments. B, Western blot analysis for cPLA2-α. Lane 1, mock-transfected; lane 2, negative control-transfected; lane 3, cPLA2-α siRNA-transfected; lane 4, group IIA sPLA2 siRNA-transfected. The identity of the cross-reactive band at ~ 130 kDa is not known. C, arachidonate release from RGM1 cells after treatment with the indicated siRNA in the presence and absence of TGF-α/IL-1β. Arachidonate release was measured 24 h after cytokine addition. Shown are the averages and standard deviations from three independent experiments.
Studies with Transfected HEK293 Cells
Arachidonate release from both cytokine-stimulated RGM1 and sPLA2-transfected HEK293 cells share the common phenomenon of insensitivity to the potent sPLA2 inhibitor Me-indoxam (Fig. 6A) (12). Based on this and a large body of additional data, we suggested that group IIA sPLA2 contributes to arachidonate release prior to externalization from HEK293 cells. In this study, we have used brefeldin A to block cellular secretion and to study the consequence of this on cytokine-stimulated arachidonate release. Prior to blocking secretion of group IIA sPLA2 with brefeldin A, we wanted to remove enzyme that was already externalized, which is mainly bound to the cell surface by electrostatic interaction with anionic cellular components including, but not limited to, proteoglycan (12, 27). Two independently obtained HEK293 cell clones that overexpress human group IIA sPLA2 were used in parallel. Cells were labeled with [3H]arachidonic acid and then washed with complete medium containing soluble heparin to remove cell surface-bound sPLA2 (12, 27). Cells were then treated with cytokines with and without brefeldin A. Heparin was omitted from this brefeldin A treatment period because we have shown that heparin causes inhibition of arachidonate release by a unknown and nonspecific mechanism (12).
When cells were first cleared of their extracellular human group IIA sPLA2 by heparin treatment, the amount of sPLA2 enzymatic activity secreted into the culture medium taken after the 4-h cytokine stimulation period and in the presence of brefeldin A was 20 ± 5% that measured in the absence of brefeldin A (triplicate analysis). For this measurement, cells were treated with heparin-containing medium for a 30-min period after the 4-h cytokine treatment period so that total extracellular enzyme (free and cell surface-associated) was measured. As expected, these results show that brefeldin A treatment inhibits the secretion of most of the human group IIA sPLA2 from HEK293 cells. Despite this inhibition of enzyme release, [3H]arachidonate release was not affected by brefeldin A treatment, being 4.35 ± 0.34% release without brefeldin A and 4.92 ± 0.13% with 15 μg/ml brefeldin A (triplicate analysis).
Medium containing 1 M NaCl has also been used to remove cell surface-bound sPLA2 (27). When cells were cultured in complete medium with IL-1β with or without brefeldin A for 4 h and then washed with complete medium containing 1 M NaCl, the amount of sPLA2 enzymatic activity measured with or without brefeldin A was not statistically different, and the activity was 5–6-fold higher than that measured when heparin was used to wash the cells. These results show that 1 M NaCl is causing disruption of cells leading to the release of extracellular and intracellular pools of sPLA2. Thus, studies with 1 M NaCl cannot be interpreted.
DISCUSSION
A key feature of this study is that we study arachidonate release in a cell line that has not been treated exogenously with sPLA2s or transfected with sPLA2s. Fig. 13 shows a summary of the pathway of arachidonate release and PGE2 production in cytokine-stimulated RGM1 cells. TGF-α and IL-1β act synergistically to promote PGE2 production, as first reported by Akiba et al. (15, 28), and we also report that these two cytokines lead to a synergistic release of arachidonate. A delayed phase of arachidonate release (12–24 h) occurs concomitantly with a large increase in the amount of mRNA for group IIA sPLA2 and the appearance of group IIA sPLA2 protein in the culture medium. Group XIIA sPLA2 is also present in these cells, but its level does not change with cytokine treatment. The other eight known mammalian sPLA2s are not expressed in RGM1 cells, at least based on mRNA analysis. Group XIIA sPLA2 probably does not contribute to arachidonate release because recombinant mouse and human group XIIA sPLA2s are not inhibited by Me-indoxam (25), and the structurally related compound indoxam substantially inhibits arachidonate release from RGM1 cells (Fig. 6A).
FIGURE 13. Arachidonate release and PGE2 production in TGF-α- and IL-1β-stimulated RGM1 cells.

See text for discussion.
It is generally thought that cPLA2-α is responsible for arachidonate release in agonist-stimulated mammalian cells. However, the results with highly specific and potent inhibitors show that both cPLA2-α and group IIA sPLA2 contribute to arachidonate release and PGE2 production in cytokine-stimulated RGM1 cells. Because both of these enzymes can liberate arachidonate from the sn-2 position of cellular phospholipids, it is not possible to know from the present results what fraction of the total liberated arachidonate is contributed by each enzyme (i.e. factor α in Fig. 13).
Treatment with TGF-α, but not IL-1β, leads to cPLA2-α phosphorylation and presumably its activation. However, cPLA2-α cannot act alone in RGM1 cells because arachidonate release and PGE2 production is substantially blocked by the sPLA2 inhibitor indoxam. The fact that both the early and late phases of arachidonate release are blocked by indoxam shows that group IIA sPLA2 is involved in both phases of lipid mediator production. The failure to observe significant amounts of group IIA sPLA2 in the culture medium after 12 h of cytokine stimulation could be due to binding of this highly basic protein to anionic proteoglycans on the external face of the plasma membrane (12). Perhaps only after sPLA2 protein accumulates to a higher level during the late phase does it accumulate in the culture medium. The data also show that group IIA sPLA2 does not act alone to liberate arachidonate release because two structurally distinct and potent cPLA2-α inhibitors substantially block arachidonate release. TGF-α or IL-1β did not lead to an alteration in the amount of cPLA2-α protein. Finally, IL-1β synergizes with TGF-α to cause maximal induction of group IIA sPLA2 mRNA and protein by an unknown mechanism even though IL-1β does not lead to cPLA2-α phosphorylation or induction of cPLA2-α expression.
Studies with the cPLA2-α inhibitors also show that blocking cPLA2-α action substantially prevents the induction of group IIA sPLA2 mRNA and protein. Previous studies using less specific and less potent cPLA2-α inhibitors have shown a similar requirement for cPLA2-α in the induction of sPLA2s (29, 30). The mechanism behind this cPLA2-α-dependent alteration of sPLA2 mRNA level remains to be determined.
Referring to Fig. 13, if α is 0 (arachidonate release is solely due to the direct action of cPLA2-α on phospholipids), the role of group IIA sPLA2 is to somehow augment the action of cPLA2-α. On the other hand, if α is 100 (arachidonate release is solely due to the direct of group IIA sPLA2 on phospholipids), the role of cPLA2-α is to augment the action of sPLA2. It is also possible that both lipases are directly responsible for arachidonate release.
A remarkable finding in this study is the fact that group IIA sPLA2 acts in cytokine-stimulated RGM1 cells prior to its release into the culture medium. The results with the structurally very similar compounds Me-indoxam and indoxam clearly show that not all sPLA2 inhibitors block the action of these enzymes in cells despite the fact that both compounds bind to rat group IIA sPLA2 with affinities that are indistinguishable experimentally. Furthermore, addition of recombinant rat group IIA sPLA2 to RGM1 cells in the presence and absence of TGF-α and IL-1β did not lead to a detectable increase in arachidonate release above that measured in the absence of added enzyme, even though the amount added was 2–3 orders of magnitude more than the amount of group IIA sPLA2 produced by these cells. Finally, trapping of secreted group IIA sPLA2 with extracellular heparin did not reduce the amount of arachidonate released. The only reasonable hypothesis is that group IIA sPLA2 is acting prior to externalization from cells and that indoxam permeates RGM1 cells more than Me-indoxam does.
Although we did not directly measure the ability of indoxam and Me-indoxam to cross membranes of RGM1 cells, we did compare the ability of these two compounds to cross the tight-junction monolayer of Caco-2 cells. This permeability assay is commonly used to predict the passage of drug candidates across the intestinal epithelial cell layer. The Caco-2 cell data indicated that both Me-indoxam and indoxam display low permeability, with indoxam being about 3-fold more permeable than Me-indoxam. In the case of Me-indoxam, we prepared this compound in the 14C-labeled form and showed by direct cell uptake studies that it did not penetrate into HEK293 cells (12). Such studies were not carried out with indoxam because of the difficulty in preparing radiolabeled compound. It appears that indoxam does not rapidly cross the membranes of RGM1 cells based on the fact that less inhibition of arachidonate release was seen when the compound was added at 12 h rather than at 0 h. This suggests that the compound requires several hours for cell uptake, which is consistent with the low permeability seen with the Caco-2 cell assay. We also found that indoxam did not block arachidonate release from HEK293 cells transfected with human group IIA sPLA2 regardless of whether the compound was preincubated with cells or not (data not shown). This shows that indoxam is not permeable to all mammalian cell types. It further underscores the need to discover a highly cell permeable sPLA2 inhibitor that can be used as a more reliable tool to probe the role of sPLA2s in cellular functions such as arachidonate release. We are currently trying to develop such compounds.
Although we did not examine whether externalized rat group IIA sPLA2 is taken up into RGM1 cells, we must conclude that arachidonate and PGE2 production are not the result of an sPLA2 re-uptake mechanism. If the sPLA2 passes through the culture medium prior to action, it will become exposed to cell-permeable and cell-impermeable inhibitors (i.e. Me-indoxam) and become inhibited. Thus, the lack of inhibition seen with Me-indoxam rules out sPLA2 action after possible cell re-uptake.
Although we provided a vast amount of data in our earlier paper showing that arachidonate release when cells are transfected with human group IIA sPLA2 requires the action of the enzyme prior to externalization from the cells (12), it occurred to us that the use of brefeldin A provides additional insight into the location of sPLA2 action. In the present study, we found that treatment of transfected HEK293 cells with brefeldin A blocked most of the release of the human group IIA sPLA2 in the culture medium and yet did not result in a reduction in the amount of arachidonate release. This provides additional strong evidence that the sPLA2 acts in these cells prior to externalization. Studies with RGM1 cells and brefeldin A were not carried out simply for historical reasons.
It seems that workers in the sPLA2 field assumed for many years that arachidonate release by these enzymes would be the result of extracellular action of sPLA2. In fact all of the studies prior to ours on the assessment of indole-type sPLA2 inhibitors such as indoxam by workers at Lilly and others reported the blockade of arachidonate release when inhibitor was added to cells that were treated with exogenously added group IIA sPLA2 (for example see Ref. 31). In these studies, relatively large amounts of group IIA sPLA2 were used, typically > 1–2 μg of enzyme per 1 ml of culture medium. Such concentrations of group IIA sPLA2 are found in synovial fluid during inflammation and in serum during pancreatitis, for example (32). Indeed, in our hands, Me-indoxam fully blocked arachidonate release from HEK293 cells treated with the large amount of recombinant human group IIA sPLA2 needed to elicit release from the cells by exogenous enzyme (12). However, these sPLA2 concentrations are much higher than those that accumulate in cultured RGM1 and HEK293 cells stimulated with cytokines for example. It must be noted that the concentration of sPLA2 that accumulates in the culture medium of cultured cells depends on the volume of culture medium used; thus, the concentrations may not be physiologically relevant. However, the present studies show that relatively small amounts of intracellularly acting rat group IIA sPLA2 can cause increased arachidonate and PGE2 production in cultured RGM1 cells. The findings are very significant as they suggest that inhibitors of sPLA2 that are cell-permeable should be used to best test the role of these enzymes in inflammation. The recent clinical trial failure of compounds structurally similar to indoxam to produce beneficial results in rheumatoid arthritic and sepsis patients (33, 34) may in part be due to issues of poor cell permeability.
The cross-talk between cPLA2-α and sPLA2 seen in RGM1 cells has also been observed in other mammalian cell types. Studies with sPLA2-transfected HEK293 cells and PLA2 inhibitors as well as with mesangial cells from wild type and cPLA2-α-deficient mice clearly show that the sPLA2 can act together with cPLA2-α to maximize arachidonate release (11, 12). Also, treatment of human neutrophils with exogenous group V sPLA2 leads to cPLA2-α-dependent leukotriene production as shown by studies with cPLA2-α-deficient mouse neutrophils (35). A final study showing clear coordinate action of these PLA2s is the recent work of Arm and co-workers (10) showing that arachidonate release in zymosan-stimulated mouse peritoneal macrophages is reduced about 50% in cells from group V sPLA2-deficient mice, and yet arachidonate release is fully blocked in the same cell/agonist system when cells are isolated from cPLA2-α-deficient mice (5). We have shown that Me-indoxam does not modify arachidonate release levels in zymosan-stimulated mouse peritoneal macrophages.4 So it seems that the intracellular action of group V sPLA2 works together with cPLA2-α leading to maximal arachidonate release in these cells.
Footnotes
This work was supported by National Institutes of Health Grants HL36835 and HL50040 (to M. H. G.).
The abbreviations used are: PLA2, phospholipase A2; cPLA2, cytosolic PLA2; sPLA2, secreted PLA2; siRNA, small interfering RNA; DMEM, Dulbecco’s modified Eagle’s medium; FBS, fetal bovine serum; TGF, transforming growth factor; IL, interleukin; PG, prostaglandin; GAPDH, glyceraldehyde-3-phosphate dehydrogenase; RNAi, RNA interference; RT, reverse transcription.
A. G. Singer, F. Ghomashchi, and M. H. Gelb, manuscript in preparation.
F. Ghomashchi and M. H. Gelb, unpublished data.
References
- 1.Leslie CC. J Biol Chem. 1997;272:16709–16712. doi: 10.1074/jbc.272.27.16709. [DOI] [PubMed] [Google Scholar]
- 2.Hirabayashi T, Murayama T, Shimizu T. Biol Pharm Bull. 2004;27:1168–1173. doi: 10.1248/bpb.27.1168. [DOI] [PubMed] [Google Scholar]
- 3.Uozumi N, Kume K, Nagase T, Nakatani N, Ishii S, Tashiro F, Komagata Y, Maki K, Ikuta K, Ouchi Y, Miyazaki J, Shimizu T. Nature. 1997;390:618–622. doi: 10.1038/37622. [DOI] [PubMed] [Google Scholar]
- 4.Bonventre JV, Huang Z, Taheri MR, O’Leary E, Li E, Moskowitz MA, Sapirstein A. Nature. 1997;390:622–625. doi: 10.1038/37635. [DOI] [PubMed] [Google Scholar]
- 5.Gijon MA, Spencer DM, Siddiqi AR, Bonventre JV, Leslie CC. J Biol Chem. 2000;275:46–46. doi: 10.1074/jbc.M908941199. [DOI] [PubMed] [Google Scholar]
- 6.Rubin BB, Downey GP, Koh A, Degousee N, Ghomashchi F, Nallan L, Stefanski E, Harkin DW, Sung C, Smart BP, Lindsay TF, Cherepanov V, Vachon E, Kelvin D, Sadilek M, Brown GE, Yaffe MB, Plumb J, Grinstein S, Glogauer M, Gelb MH. J Biol Chem. 2005;280:7519–7529. doi: 10.1074/jbc.M407438200. [DOI] [PMC free article] [PubMed] [Google Scholar]
- 7.Valentin E, Ghomashchi F, Gelb MH, Lazdunski M, Lambeau G. J Biol Chem. 1999;274:31195–31202. doi: 10.1074/jbc.274.44.31195. [DOI] [PubMed] [Google Scholar]
- 8.Six DA, Dennis EA. Biochim Biophys Acta. 2000;1488:1–19. doi: 10.1016/s1388-1981(00)00105-0. [DOI] [PubMed] [Google Scholar]
- 9.Wong DA, Kita Y, Uozumi N, Shimizu T. J Exp Med. 2002;196:349–357. doi: 10.1084/jem.20011443. [DOI] [PMC free article] [PubMed] [Google Scholar]
- 10.Satake Y, Diaz BL, Balestrieri B, Lam BK, Kanaoka Y, Grusby MJ, Arm JP. J Biol Chem. 2004;279:16488–16494. doi: 10.1074/jbc.M313748200. [DOI] [PMC free article] [PubMed] [Google Scholar]
- 11.Han WK, Sapirstein A, Hung CC, Alessandrini A, Bonventre JV. J Biol Chem. 2003;278:24153–24163. doi: 10.1074/jbc.M300424200. [DOI] [PubMed] [Google Scholar]
- 12.Mounier C, Ghomashchi F, Lindsay MR, James S, Singer AG, Parton RG, Gelb MH. J Biol Chem. 2004;279:25024–25038. doi: 10.1074/jbc.M313019200. [DOI] [PubMed] [Google Scholar]
- 13.Muñoz NM, Kim YJ, Meliton AY, Kim KP, Han SK, Boetticher E, O’Leary E, Myou S, Zhu X, Bonventre JV, Leff AR, Cho W. J Biol Chem. 2003;278:38813–38820. doi: 10.1074/jbc.M302476200. [DOI] [PubMed] [Google Scholar]
- 14.Murakami M, Yoshihara K, Shimbara S, Lambeau G, Gelb MH, Singer AG, Sawada M, Inagaki N, Nagai H, Ishihara M, Ishikawa Y, Ishii T, Kudo I. J Biol Chem. 2002;277:19145–19155. doi: 10.1074/jbc.M112385200. [DOI] [PubMed] [Google Scholar]
- 15.Akiba S, Hatazawa R, Ono K, Kitatani K, Hayama M, Sato T. J Biol Chem. 2001;276:21854–21862. doi: 10.1074/jbc.M010201200. [DOI] [PubMed] [Google Scholar]
- 16.Kobayashi O, Watanabe S, Hirose M, Sato N. J Gastroenterol Hepatol. 1996;11:129–136. doi: 10.1111/j.1440-1746.1996.tb00049.x. [DOI] [PubMed] [Google Scholar]
- 17.Robert A, Nezamis JE, Lancaster C, Hanchar AJ. Gastroenterology. 1979;77:433–443. [PubMed] [Google Scholar]
- 18.Janssen MJ, Vermeulen L, Vad der Helm HA, Aarsman AJ, Slotboom AJ, Egmond MR. Biochim Biophys Acta. 1999;1440:59–72. doi: 10.1016/s1388-1981(99)00122-5. [DOI] [PubMed] [Google Scholar]
- 19.McKew JC, Tam SY, Lee KL, Chen L, Thakker P, Sum F-W, Behnke M, Hu B, Clark JD. 6797708 U S Patent. September 28, 2004;
- 20.Seno K, Okuno T, Nishi K, Murakami Y, Yamada K, Nakamoto S, Ono T. Bioorg Med Chem Lett. 2001;11:587–590. doi: 10.1016/s0960-894x(01)00003-8. [DOI] [PubMed] [Google Scholar]
- 21.Hagishita S, Yamada M, Shirahase K, Okada T, Murakami Y, Ito Y, Wada M, Kato T, Ueno M, Chikazawa Y, Yamada K, Ono T, Teshirogi I, Ohtani M. J Med Chem. 1996;39:3636–3658. doi: 10.1021/jm960395q. [DOI] [PubMed] [Google Scholar]
- 22.Akiba S, Hayama M, Sato T. PAF Conference; Tokyo. 2001. [Google Scholar]
- 23.Bezzine S, Koduri RS, Valentin E, Murakami M, Kudo I, Ghomashchi F, Sadilek M, Lambeau G, Gelb MH. J Biol Chem. 2000;275:3179–3191. doi: 10.1074/jbc.275.5.3179. [DOI] [PubMed] [Google Scholar]
- 24.Pfaffl MW. Nucleic Acids Res. 2001;29:45. doi: 10.1093/nar/29.9.e45. [DOI] [PMC free article] [PubMed] [Google Scholar]
- 25.Singer AG, Ghomashchi F, Le Calvez C, Bollinger J, Bezzine S, Rouault M, Sadilek M, Nguyen E, Lazdunski M, Lambeau G, Gelb MH. J Biol Chem. 2002;277:48535–48549. doi: 10.1074/jbc.M205855200. [DOI] [PubMed] [Google Scholar]
- 26.Horigome K, Hayakawa M, Inoue K. J Biochem (Tokyo) 1987;101:625–631. doi: 10.1093/jb/101.3.625. [DOI] [PubMed] [Google Scholar]
- 27.Murakami M, Nakatani Y, Kudo I. J Biol Chem. 1996;271:30041–30051. doi: 10.1074/jbc.271.47.30041. [DOI] [PubMed] [Google Scholar]
- 28.Akiba S, Hatazawa R, Ono K, Hayama M, Matsui H, Sato T. Br J Pharmacol. 2000;131:1004–1010. doi: 10.1038/sj.bjp.0703637. [DOI] [PMC free article] [PubMed] [Google Scholar]
- 29.Balboa MA, Balsinde J, Jones S, Dennis EA. J Biol Chem. 1997;272:8576–8590. doi: 10.1074/jbc.272.13.8576. [DOI] [PubMed] [Google Scholar]
- 30.Kuwata H, Nonaka T, Murakami M, Kudo I. J Biol Chem. 2005;280:25830–25839. doi: 10.1074/jbc.M500168200. [DOI] [PubMed] [Google Scholar]
- 31.Snyder DW, Bach NJ, Dillard RD, Draheim SE, Carlson DG, Fox N, Roehm NW, Armstrong CT, Chang CH, Hartley LW, Johnson LM, Roman C, Smith AC, Song M, Fleisch JH. J Pharmacol Exp Ther. 1999;288:1117–1124. [PubMed] [Google Scholar]
- 32.Nevalainen TJ, Haapamaki MM, Gronroos JM. Biochim Biophys Acta. 2000;1488:83–90. doi: 10.1016/s1388-1981(00)00112-8. [DOI] [PubMed] [Google Scholar]
- 33.Bradley JD, Dmintrienko AA, Kivitz AJ, Gluck OS, Weaver AL, Wiesen-hutter C, Myers SL, Sides GD. J Rheumatol. 2005;32:417–423. [PubMed] [Google Scholar]
- 34.Zeiher BG, Steingrub J, Laterre PF, Dmitrienko A, Fukiishi Y, Abraham E. Crit Care Med. 2005;33:1741–1748. doi: 10.1097/01.ccm.0000171540.54520.69. [DOI] [PubMed] [Google Scholar]
- 35.Kim YJ, Kim KP, Han SK, Munoz NM, Zhu X, Sano H, Leff AR, Cho W. J Biol Chem. 2002;277:36479–36488. doi: 10.1074/jbc.M205399200. [DOI] [PubMed] [Google Scholar]