

Abstract
Interpreting data from large-scale protein interaction experiments has been a challenging task because of the widespread presence of random false positives. Here, we present a network-based statistical algorithm that overcomes this difficulty and allows us to derive functions of unannotated proteins from large-scale interaction data. Our algorithm uses the insight that if two proteins share significantly larger number of common interaction partners than random, they have close functional associations. Analysis of publicly available data from Saccharomyces cerevisiae reveals >2,800 reliable functional associations, 29% of which involve at least one unannotated protein. By further analyzing these associations, we derive tentative functions for 81 unannotated proteins with high certainty. Our method is not overly sensitive to the false positives present in the data. Even after adding 50% randomly generated interactions to the measured data set, we are able to recover almost all (≈89%) of the original associations.
Alarge number of genes discovered in sequencing projects remain functionally unannotated, motivating significant research in postgenomic biology. High-throughput experiments such as genomewide monitoring of mRNA expressions and protein–protein interaction networks are expected to be fertile sources of information for deriving their functions (1–7). However, a high rate of false positives (8, 9) and the sheer volume of the data are making reliable interpretation of these experiments difficult.
In this work, we are able to overcome these difficulties by using a network-based statistical method that forms reliable functional associations between proteins. Our method ranks the statistical significance of forming shared partnerships for all protein pairs in the interaction network and shows that if two proteins share significantly larger number of common partners than random, they have close functional associations. We derive >2,800 pairs of high-quality associations for Saccharomyces cerevisiae involving 852 proteins in the Supporting Text, which is published as supporting information on the PNAS web site, www.pnas.org. The method is not overly sensitive to the false positives widely present in the two-hybrid data. Even after adding 50% randomly generated interactions to the measured data set, we are able to recover almost all (≈89%) of the original associations. Clustering of these associations reveals the modular nature of the interaction network (10). From the derived modules, we are able to predict functions for 81 unannotated proteins with high certainty. It has been an encouraging sign that the functions of some of these proteins were recently annotated by the Saccharomyces Genome Database (11) from other sources after the completion of our work, and all but one (22 of 23) of our predictions proved to be correct.
Our strategy of assigning statistical significance is to compare the measured protein interaction network with a random network of the same size (12–14). The deviation of the measured network from randomness is presumed to reflect its biological significance. Nonrandom nature of the large-scale protein interaction network has been discussed in earlier work (12, 14, 15). In one example, it was observed that the connectivities of the proteins in the measured interaction networks closely followed a power-law distribution instead of the exponential distribution expected from random networks (9, 12, 14, 15). Useful biological prediction regarding the lethality of the null mutants lacking those highly connected proteins could be made from such nonrandom behavior (12).
Materials and Methods
We hypothesize that if two proteins have significantly larger numbers of common interaction partners in the measured data set than what is expected from a random network, it would suggest close functional links between them. To validate this hypothesis, we rank all possible protein pairs in the order of their probabilities for having the experimentally measured number of common interaction partners by using the probability expression derived below. If the computed probability is extremely small, it signifies that the chosen protein pair has an unusually large number of common partners. Such pairs are considered for further analysis, as we discuss.
Mathematical Expression for Probability. To compute the P value, we count the number of distinct ways in which two proteins with n1 and n2 interaction partners have m in common. We divide the whole set of partners of the two proteins into three nonoverlapping groups: (i) m common protein partners that interact with both protein 1 and 2; (ii) n1 – m partners that interact only with protein 1; and (iii) n2 – m partners that interact only with protein 2. We count the total number of distinct ways of assigning these three groups to N proteins. This is given by
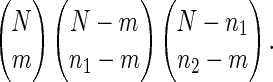 |
[1] |
The first factor is the number of ways to choose the first group from all N proteins. The second term counts the number of ways of choosing the second group from the N – m proteins. Similarly, the third term is for choosing the third group from the remaining N – n1 proteins.
Therefore, the P value is
 |
[2] |
where 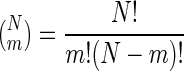 . The denominator is the total number of ways for the two proteins to have n1 and n2 interaction partners regardless of how many are in common. The above expression is symmetric with respect to interchange of n1 and n2.
For the calculations in our article, the results remain approximately the same, whether we compute the probabilities for pairs with exactly m common partners or we compute for m or more partners. It can be checked from the expression of probability in Eq. 2 that probability terms for increasing m fall inversely with N. Since N for our case is ≈5,000, the additional terms in the probability expression are negligible.
Clustering Technique. Our clustering method is as follows. We compute P values for all possible protein pairs and store them in a matrix. Then we pick the protein pair with the smallest P value and choose it as the first group in the cluster. The rows and columns for these two proteins are merged into one row and one column (Fig. 1). Probabilities for this new group are geometric means of the individual probabilities [or arithmetic means of the log(P) values]. The process is continued repeatedly, thus adding more and more clusters or making the existing ones bigger, until a chosen threshold is reached.
Fig. 1.

In our clustering algorithm, we start with a matrix with P values for all pairs. If the element (m, n) has the smallest P value, a cluster is formed with proteins m and n. Therefore, rows/columns m and n are merged with new P value of the merged row/column as geometric mean of the separate P values of the corresponding elements.
Results
The described method is applied on the available experimental data from budding yeast (S. cerevisiae) collected in the DIP (Database of Interacting Proteins) database from several sources (16). The September 1, 2002, update of the DIP data set containing 14,871 interactions for 4,692 proteins is used. In Fig. 2, we show a plot with probabilities for all protein pairs in the network sorted in increasing order. For comparison, we also show corresponding probabilities for a random network of similar size and a randomized version of the measured network. The random network has the same number of nodes and edges as the measured network, but the connections are made from a uniform distribution. The randomization of the experimental network is done by using a method similar to ref. 14. The method allows us to maintain the power-law nature of the network. As we observe from the plot, the probabilities of some of the associations in the measured network are up to 40 orders of magnitude lower than both of the randomly constructed networks. Therefore, it is safe to conclude that those associations are not artifacts caused by experimental noise, but contain biologically meaningful information. It is also clear from the plot that such low probability associations did not arise from the scale-free nature of the network (12).
Fig. 2.

Probabilities of associations for all possible protein pairs derived by using our method. Solid black line: measured protein interaction network (16); broken line, a random network of similar size constructed by connecting randomly chosen nodes; dotted line, a random network constructed from the measured network keeping its power-law connectivity property unchanged (14). The probabilities of associations for the measured network are up to 40 orders of magnitude lower than the random networks.
To understand what biological information is provided by such low-probability pairs, we inspect all pairs with probabilities below a cutoff value of 10–8.† The detailed list is provided on our web site, www.nas.nasa.gov/bio. The group consists of 2,833 protein pairs involving 852 proteins. A strong functional link is observed among proteins in these pairs, thus validating our hypothesis. This is illustrated in Table 1, where we present the 10 pairs with the lowest probabilities. As we can see from Table 1, both proteins usually either belong to the same complex or are parts of the same functional pathway. The same trend is generally true for the larger data set presented in Table 6. By manually inspecting the top 100 pairs, we found that in >95% of them both proteins have similar function.
Table 1. The 10 protein pairs with the lowest probabilities based on our method, along with their functions.
| Protein 1 | Protein 2 | Log(p) | Function |
|---|---|---|---|
| MYO3 | MYO5 | -47.41 | Class I myosins |
| ROX3 | SRB6 | -46.12 | Mediator complex |
| KRR1 | PWP2 | -45.50 | snoRNA complex |
| ROX3 | MED2 | -44.94 | Mediator complex |
| MED2 | SRB6 | -42.19 | Mediator complex |
| ATP1 | ATP2 | -42.17 | ATP complex |
| KAP95 | SRP1 | -41.25 | Protein import-export |
| PRE1 | RPN10 | -40.58 | Spliceosome complex |
| YKR081C | YNL110C | -40.33 | Both unannotated |
| RPT1 | RPN6 | -40.07 | Spliceosome complex |
We find both of the proteins in these pairs to belong to either the same complexes or the same functional pathways. The complete list is provided in Table 6, which is published as supporting information on the PNAS web site and on our web site (www.nas.nasa.gov/bio).
We can take advantage of the above observation to predict the functions of the unannotated proteins. About 29% of the 2,833 chosen pairs contain at least one unannotated protein.‡ To assign a function to any one of them, we determine the other proteins with which it forms associations. As an example, in Table 2 we show that the unannotated protein YKL059C shares partners with many proteins involved in transcription. Therefore, it is most likely also involved in transcription. Moreover, from the low probabilities of associations with CFT2 and CFT1, we strongly suspect that that YKL059C is involved in pre-mRNA 3′ end processing. This notion is further confirmed by the clustering method that we present below. Our web site (www.nas.nasa.gov/bio) provides an interactive tool for users to search for the close associates of any query protein and thus derive its putative function.
Table 2. Top associations of unannotated protein YKL059C.
| Associations of YKL059C | Log(p) |
|---|---|
| CFT2[T] | -32.430607 |
| CFT1[T] | -30.151475 |
| YSH1[T] | -28.320081 |
| PTA1[T] | -27.843331 |
| PAP1[T] | -27.410048 |
| REF2[T] | -25.048611 |
| PFS2[T] | -24.638901 |
| YTH1[T] | -23.247919 |
| FIP1[T] | -21.609526 |
| HCA4[T] | -21.285573 |
| YGR156W[U] | -17.961537 |
| RNA14[T] | -17.732432 |
| SWD2[U] | -14.407007 |
| GLC7[C] | -13.284243 |
| YOR179C[T] | -12.636400 |
| PCF11[T] | -8.857110 |
Categories: T, transcription; U, unannotated protein; C, cellular fate/organization. Most of the associations of YKL059C are involved in transcription and therefore it is expected to do the same. From its very low probabilities of associating with CFT1 and CFT2, it is strongly suspected to be involved in pre-mRNA 3′ end processing. Our web site (www.nas.nasa.gov/bio) provides an interactive tool to search for the associates of any protein.
Since functionally related proteins form strong associations with each other, this can be used as the basis for an algorithm to cluster them into functional modules. We derive 202 modules (Table 5 and Supporting Text) from the associations and then compare the annotations of constituent proteins. A total of 163 of the derived modules have all proteins annotated in the Saccharomyces Genome Database (11), and we find 149 of them (≈92%) to have all members of the module from the same functional complex or pathway. Therefore, if an unannotated protein belongs to the same module with other proteins of known functions, we can predict its function to be the same as the other ones with high confidence. By analyzing the derived modules, we predict functions for 81 unannotated proteins and present them in Table 3.
Table 3. Predicted functions of previously unannotated proteins.
| Protein | Predicted function |
|---|---|
| YFR024C-A (YSC85), YHR114W (BZZ1)*, YNL094W (APP1), YMR192W (APP2) | Actin filament organization |
| YGR268C (HUA1), YOR284W (HUA2), YPR171W (BSP1) | Actin patch assembly |
| YJR083C (ACF4) | Actin cytoskeleton organization and biogenesis |
| YDR036C (EHD3) | Protein biosynthesis in mitochondrial small ribosomal subunit |
| YKL214C (YRA2)* | mRNA processing/RNA metabolism |
| YNL207W (RIO2) | Nucleolar protein involved in 40S ribosomal biogenesis |
| YLR409C (UTP21), YKR060W (UTP30), YGR090W (UTP22), YER082C(UTP7)*, YJL069C(UTP18)*, YBR247C (ENP1) | Associated with U3 snoRNA and 20S rRNA biosynthesis |
| YMR288W (HSH155)* | snRNA binding involved in mRNA splicing |
| YHR197W (RIX1), YNL182C (IPI3), YLR106C (MDN1)* | Ribosomal large subunit assembly and maintenance |
| YGR128C (UTP8)* | Processing of 20S pre-rRNA |
| YGR215W (RSM27)*, YGL129C (RSM23)* | Structural constituent of ribosome |
| YDL213C (NOP6) | rRNA processing/transcription elongation |
| YNL306W (MRPS18)* | Mitochondrial small ribosomal subunit |
| YPR144C (UTP19), YDL148C (NOP14)*, YLR186W (EMG1), YJL109C (UTP10)*, YBL004W (UTP20) | snoRNA binding, 35S primary transcript processing |
| YGL099W (LSG1)*, YDR101C (ARX1) | 27S pre-rRNA ribosomal subunit |
| YOL077C (BRX1), YOR206W (NOC2), YNL135C (FPR1) | Biogenesis and transport of ribosome |
| YOR145C (DIM2) | 35S Primary transcript processing and rRNA modification |
| YEL015W (DCP3) | Deadenylation dependent decapping and mRNA catabolism |
| YDL002C (NHP10), YLR176C (RFX1)* | Modification of chromatin architecture/transcription |
| YDR469W (SDC1)* | Chromatin silencing and histone methylation |
| YPL070W (MUK1) | Transcription factor (or its carrier) |
| YLR427W (MAG2) | DNA N-glycosylase involved in DNA dealkylation |
| YDL076C (RXT3), YIL112W (HOS4) | Histone deacetylase complex involved in chromatin silencing |
| YNL265C (IST1) | Transcription initiation factor |
| YLR192C (HCR1)* | Translation initiation as part of elF3 complex |
| YDL074C (BRE1) | Chromosome condensation and segregation process |
| YGR156W (PTT1)*, YKL059C (MPE1)* | mRNA cleavage and polyadenylation specificity factor |
| YGR089W (NNF2) | Chromosome segregation (spindle pole) and mitosis |
| YGL161C(YIP5), YGL198W (YIP4) | Vescicle mediated transport |
| YPL246C (RBD2), YJL151C (SNA3), YGL104C (VPS73) [20], YKR030W (MSG1) | Cell wall synthesis/protein-vacuolar targeting |
| YBR098W (MMS4) | Golgi to endosome transport and vescicle organization |
| YHR105W (YPT35) | Golgi to vacuolar transport |
| YBL049W (MOH1), YCL039W (MOH2) | Both same function. Possibly linked with vacuolar transport |
| YDL246C (SOR2) | Possibly involved in fructose and mannose metabolism |
| YMR322C (SNO4) | Pyridoxine metabolism |
| YDR430C (CYM1) | Protein involved in pyurvate metabolism |
| YJL199C (MBB1), YPL004C (LSP1), YGR086C (PIL1) | Metabolic protein |
| YLR097C (HRT3) | Nuclear ubiquitine ligase |
| YKR046C (PET10) | ATP/ADP exchange |
| YEL017W (GTT3) | Protein linked with glutathione metabolism |
| YGL133W (ITC1) | Chromatin remodeling |
| YGR161C (RTS3) | Protein phosphatase 2A complex |
| YOR144C (EFD1) | DNA replication and repair |
| YML117W (NAB6) | Nuclear RNA binding |
| YLR432W (IMD3) | RNA helicase involved in mRNA splicing |
| YKL095W (YJU2), YGR278W (CWC22), YDL209C (CWC2)* | Spliceosome complex involved in mRNA splicing |
| YGR232W (NAS6)*, YGL004C (RPN14), YLR421C (RPN13)* | Proteasome complex |
These proteins recently were annotated in the Saccharomyces Genome Database. Except for LSG1, all other predictions provided to be correct.
Discussion
We note that the chosen cut-off value (10–8) is not a sharp threshold. As the number is increased, the amount of biologically meaningful information degrades gradually. In the case of the modules, their numbers and sizes increase with increasing cutoff. As an example, for the well-studied mediator complex shown in Fig. 3a, as we increase the cut-off value, more proteins known to be part of the complex come together. We find that even with a cut-off as high as 2 × 10⁻⁴, the proteins included in the mediator module are genuinely related to the complex (see Supporting Text and Fig. 6, which is published as supporting information on the PNAS web site). In our web site (www.nas.nasa.gov/bio) we present an interactive program that allows users to choose different cut-off values and obtain the corresponding modules. Among the additional modules derived with higher threshold, we find two that contain mostly unannotated proteins and therefore are possibly large complexes not yet well studied by experimentalists. One of them is suspected to be involved in actin cytoskeleton organization and protein vacuolar targeting and the other one in splicing, rRNA processing, and small nucleolar RNA processing. We present them in Figs. 4 and 5, expecting their identification to spur additional interest among yeast biologists.
Fig. 3.

Functional modules obtained by clustering the low-probability associations by using an algorithm described in our article. All proteins from each of these derived modules belong to the same functional complexes. (a) Polymerase II transcription mediator complex. (b) Chaperon ring complex. (c) Nuclear pore complex. (d) Oligosaccharyl transferase complex. (e) Arp2/3 complex. (f) ATP synthase complex. The complete list of modules is provided in Table 5, which is published as supporting information on the PNAS web site (see Supporting Text).
Fig. 4.

A module identified by our method consisting of proteins presumably involved in assembly and maintenance of small nucleolar ribosomal complex.
Fig. 5.

A module identified by our method consisting of proteins presumably involved in actin cytoskeleton organization and protein vacuolar transport.
The method presented here has several advantages. First, it is not sensitive to random false positives. To verify, we added connections randomly without changing the power-law nature of the network (14). Even after increasing the average number of interactions by 50%, we were able to recover 89% of the top 2,833 associations. The probability values for the associations went down in the noisy network, but their relative order did not change significantly. Second, the method is not biased by the number of partners a protein has. As an example, JSN1, a nuclear pore protein, has the largest number of interactions in the measured data set, but none of the 2,833 associations derived by our method contains JSN1 (see Supporting Text and Fig. 7, which is published as supporting information on the PNAS web site). Among the drawbacks, our method may not uncover all of the functions for the proteins, including some multidomain proteins conducting many different functions in the cell (17). However, for the large group of still unannotated proteins, our predictions can be a good starting point to motivate further experiments.
Wolfe and Shields (19) proposed the possibility of duplication of the entire yeast genome in some distant past and presented a list of genes that were identical or matched closely because of this event. We checked how many of the associations derived by us are also such ancient paralogs and present them in Table 4. We find 22 such ancient paralogs among the list of top 2,833 pairs (0.7%). Therefore, these are the ancient paralogs that maintained their functions over time.
Table 4.
Associations derived by us that were also ancient paralogs according to ref. 19
| Protein 1 | Protein 2 | Ranking |
|---|---|---|
| MYO3 | MYO5 | 1 |
| GIC1 | GIC2 | 72 |
| TIF4632 | TIF4631 | 145 |
| NUP100 | NUP116 | 476 |
| HSC82 | HSP82 | 485 |
| ZDS1 | ZDS2 | 564 |
| PPH21 | PPH22 | 579 |
| KCC4 | GIN4 | 606 |
| RFC3 | RFC4 | 634 |
| CLN1 | CLN2 | 918 |
| GSP2 | GSP1 | 1,288 |
| YPT32 | YPT31 | 1,550 |
| BOI1 | BOI2 | 1,640 |
| SEC4 | YPT7 | 1,785 |
| YPT53 | VPS21 | 1,888 |
| BMH1 | BMH2 | 1,920 |
| PCL7 | PCL6 | 1,926 |
| YGR010W | YLR328W | 2,162 |
| MYO4 | MYO2 | 2,474 |
| SAP190 | SAP185 | 2,721 |
| MKK1 | MKK2 | 2,725 |
| IMD4 | YLR432W | 2,746 |
The third column represents the ranking for the pairs in the list of associations sorted according to increasing probabilities. The list is also available in Table 6 (see Supporting Text).
In conclusion, we derived functional modules and reliably predicted functions of unannotated proteins from the existence of abnormally large number of shared interaction partners in the protein–protein interaction network. We believe the real power of the method will be in studying the higher eukaryotes, where the higher fraction of genes has unknown functions. Moreover, the method is applicable to other forms of networks, such as the internet, metabolic networks, social networks, and predator-prey networks.
Supplementary Material
Acknowledgments
We thank H. Li and R.-F. Yeh for useful suggestions and B. A. Biegel, T. R. Govindan, and K. J. Harrington for critical reading of the manuscript. M.P.S. is supported by National Aeronautics and Space Administration Contract DTTS59-99D0437/A61812D to Computer Sciences Corporation. S.L. is supported by National Aeronautics and Space Administration Ames Research Center Director Discretionary Fund and Computing, Information, and Communications Technology Program.
This paper was submitted directly (Track II) to the PNAS office.
Footnotes
Since the data set contains N = 4,692 proteins, 1/N2 ≈ 10–8 is a reasonable cutoff. The number is validated by more rigorous comparison with the random network shown in Fig. 2. However, this is not a sharp threshold as we discuss in more detail. Therefore, we present pairs up to 2 ×10⁻⁴ on our web site at www.nas.nasa.gov/bio.
Here, we use the functional classes and annotations provided in ref. 9. The actual number of unannotated proteins at present may be lower than this source.
References
- 1.Gavin, A. C., Bosche, M., Krause, R., Grandi, P., Marzioch, M., Bauer, A., Schultz, J., Rick, J. M., Michon, A. M., Cruciat, C. M., et al. (2002) Nature 415 141–147. [DOI] [PubMed] [Google Scholar]
- 2.Ho, Y., Gruhler, A., Heilbut, A., Bader, G. D., Moore, L., Adams, S. L., Millar, A., Taylor, P., Bennett, K., Boutilier, K., et al. (2002) Nature 415 180–183. [DOI] [PubMed] [Google Scholar]
- 3.Ito, T., Chiba, T., Ozawa, R., Yoshida, M., Hattori, M. & Sakaki, Y. (2001) Proc. Natl Acad. Sci. USA 98 4569–4574. [DOI] [PMC free article] [PubMed] [Google Scholar]
- 4.Uetz, P., Giot, L., Cagney, G., Mansfield, T. A., Judson, R. S., Knight, J. R., Lockshon, D., Narayan, V., Srinivasan, M., Pochart, P., et al. (2000) Nature 403 623–627. [DOI] [PubMed] [Google Scholar]
- 5.Tong, A. H., Evangelista, M., Parsons, A. B., Xu, H., Bader, G. D., Page, N., Robinson, M., Raghibizadeh, S., Hogue, C. W., Andrews, H. B. B., et al. (2001) Science 294 2364–2368. [DOI] [PubMed] [Google Scholar]
- 6.Zhu, H., Bilgin, M., Bangham, R., Hall, D., Casamayor, A., Bertone, P., Lan, N., Jansen, R., Bidlingmaier, S., Houfek, T., et al. (2001) Science 293 2101–2105. [DOI] [PubMed] [Google Scholar]
- 7.Grünenfelder, B. & Winzeler, E. A. (2002) Nat. Rev. Genet. 3 653–661. [DOI] [PubMed] [Google Scholar]
- 8.Uetz, P. & Hughes, R. (2000) Curr. Opin. Microbiol. 3 303–308. [DOI] [PubMed] [Google Scholar]
- 9.von Mering, C., Krause, R., Snel, B., Cornell, M., Oliver, S. G., Fields, S. & Bork, P. (2002) Nature 417 399–403. [DOI] [PubMed] [Google Scholar]
- 10.Hartwell, L. H., Hopfield, J. J., Liebler, S. & & Murray, A. W. (1999) Nature 402 C47–C52. [DOI] [PubMed] [Google Scholar]
- 11.Cherry, J. M., Adler, C., Ball, C., Chervitz, S. A., Dwight, S. S., Hester, E. T., Jia, Y., Juvik, G., Roe, T., Schroeder, M., et al. (1998) Nucleic Acids Res. 26 73–79. [DOI] [PMC free article] [PubMed] [Google Scholar]
- 12.Jeong, H., Mason, S. P., Barabasi, A.-L. & Oltvai, Z. N. (2001) Nature 411 41–42. [DOI] [PubMed] [Google Scholar]
- 13.Jeong, H., Tambor, B., Albert, R., Oltvai, Z. N. & Barabasi, A.-L. (2000) Nature 407 651–654. [DOI] [PubMed] [Google Scholar]
- 14.Maslov, S. & Sneppen, K. (2002) Science 296 910–913. [DOI] [PubMed] [Google Scholar]
- 15.Bader, G. D. & Hogue, C. W. V. (2002) Nat. Biotechnol. 20 991–997. [DOI] [PubMed] [Google Scholar]
- 16.Deane, C. M., Salwinski, L., Xenarios, I. & Eisenberg, D. (2002) Mol. Cell. Proteomics 15 349–356. [DOI] [PubMed] [Google Scholar]
- 17.Dokholyan, N. V., Shakhnovich, B. & Shakhnovich, E. I. (2002) Proc. Natl. Acad. Sci. USA 99 14132–14136. [DOI] [PMC free article] [PubMed] [Google Scholar]
- 18.Shakhnovich, B. E., Dokholyan, N. V., DeLisi, C. & Shakhnovich, E. I. (2003) J. Mol. Biol. 326 1–9. [DOI] [PubMed] [Google Scholar]
- 19.Wolfe, K. & Shields, D. C. (1997) Nature 387 708–713. [DOI] [PubMed] [Google Scholar]
Associated Data
This section collects any data citations, data availability statements, or supplementary materials included in this article.