Abstract
We studied the structure of the C terminus of the Shaker potassium channel. The 3D structures of the full-length and a C-terminal deletion (ΔC) mutant of Shaker were determined by electron microscopy and single-particle analysis. The difference map between the full-length and the truncated channels clearly shows a compact density, located on the sides of the T1 domain, that corresponds to a large part of the C terminus. We also expressed and purified both WT and ΔC Shaker, assembled with the rat Kvβ2-subunit. By using a difference map between the full-length and truncated Shaker α–β complexes, a conformational change was identified that shifts a large part of the C terminus away from the membrane domain and into close contact with the β-subunit. This conformational change, induced by the binding of the Kvβ2-subunit, suggests a possible mechanism for the modulation of the K+ voltage-gated channel function by its β-subunit.
Keywords: C-terminal deletion, electron microscopy, single-particle analysis
K+ voltage-gated (Kv) channels play a fundamental role in the generation of electrical pulses and the regulation of the membrane potential in brain and neuronal connections (1, 2). All Kv channels share a similar architecture: the transmembrane domain consists of four identical subunits, each with six segments, from S1 to S6 (3), including the voltage sensor (S4). The cytoplasmic region of the channel includes ≈15 kDa of the N-terminal T1 domain and ≈18 kDa of the C terminus. The functional role of the N-terminal domain was extensively studied during the last decade; it was found to be responsible for the process known as “N-type inactivation” in Shaker-like K+ channels (1, 4, 5). The N-terminal T1 domain promotes tetramerization of the Kvα subunits (Kvα) in early channel ontogeny (6–8) and provides a platform for the binding of the Kvβ subunit (Kvβ) (9). The functional role of the C-terminal region in Shaker-like Kv channels, however, is less clear.
It is known that in Shaker-like K+ channels, C termini are involved in a variety of processes that range from channel gating (10, 11) and voltage sensitivity (4) to the binding of the membrane-associated guanylate kinases (12). They also participate in channel assembly in Kv 2.1 (13, 14). All members of the Shaker subfamily of Kv channels display a remarkable amino acid sequence conservation within the distal region of their C termini, characterized by the –T/SDV motif (10, 12).
It is not known whether the C termini of Kv channels assume a well defined 3D structure, but there is an increasing number of examples of the C-terminal domain of K+ channels assuming highly ordered structures, which play a fundamental role in channel function (15, 16). Furthermore, Ju et al. (14) have recently proposed that the gating of the Kv2.1 channel is strongly influenced by specific interactions between the N- and C-terminal domains, suggesting they do assume a well defined 3D structure. Finally, the 3D structure of the full-length Shaker potassium channel α-subunit at 25-Å resolution (17) revealed a larger membrane-embedded domain and a smaller cytoplasmic domain, conjoined by four thin connectors resembling a “hanging gondola” (18). The volume of the cytoplasmic domain appeared sufficiently large to accommodate both the N-terminal T1 domain and part of the C-terminal region, suggesting that the C terminus assumes a well defined structure.
Auxiliary β subunits bind to the α-subunit tetramer to form a heterooctameric complex (19, 20). The binding occurs through the interaction of the Kvβ C terminus with conserved loops in the Kvα subunit (Kvα) N-terminal T1 domain (9). Kvβ is known to modulate both the biosynthesis and the function of Kv channels. Coexpression of Kvβ with Kvα enhances channel synthesis and cell surface targeting (21–23). Coexpression of either Kvβ1 or -3 with Kvα results in a dramatic acceleration of Kv channels inactivation (24, 25). The N termini of Kvβ1 and Kvβ3, which are highly homologous to the Kv inactivation peptide endogenous to Kvα, are responsible for this enhanced inactivation. In contrast, the N terminus of Kvβ2 is significantly shorter and does not contain an inactivation peptide. It was also shown that Kvβ2 accelerates a C-type inactivation of Kv1.4 channels (26) and the activation of Kv1.5 channels, and that it alters the activation threshold of Kv1.1 and Kv1.5 channels (27). In vivo, Kvβ2 can also indirectly modulate Kv channel inactivation by competing with other Kvβ (Kvβ1 or -3) for Kvα-binding sites (28).
The crystal structure of the T1–Kvβ2 complex of rat Kv1.1 was solved (9), but it does not show the location of the Kvα C terminus, nor was the position of the C terminus identified in a recent low-resolution 3D structure of the native Kv1(α)4–(β)4 complex from mammalian brain (20).
Here, we present a 3D structure of Shaker at 23-Å resolution that is lacking 152 amino acids from the C terminus and compare it to a refined 3D structure of the full-length Shaker. Our difference map shows that the compact C terminus surrounds the T1 domain. We also expressed and purified both WT and ΔC Shaker, assembled with rat Kvβ2. The difference map between 2D projections of WT and ΔC Shaker α–β complexes indicates a clear conformational change in the Shaker C terminus on binding of Kvβ2.
Methods
Materials. All chemicals, unless otherwise specified, were purchased from Sigma. SpeI restriction enzyme, T4 DNA ligase, and the Lipofectamine 2000 kit were purchased from Invitrogen. 1D4 antibodies were purchased from the National Cell Culture Center (Minneapolis), and the 1D4 elution peptide was purchased from American Peptide (Sunnyvale, CA). The protease inhibitor minitablets were purchased from Pierce. The Kvβ2 rat construct in pRGB4 mammalian expression vector was the generous gift of J. Trimmer (Stony Brook University, Stony Brook, NY) (21). The mouse monoclonal antibodies against Kvβ2 were also donated by J. Trimmer (29).
Construction of cDNAs. Inactivation-removed (Δ6–46) ShakerB construct in pMT3 mammalian expression vector was used (30), carrying the point mutation F425G (31) and a 1D4 tag at the end of the C terminus for affinity column purification (32). In our work, this is referred to as the “WT” or “full-length” Shaker. The C-terminal deletion (ΔC) mutant of Shaker was generated by SpeI restriction enzyme digestion of WT Shaker cDNA and subsequent ligation by using T4 DNA ligase. In the mutant construct, residues 503–655 were deleted. The first N-terminal amino acid (E1) of the 1D4 tag was also removed. Twenty-three amino acids remained on the C terminus between the S6 transmembrane segment and the 1D4 tag.
Protein Expression and Purification. Shaker WT and ΔC mutant channels and α–β complexes were expressed in COS-1 cells at 37°C, under 5% CO2 atmosphere, and in high-glucose DMEM with 10% FBS. Lipofectamine-2000 transient transfection was performed when the cells were at 70% confluence. For cotransfection of Shaker α-subunit with Kvβ2, a DNA ratio of 1:3 was used, as described in ref. 21. Cells were harvested with a cell scraper on the third day after transfection, washed twice with ice-cold PBS, and transferred to a plastic centrifuge tube. Whole cells were solubilized in 2.5% 3-[(3-cholamidopropyl)dimethylammonio]-1-propanesulfonate (CHAPS) in solubilization buffer (17) at 4°C for 30 min, and subsequently centrifugated at 3,000 × g for 10 min to remove cellular debris. Purification was performed on a 1D4 affinity column (32). The channel was eluted by using 1D4 peptide solution (0.2 mg/ml) in elution buffer containing (in mM): KCl 80, NaEDTA 2, Hepes-KOH 40, NaCl 300 at pH 7.4, 0.5% CHAPS, and protease inhibitors). [3H]NEM-labeled agitoxin was used to quantify the fraction of correctly folded Shaker channels, both with and without Kvβ2, as described before (17). Briefly, [3H]NEM-labeled agitoxin was added to the elution fractions to a final concentration of 12.5 nM and, after 30-min incubation on ice, the unbound toxin was separated from the Shaker–toxin complex on a Microcon filtering device (pore size 100 μm, Millipore).
Single-Particle Electron Microscopy (EM). Purified protein was immediately applied to a glow-discharged carbon-coated copper grid and subjected to 1% uranyl acetate solution. Grids were examined in a CM12 Philips electron microscope (FEI, Hillsboro, OR) at 120 kV under low-dose conditions. Images were taken at ×60,000 and 1.5–1.8 μm underfocus. The negatives were digitized on a Zeiss SCAI scanner at 7-μm pixel resolution, giving a final pixel size that corresponded to 3.5 Å per pixel on the specimen after 3 × 3 pixel averaging. Image processing was performed as described in ref. 17 by using the computer program imagic (33). The structure was refined, and the images were corrected for the contrast transfer function by using the program frealign (34). 3D surface views were generated with the molecular viewer chimera (35). 3D difference maps were calculated by using the spider operation dr diff (36). This operation determines a scaling factor and additive constant to scale one of the density maps such that the relative errors between the densities are minimized. The resulting 3D difference map was than filtered at 23-Å resolution.
Results
Protein Expression and Purification. The surface expression level in COS-1 cells was determined by using a whole-cell [3H]NEM-agitoxin-binding assay and was similar for both WT and ΔC mutant channels, although slightly higher for the WT channel (Table 1), consistent with previous results for other Shaker-like K+ channels (10, 37). The yield of correctly folded truncated Shaker channels after affinity purification was 42% of the total protein, compared with ≈30% for the WT channel (17). Coexpression of either full-length or truncated channel with rat Kvβ2 increased surface expression by ≈25%, consistent with immunofluorescent staining data (21, 38). Binding of Kvβ does not change the comparative yields of detergent purified channels (Table 1).
Table 1. Results of [3H]NEM-agitoxin-binding assays for Shaker channel preparations, expressed in COS-1 cells.
| Sample | Whole cell surface, pmol/plate | Purified protein, pmol/plate |
|---|---|---|
| WT Shaker α-subunit | 0.97 ± 0.02 | 0.33 ± 0.015 |
| ΔC Shaker α-subunit | 0.89 ± 0.04 | 0.38 ± 0.04 |
| WT Shaker α—β complex | 1.24 ± 0.12 | 0.33 ± 0.02 |
| ΔC Shaker α—β complex | 1.13 ± 0.12 | 0.35 ± 0.08 |
Influence of ΔC and β2-subunit binding.
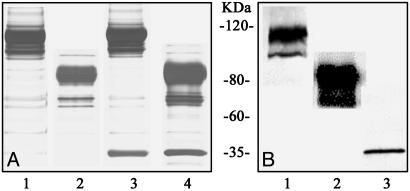
SDS/PAGE analysis and immunoblotting show a series of major bands located between 80 and 120 kDa, representing the full-length Shaker monomer at different stages of maturation (different degrees of glycosylation) (Fig. 1 A, lanes 1 and 3, and B, lane 1). The major bands of the glycosylated ΔC Shaker monomer shift down to the location between 62 and 100 kDa (Fig. 1 A, lanes 2 and 4, and B, lane 2). We used the 1D4 affinity tag, attached to the C terminus of the α-subunit to copurify the β-subunit. The purified WT Shaker α–β complex produced two bands on a silver-stained gel (Fig. 1 A, lane 3). The major broad band was confirmed by immunoblotting (Fig. 1B, lane 1) to be the glycosylated full-length Shaker monomer, whereas the sharper band at 36 kDa represents the Kvβ2-subunit (Fig. 1B, lane 3). The copurification of Shaker and Kvβ2 confirms assembly of the WT Shaker α–β complex. The purified ΔC Shaker α–β complex also revealed two bands on silver-staining gel (Fig. 1 A, lane 4). The occupancy of Kvβ in the complex was at least 15%, estimated by optical density of the corrresponding bands on the gel.
Fig. 1.
Purification of Shaker and Shaker α–β complexes. Twenty microliters of undiluted protein detergent solution with 5 μl of loading buffer was loaded onto a gradient 4–12% SDS/PAGE gel (BioRad). (A) Silver nitrate-stained gel. Lane 1, glycosylated WT Shaker monomer; lane 2, glycosylated ΔC Shaker monomer; lane 3, WT Shaker α–β complex; lane 4, ΔC Shaker α–β complex. (B) Western blot. Mouse monoclonal antibody directed against 1D4 tag was used as primary antibody in lanes 1 and 2, mouse monoclonal antibody directed against the Kvβ was used as primary antibody in lane 3.
Localization of the C Terminus Within the 3D Structure of Shaker. To locate the precise position of the C terminus within the Shaker channel, we reconstructed the 3D structures of both WT and ΔC Shaker and calculated the difference map between these two structures.
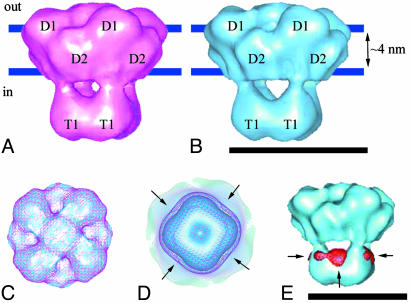
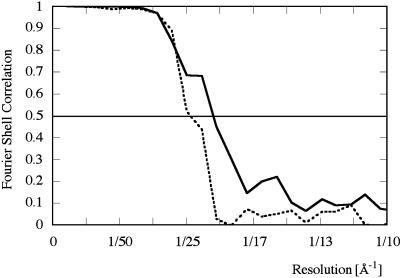
The new refined 3D structure of WT Shaker was calculated by using 15,000 images of negatively stained channel particles. The refined structure of WT Shaker is shown in Fig. 3A and reveals the same characteristic features previously seen (17). The resolution of this newly refined structure is 20 Å, estimated by the Fourier shell correlation between two reconstructions calculated from two half-sets of the data (Fig. 2). The larger membrane domain is divided into two separate globular subdomains, D1 and D2 (Fig. 3A), that are situated close to the extracellular side and cytoplasmic side of the membrane, respectively. These two domains were not apparent in the previously described structure of WT Shaker (17). The approximate mass of each subdomain is 30 kDa, according to its total volume and an average protein density of 810 Da/nm3 (39).
Fig. 3.
3D structures of WT Shaker and ΔC Shaker.(A)WT Shaker: D1 and D2 are subdomains within the membrane-embedded domain; T1 is the tetramerization domain. Blue lines represent the approximate position of the membrane. (B) ΔC Shaker: The designation of the subdomains is the same as above. (C) Superimposed WT Shaker (purple mesh) and ΔC Shaker (solid blue), viewed from the extracellular side. (D) View from the intracellular side. Arrows mark the location of the compact C termini of WT Shaker. (E) 3D difference map between WT and ΔC Shaker: Arrows point at the difference density (red mesh) superimposed onto the ΔC Shaker structure (solid blue). (Bars = 10 nm.)
Fig. 2.
Fourier shell correlation plot for the WT (solid line) and ΔC mutant structure (dotted line), calculated between structures each containing one-half of the data.
The 3D reconstruction of ΔC Shaker was determined by using 7,500 images (Fig. 3B), resulting in a structure with a resolution of 23 Å (Fig. 2). The shape and size of its membrane domain coincides with that of WT Shaker (Fig. 3C), whereas its cytoplasmic domain was somewhat smaller (Fig. 3D). The four windows separating the membrane and the cytoplasmic domains are larger in the ΔC Shaker structure (Fig. 3B). Density found at the sides of the cytoplasmic domain of WT Shaker that extends beyond the density of the ΔC mutant (Fig. 3D, arrows) could accommodate part of the C terminus. This additional density gives rise to peaks in the difference map between the WT and truncated Shaker 3D structures (arrows in Fig. 3E). The volume of the difference peaks in Fig. 3E corresponds to 10 kDa per peak. However, the volume of the difference peaks depends on the density threshold used to contour the surface of the difference density. For example, the threshold can be lowered such that the volume of the peaks includes 15 kDa per peak. In addition, noise peaks on the fourfold symmetry axis are amplified. Therefore, a precise value for the included mass in the difference peaks cannot be ascertained.
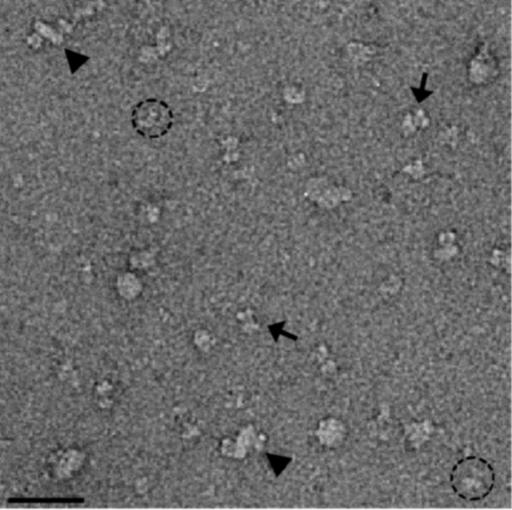
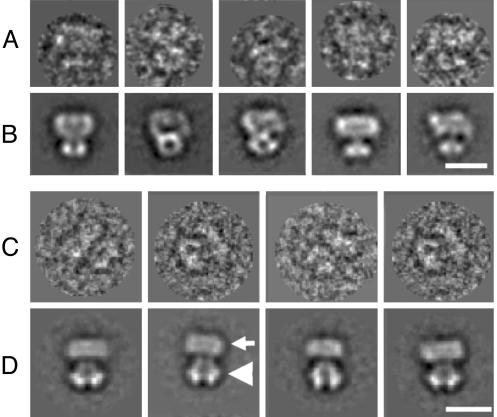
EM of Shaker (α)4–(β)4 Complex. Images of negatively stained Shaker α–β complexes (Fig. 4) show three different types of particles. The smaller mushroom-shaped particles of ≈10-nm diameter (dotted circles) represent the previously observed Shaker α-subunits, whereas the larger complexes of ≈20–30-nm diameter (triangles) represent aggregates; both types of particles were excluded from further analysis. Alignment and classification of the third type of particles (butterfly-shaped, arrows in Fig. 4) yield several class averages of similar appearance (Fig. 5D). Comparison with the class averages of WT Shaker (Fig. 5B) suggests that these classes represent α–β complexes. This is further confirmed by comparing the extra density in the α–β complexes with the crystal structure of the β-subunit (see Discussion and Fig. 7). The class averages of Shaker α–β complexes were virtually identical to those of the native Kv1α–β complexes, purified from bovine brain (20), including the overall shape and dimensions of particles, as well as the presence of mirror symmetry in the class averages. This identity further confirms the presence of both α- and β-subunits and even-fold symmetry of our complexes.
Fig. 4.
Image of negatively stained full-length Shaker α–β complex. Arrows point at particles used for further analysis; dashed circles mark unbound Shaker channels; triangles mark aggregates that could represent dimers of different Shaker-related complexes (α/α, α/α-β, α-β/α-β). (Bar = 50 nm.)
Fig. 5.
Image processing of Shaker Kvα and Shaker α–β complexes. (A) Filtered single images of Shaker at different orientations. The random orientations allow calculation of the 3D reconstruction. (B) Class averages of Shaker at different orientations. (C) Filtered single Shaker α–β complexes. (D) Class averages of Shaker α–β complexes. The mushroom-shaped Kvα is positioned at the top of the complex (white arrow), and the Kvβ (triangle) is attached to the T1 domain. (Bar = 10 nm.)
Fig. 7.
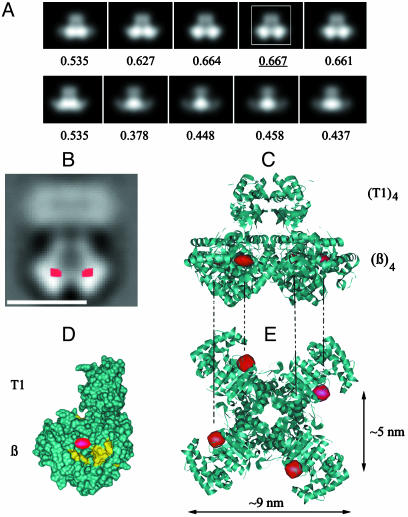
Interpretation of the difference map between WT and ΔC α–β complexes. (A) Projection views of (T1)4–(β)4 complex, each filtered at 20-Å resolution, successively rotated by 9° around its fourfold symmetry axis and aligned by using the bottom part of the complex in Fig. 6F as a reference. Numbers on the bottom represent correlation coefficients between reference and the aligned complex. The projection with the highest correlation coefficient is marked with a white box. (B) The difference map (in red) superimposed onto the 2D average of the WT Shaker α–β complexes. (Bar = 10 nm.) (C) Ribbon structure of (T1)4–(β)4 complex (9) in an orientation corresponding to the view in B. Red densities mark the locations of the compact parts of the Kvα C termini. (D) Molecular surface of one of the four T1-Kvβ in the same orientation as the T1–β complex in the previous picture. The Kvβ active site is colored in yellow. (E) Same structure as in C, rotated by 90°.
The stoichiometric presence of the β-subunit in the butterfly-shaped particles to form an (α)4–(β)4 complex is not immediately apparent from the images. However, because all class averages obtained form these images (some are shown in Fig. 5D) look virtually identical, the stoichiometry of the complexes must be uniform. Furthermore, the close resemblance of the these class averages with those obtained from native Kv1 (α)4–(β)4 complexes (20) suggests that our complexes have the same stoichiometry. Last, the T1 domain and Kvβ2-subunit form a stable (T1)4–(β)4 complex (9), again suggesting the presence of 4 Kvβ2-subunits in our purified complexes.
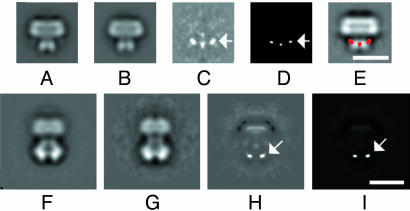
2D Difference Maps. A 2D average of 792 images of ΔC channels (Fig. 6B) was subtracted from an average of 1,200 images of WT channels (Fig. 6A) to identify the location of the C terminus. Strong difference peaks are visible in the cytoplasmic domain (arrows in Fig. 6 C–E), in agreement with the 3D difference map (Fig. 3E).
Fig. 6.
Difference maps of 2D averages of Shaker Kvα and α–β complexes. (A) WT Shaker Kvα. (B) ΔC Shaker Kvα. (C) Difference map between the 2D averages of WT and ΔC Shaker. (D) Statistically significant regions of the previous difference map at the 98% confidence level (40). (E) The difference map between WT and ΔC Shaker (in red) superimposed onto the 2D average of the WT channel. (F)WT Shaker α–β complex. (G) ΔC Shaker α–β complex. (H) Difference map between α–β complexes, containing WT and ΔC Shaker. (I) Statistically significant regions of the previous difference map at the 98% confidence level. The arrows indicate the location of peaks in the difference maps. (Bar = 10 nm.)
The same procedure was used to calculate a 2D difference map between Shaker α–β complexes, containing WT (1,789 images) and ΔC (980 images) channels (Fig. 6 F and G). Because of heterogeneity in the particle population, we collected only the views of heterooctameric (α)4–(β)4 complexes, virtually identical to those from mammalian brain (20), that clearly showed both subunits. The main difference densities were observed below the T1 domain (arrows in Fig. 6H and I; Fig. 7B) within the projection of the β2-subunit. Other features in the difference map in Fig. 6H were weaker and appear closer to the edge of the particle, possibly indicating small differences in the stain distribution in the samples. The locations of the main peaks are clearly different from those in the unbound channel, suggesting that there is a conformational change in the Shaker C terminus on binding of β2.
Discussion
A number of crystal structures of various membrane proteins, mostly of bacterial origin, have been solved in recent years (for reviews, see refs. 41 and 42). The more complex eukaryotic membrane proteins, however, such as the Shaker Kv channel, have eluded crystallization. The main available source of structural information has, therefore, been EM. In this study, we used EM and single-particle analysis to determine the structure of the C terminus of the Shaker K+ channel in its unbound state and in its complex with the rat Kvβ2-subunit.
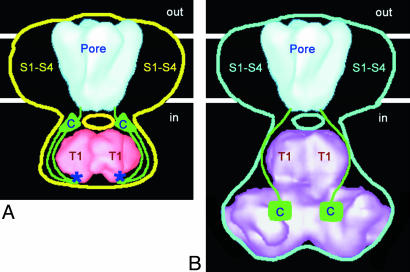
Toxin binding shows that the deletion of the 152 C-terminal residues in Shaker channel yields a correctly folded channel protein (Table 1). Removal of the C terminus also does not disrupt the association of the rat Kvβ2-subunit to the truncated Shaker (Fig. 1B). In our recent study of the Shaker structure (17), we found that the crystal structure of the T1 domain (43) could not account for the entire volume of the cytoplasmic domain. The 3D difference map between WT Shaker and its ΔC mutant clearly identifies a compact density (Fig. 3E) for the C terminus that partially coincides with the density of the cytoplasmic domain not occupied by the T1 crystal structure. Due to the uncertainty in the mass corresponding to the difference density (see Results), it is unclear whether this density corresponds to the entire C terminus or just part of it. Based on the difference map, we were able to outline the conformation for the C terminus in the WT Shaker channel. The C termini are schematically depicted in Fig. 8A, together with the WT Shaker structure. There are several anchor points that could be used to locate the path of the C terminus within the WT Shaker structure: residue Phe-481 at the C-terminal side of the S6 transmembrane segment where the C terminus begins, the linker region connecting the membrane-embedded and the cytoplasmic domains, and residue Cys-505, which can form a disulfide bridge with Cys-96 in the T1 domain (44). We propose that the C terminus (green string) meanders into the cytoplasm directly below the membrane-embedded S6 segment, forming part of the linker between the two domains. Thus, the linker consist of two strands: the C-terminal part of the N terminus, which connects the T1 domain with the first transmembrane segment (S1), and the N-terminal part of the C terminus, which connects the last transmembrane segment (S6) with the rest of the C terminus. Interestingly, there are four negatively charged amino acids, Glu-488, Asp-490, Glu-492, and Glu-493, that are separated from the end of the S6 segment by only seven residues, placing them approximately in the linker region. Therefore, the four negatively charged amino acids may complement other negatively charged residues in the linker between the T1 domain and S1 segment in promoting the passage of positive ions and the inactivation of the channel by the positively charged inactivation peptide (9). Following the linker, the C terminus extends down, around the T1 domain, to reach Cys-96 (blue asterisks in Fig. 8A). There are 25 amino acids between Phe-481and Cys-505 that could span a length of ≈8.5 nm in an extended conformation, sufficient to traverse the distance of ≈6 nm between the membrane domain and the bottom of the cytoplasmic domain. Passing the Cys-505 crosslinking point, the C terminus follows along the surface of the T1 domain and proceeds back toward the membrane domain, where it forms a compact density on the side of the cytoplasmic domain facing the membrane. Contacts between the T1 domain and the C termini had previously been proposed (45), in agreement with our present data. The compact density, which gives rise to the observed peaks in the difference map in Fig. 6C when the C terminus is deleted, is indicated by green triangles in Fig. 8A. The precise structure of the C terminus forming this compact density cannot be visualized at the current resolution of our data.
Fig. 8.
Cartoon showing the proposed conformational rearrangements of the Shaker C terminus on binding of Kvβ. (A) WT Shaker structure (yellow outline) with the known crystal structures of KcsA (46) in blue and T1 domain (43) in red, placed into their previously proposed positions (the crystal structures were filtered at low resolution to compare with the EM structure). The C termini (green) occupy the extra space on the sides of the T1 domain. Two positions of Cys-96 are labeled with blue asterisks. Although the path of each C terminus shown here suggests that it doubles back on itself, it is equally possible that its path toward residue Cys-96 is different from that leading away from Cys-96. (B) WT Shaker α–β complex (blue outline) with low resolution structures of KcsA in blue and T1–β2 complex (9) in purple.
We used single-particle analysis to calculate also a 3D reconstruction of the Shaker α–β complex (data not shown). Because of heterogeneity of the particle population in the images (Fig. 4), and the substoichiometric presence of Kvβ in the complexes (Fig. 1), we limited our analysis to particles that clearly showed both Kvα and Kvβ (Fig. 5C). The uneven sampling of the 3D volume due to the limited number of views produced a 3D structure that suffered from artifacts. Therefore, instead of a 3D structure, we used 2D averages to calculate a difference map between α–β complexes containing WT and ΔC Shaker (Fig. 6). The main differences appear in the cytoplasmic part of the α–β complex (Fig. 6H). Other features in the difference map are weaker and appear closer to the edge of the particle, possibly indicating small differences in the stain distribution in the samples. The main difference peaks clearly show that the conformation of the C terminus of Shaker changes on the binding of Kvβ, moving the C terminus farther away from the membrane domain, compared with its location in unbound Shaker (Fig. 6E).
This rearrangement brings a large part of the C terminus into close contact with Kvβ. In Fig. 7B, the major difference, corresponding to the C terminus location, is colored in red and superimposed on a 2D average of the WT Shaker α–β complex. The approximate distance between the respective centers of the difference densities is 5 nm. To determine the orientation of Kvβ seen in the 2D average (Fig. 7B), we produced a gallery of projections of the T1-β crystal structure (9), each filtered at a resolution of ≈20 Å and successively rotated by 9° around its fourfold symmetry axis (Fig. 7A). We calculated the correlation between each projection and the bottom part of the 2D average in Fig. 7B. The crystal structure of the T1–β complex is shown in Fig. 7C in the orientation corresponding to the projection in Fig. 7A that has the highest correlation. In Fig. 7 C–E, the red spheres mark the approximate centers of the major difference peaks, seen in projection in Fig. 7B. The marked locations result in only two difference peaks in projection that are separated by 5 nm, in agreement with the observed difference peaks in Fig. 7B. According to this model, the C terminus of Kvα is located within a crevice, close to the NADP+-binding site of Kvβ (Fig. 7 D and E).
An outline of the proposed conformation of the C terminus inside the WT Shaker α–β complex is shown in the Fig. 8B. The green squares mark the approximate positions of the C termini that form the compact densities in the difference map (Fig. 7B). The density on the sides of the T1 domain that corresponds to the C terminus in the unbound Shaker channel (Fig. 8A) is absent in the Shaker α–β complex.
The observed rearrangement of the Kvα C terminus suggests a possible mechanism for the modulation of Kv channel function by Kvβ. Some of the observable effects of Kvβ on Kv channels, such as acceleration of C-type inactivation (26) and alteration of the activation threshold of Kv1.1 and Kv1.5 channels (27), may be relayed by the C terminus. It is interesting to note the close proximity of the compact part of the C terminus to the Kvβ active site (Fig. 7D). Oxidoreductase activity of the Kvβ has not yet been established, but if such an activity is present, it may affect channel function, including induction of conformational changes in the Kvα, as discussed by McCormack et al. (47). Our present work opens up the possibility that the oxidoreductase activity of Kvβ may have an effect on Kv channel function through interaction with its C termini.
In conclusion, we present direct structural evidence that the binding of a Kvβ to a Kv channel induces a conformational change in the C terminus of the channel. The conformational rearrangement shifts the C terminus from a location near the T1 domain into crevices found inside Kvβ. This relocation could underlie one of the molecular mechanisms through which Kvβs exert their regulatory role on Kv channels.
Acknowledgments
We thank Dr. C. Miller for the generous donation of Shaker DNA and Dr. J. Trimmer for the generous gift of Kvβ2 DNA and mouse monoclonal antibodies against Kvβ2. We are thankful to Ms. L. Lynch for proofreading the manuscript. This work was supported in part by a New Investigator Award from the Medical Foundation (Boston), National Institutes of Health Grants P01 GM-62580 and R01 GM63012-01A1 (to N.G.), and the Jane Coffin Childs Memorial Fund for Medical Research fellowship (to O.S.).
Abbreviations: Kv, K+ voltage-gated; Kvα and Kvβ, Kvα and -β subunits; EM, electron microscopy; ΔC, C-terminal deletion.
References
- 1.Hoshi, T., Zagotta, W. N. & Aldrich, R. W. (1990) Science 250 533–538. [DOI] [PubMed] [Google Scholar]
- 2.Hille, B. (2001) Ion Channels in Excitable Membranes (Sinauer, Sunderland, MA), 3rd Ed.
- 3.Li, M., Jan, Y. N. & Jan, L. Y. (1992) Science 257 1225–1230. [DOI] [PubMed] [Google Scholar]
- 4.Marten, I. & Hoshi, T. (1998) Biophys. J. 74 2953–2962. [DOI] [PMC free article] [PubMed] [Google Scholar]
- 5.Cushman, S. J., Nanao, M. H., Jahng, A. W., DeRubeis, D., Choe, S. & Pfaffinger, P. J. (2000) Nat. Struct. Biol. 7 403–407. [DOI] [PubMed] [Google Scholar]
- 6.Deal, K. K., Lovinger, D. M. & Tamkun, M. M. (1994) J. Neurosci. 14 1666–1676. [DOI] [PMC free article] [PubMed] [Google Scholar]
- 7.Schulteis, C. T., Nagaya, N. & Papazian, D. M. (1998) J. Biol. Chem. 273 26210–26217. [DOI] [PubMed] [Google Scholar]
- 8.Lu, J., Robinson, J. M., Edwards, D. & Deutsch, C. (2001) Biochemistry 40 10934–10946. [DOI] [PubMed] [Google Scholar]
- 9.Gulbis, J. M., Zhou, M., Mann, S. & MacKinnon, R. (2000) Science 289 123–127. [DOI] [PubMed] [Google Scholar]
- 10.Hopkins, W. F., Demas, V. & Tempel, B. L. (1994) J. Neurosci. 14 1385–1393. [DOI] [PMC free article] [PubMed] [Google Scholar]
- 11.Jerng, H. H. & Covarrubias, M. (1997) Biophys. J. 72 163–174. [DOI] [PMC free article] [PubMed] [Google Scholar]
- 12.Kim, E. & Sheng, M. (1996) Neuropharmacology 35 993–1000. [DOI] [PubMed] [Google Scholar]
- 13.Bentley, G. N., Brooks, M. A., O'Neill, C. A. & Findlay, J. B. C. (1999) Biochim. Biophys. Acta 1418 176–184. [DOI] [PubMed] [Google Scholar]
- 14.Ju, M., Stevens, L., Leadbitter, E. & Wray, D. (2003) J. Biol. Chem. 278 12769–12778. [DOI] [PubMed] [Google Scholar]
- 15.Jiang, Y., Lee, A., Chen, J., Cadene, M., Chait, B. T. & MacKinnon, R. (2002) Nature 417 515–522. [DOI] [PubMed] [Google Scholar]
- 16.Nishida, M. & MacKinnon, R. (2002) Cell 27 957–965. [DOI] [PubMed] [Google Scholar]
- 17.Sokolova, O., Kolmakova-Partensky, L. & Grigorieff, N. (2001) Structure (Cambridge, U.K.) 9 215–220. [DOI] [PubMed] [Google Scholar]
- 18.Kobertz, W. R., Williams, C. & Miller, C. (2000) Biochemistry 39 10347–10352. [DOI] [PubMed] [Google Scholar]
- 19.Scott, V. E. S., Rettig, J., Parcej, D. N., Keen, J. N., Findlay, J. B. & Ponds, O. (1994) Proc. Natl. Acad. Sci. USA 91 1637–1641. [DOI] [PMC free article] [PubMed] [Google Scholar]
- 20.Orlova, E. V., Papakosta, M., Booy, F. P., van Heel, M. & Dolly, J. O. (2003) J. Mol. Biol. 326 1005–1012. [DOI] [PubMed] [Google Scholar]
- 21.Shi, G., Nakahira, K., Hammond, S., Rhodes, K. J., Schechter, L. E. & Trimmer, J. (1996) Neuron 16 843–852. [DOI] [PubMed] [Google Scholar]
- 22.Nikahira, K., Shi, G., Rhodes, J. & Trimmer, J. S. (1996) J. Biol. Chem. 271 7084–7089. [DOI] [PubMed] [Google Scholar]
- 23.Rhodes, K. J., Monaghan, M. M., Barrezueta, N. X., Nawoschik, S., Bekele-Arcuri, Z., Matos, M. F., Nakahira, K., Schechter, L. E. & Trimmer, J. S. (1996) J. Neurosci. 16 4846–4860. [DOI] [PMC free article] [PubMed] [Google Scholar]
- 24.Rettig, J., Heinemann, S. H., Wunder, F., Lorra, C., Parsej, D. N., Dolly, O. & Pongs, O. (1994) Nature 369 289–294. [DOI] [PubMed] [Google Scholar]
- 25.Jing, J., Peretz, T., Singer-Lahat, D., Chikvashvili, D., Thornhill, W. B. & Lotan, I. (1997) J. Biol. Chem. 272 14021–14024. [DOI] [PubMed] [Google Scholar]
- 26.McCormack, K., McCormack, T., Tanouye, M., Rudy, B. & Stuhmer, W. (1995) FEBS Lett. 370 32–36. [DOI] [PubMed] [Google Scholar]
- 27.Heinemann, S. H., Rettig, J., Graack, H.-R. & Pongs, O. (1996) J. Physiol. 493 625–633. [DOI] [PMC free article] [PubMed] [Google Scholar]
- 28.Xu, J. & Li, M. (1997) J. Biol. Chem. 272 11728–11735. [DOI] [PubMed] [Google Scholar]
- 29.Bekele-Arcuri, Z., Matos, M. F., Manganas, L., Strassle, B. W., Monoghan, M. M., Rhodes, K. J. & Trimmer, J. S. (1996) Neuropharmacology 35 851–865. [DOI] [PubMed] [Google Scholar]
- 30.Schwarz, T. L., Tempel, B. L., Papazian, D. M., Jan, Y.-N. & Jan, L.-Y. (1988) Nature 331 137–142. [DOI] [PubMed] [Google Scholar]
- 31.Goldstein, S. A. N. & Miller, C. (1992) Biophys. J. 62 5–7. [DOI] [PMC free article] [PubMed] [Google Scholar]
- 32.Oprian, D. D., Molday, R. S., Kaufman, R. J. & Khorana, H. G. (1987) Proc. Natl. Acad. Sci. USA 84 8874–8878. [DOI] [PMC free article] [PubMed] [Google Scholar]
- 33.van Heel, M., Harauz, G., Orlova, E. V., Schmidt, R. & Schatz, M. (1996) J. Struct. Biol. 116 17–24. [DOI] [PubMed] [Google Scholar]
- 34.Grigorieff, N. (1998) J. Mol. Biol. 277 1033–1046. [DOI] [PubMed] [Google Scholar]
- 35.Huang, C. C., Couch, G. S., Pettersen, E. F. & Ferrin, T. E. (1996) Pac. Symp. Biocomput. 1 724. [PubMed] [Google Scholar]
- 36.Frank, J., Radermacher, M., Penczek, P., Zhu, J., Li, Y., Ladjadj, M. & Leith, A. (1996) J. Struct. Biol. 116 190–199. [DOI] [PubMed] [Google Scholar]
- 37.Levitan, E. S. & Takimoto, K. (2000) Trends Cardiovasc. Med. 10 317–320. [DOI] [PubMed] [Google Scholar]
- 38.Yang, E.-K., Alvira, M. R., Levitan, E. S. & Takimoto, K. (2001) J. Biol. Chem. 276 4839–4844. [DOI] [PubMed] [Google Scholar]
- 39.Matthews, B. W. (1968) J. Mol. Biol. 194 277–286. [Google Scholar]
- 40.Frank, J. (1996) Three-Dimensional Electron Microscopy of Macromolecular Assemblies (Academic, New York).
- 41.Yellen, G. (2002) Nature 419 35–42. [DOI] [PubMed] [Google Scholar]
- 42.Sansom, M. S., Shrivastava, I. H., Bright, J. N., Tate, J., Capener, C. E. & Biggin, P. C. (2002) Biochim. Biophys. Acta 1565 294–307. [DOI] [PubMed] [Google Scholar]
- 43.Kreusch, A., Pfaffinger, P. J., Stevens, C. F. & Choe, S. (1998) Nature 392 945–948. [DOI] [PubMed] [Google Scholar]
- 44.Schulteis, C. T., Nagaya, N. & Papazian, D. M. (1996) Biochemistry 35 12133–12140. [DOI] [PubMed] [Google Scholar]
- 45.Minor, D. L., Jr., Lin, Y.-F., Mobley, B. C., Avelar, A., Jan, Y. N., Jan, L. Y. & Berger, J. M. (2000) Cell 102 657–670. [DOI] [PubMed] [Google Scholar]
- 46.Doyle, D. A., Morais C. J., Pfuetzner, R. A., Kuo, A., Gulbis, J. M., Cohen, S. L., Chait, B. T. & MacKinnon, R. (1998) Science 280 69–76. [DOI] [PubMed] [Google Scholar]
- 47.McCormack, K., Connor, J. X., Zhou, L., Ho, L. L., Ganetzky, B., Chiu, S. Y. & Messing, A. (2002) J. Biol. Chem. 277 13219–13228. [DOI] [PubMed] [Google Scholar]


