

Abstract
Most studies of competition in health care focus on prices and costs, but concerns about quality play a central role in policy debates. If demand is inelastic to quality, then competition may reduce patient welfare. This study uses a dataset of patient registrations for kidney transplantation in conjunction with a mixed logit model to gauge consumers’ responsiveness to quality when choosing hospitals. Results indicate that at the hospital level, a one-standard deviation increase in the graft-failure rate is associated with a 6% decline in patient registrations. Privately-insured patients are more responsive to quality than Medicare patients, suggesting that insurers consider quality when contracting with providers.
Keywords: hospitals, consumer choice, quality, health, medicine
1. Introduction
Restrictions on competition in health care markets are usually justified in terms of their ability to enhance quality and patient welfare. Faced with rising costs, however, states, courts, and the federal government have gradually repealed laws and regulations that limit providers’ exposure to competitive pressures. While reforms have led to lower prices (Cutler et al. 2000; Dranove et al. 1993), the impact of competition on quality is unclear. A necessary condition for competition to promote quality in health care is that patients (and their referring physicians and health plans) take quality into account when choosing providers (Ginsburg and Hammons 1998; Dranove and Satterthwaite 1992; Hart et al. 1997).1 If so, then providers with above-average quality will attract more patients.
Subjecting the assumption underlying pro-competitive policies in healthcare – that consumers, if given a choice and information, will gravitate towards high-quality providers – to empirical validation is important for understanding consumer behavior and assessing public policies in the area of quality improvement. This study was undertaken to examine the responsiveness of consumers’ choice of kidney transplant center to quality using a unique dataset consisting of the universe of registrants for kidney transplantation. Typically, the term “consumer” in health care is synonymous with “patient”. In this paper, the term is used as shorthand to refer to all parties involved in choosing transplant centers: patients, referring physicians, and health plans. Results from the baseline model indicate that a one standard deviation increase in graft failure rates leads to a 6% decline in consumer demand.
Studies have analyzed consumers’ responsiveness to quality in health care previously (these are reviewed below), but this is the first to examine patient choice in the field of organ transplantation. Quality is relatively easy to measure in transplantation and hospital-specific outcomes data have been reported on the Internet since late 1999, making transplantation a good case study for evaluating consumer behavior with respect to quality. While the goal of this study is to add to the literature on quality in the health system generally, transplantation is an area of particular concern to the government given its regulatory oversight of the organ allocation system and Medicare’s end-stage renal disease program, which provides insurance coverage to many patients with kidney failure.
2. Literature Review
A number of studies have measured the responsiveness of patients to quality using individual-level choice data. Typically, researchers model consumer utility from a particular provider as a linear function of provider characteristics and estimate parameters with a conditional logit model. In one of the earliest studies using this approach, Luft et al. (1990) examined the impact of direct measures of quality, including death and complication rates, and indirect measures of quality, including teaching status and percent of out-of-state admissions, on patients’ choice of hospital in California for seven categories of admissions. For all categories examined, indirect measures of quality increased the likelihood of being chosen, but the direct measures of quality were significant only for five of seven admission categories. Quality choiceelasticities were fairly small for most procedures. However, the measures of direct quality – in-hospital mortality and complications rates – may be weak signals of actual quality since hospitals that discharge patients early will tend to have lower in-hospital adverse event rates.
Since Luft et al., a number of studies have applied similar methods to different patient populations and quality measures (Burns and Wholey 1992; Adams et al.1991; Capps et al. 2001; Chirikos 1992; Dranove and White 1993; Brounstein and Morrisey 1991; Phibbs et al. 1993; Hodgkin 1996; Tay 2002). Overall, these studies find that patients are more likely to choose providers with higher quality levels, all else being equal. In most of the cases considered, hospital quality measures were not publicly reported, suggesting that at least some patients are well-informed even in the absence of “report card” programs. Unfortunately, these studies do not answer the question “How responsive to quality must consumer choice be in order to guarantee that competition produces socially desirable outcomes?” The magnitude of the effect remains in the eye of the beholder.
3. Background on Kidney Transplantation
In 2001, 26,882 kidney transplants were performed at over 230 hospitals. About one half of transplant recipients receive a kidney from a living donor, usually a friend or family member. Candidates who cannot obtain a living donor kidney are placed on the waiting list for deceased donor kidneys. The waiting list is national in scope, though patients in the region in which an organ was recovered are given preference over others. Over 22,000 patients are placed on the waiting list annually, and at the end of 2001, there were 51,144 patients waiting for a donor. Most major cities now have at least two kidney transplant centers and, though the majority of procedures continue to be performed at large academic medical centers, kidney transplantation is increasingly viewed as a “routine” medical procedure on par with other major surgeries.
End stage renal disease patients deemed suitable candidates for transplantation typically choose transplant centers shortly after diagnosis in consultation with their nephrologist. Undoubtedly, nephrologists’ recommendations holds sway for many patients, but nephrologists do not exert formal authority over patients’ choices, and patients are free to disregard their advice. From a patient’s perspective, transplant centers are differentiated primarily by travel time and quality. Quality measures, in the form of actual and expected center-specific patient and graft survival rates, are available on the Internet and updated every six months (see http://www.ustransplant.org). Almost all transplant operations are covered by insurance, and patients’ copayments do not vary as long as they choose an in-network hospital. Candidates for cadaveric transplants who live near regional boundaries may consider expected waiting times when choosing a transplant center, but most face little variation between nearby centers. About 5% of patients register at more than one transplant center –usually one local center and one out-of-region center – to increase their chances of obtaining a kidney. After the first registration, patients must pay registration fees out-of-pocket, and so only upper income patients may avail themselves of this strategy.
Patients’ choices are constrained by their insurers. Medicare covers transplantation at any center meeting a fairly minimal set of criteria in terms of staffing and procedure volume, but state-run Medicaid programs cover kidney transplantation at in-state facilities only. Private insurers bargain aggressively with transplant programs, and most restrict coverage to a few centers in each geographic area under the guise of “centers of excellence” programs. Insurers maintain that the purpose of these programs is to direct patients to hospitals with superior outcomes, but critics charge that obtaining price discounts, not improving quality, is the primary objective of exclusive networks in transplantation (Burns et al. 2000). These competing claims are assessed empirically by examining whether privately insured patients, whose choices are constrained, are more or less likely to register at centers with good outcomes than Medicare patients, whose choices are unrestricted
The rules governing insurance coverage for patients with kidney failure are complicated. All patients over the age of 65 are covered by Medicare. Very few are in Medicare managed plans.2 For patients under age 65, coverage depends on how long they have been diagnosed with kidney failure.3 Hospitals generally refuse to transplant uninsured patients out of concern that they will be unable to afford the post-transplant immunosuppressive medications necessary to maintain graft function.
4. Data and Methods
4.1 Data
The main study sample consists of adults registering on the kidney waiting list between January 1, 2000 and October 31, 2002. The Scientific Registry of Transplant Recipients compiled the data from forms transplant centers are required to file with the Organ Procurement and Transplantation Network (OPTN). Because registration is mandatory, the database includes the universe of candidates for deceased donor transplants in the United States. The database also includes about 30% of living-donor transplant recipients, who are not required to register with the OPTN but may elect to do so pre-transplant.
The following groups of patients were excluded: patients residing outside the continental United States, candidates for multi-organ transplants (who must choose from the subset of hospitals that perform liver, lung, pancreas, or intestine transplants), patients who have been transplanted previously (the vast majority of whom register at the institution where they received the first procedure), and patients registering at transplant centers that were not in operation long enough to be included in the most recent center-specific survival report
I constructed choice sets – the subset of hospitals that patients plausibly consider when choosing a transplant center – based on historical registration patterns and distance. The case of organ transplantation presents special challenges for constructing choice sets. While many patients have access at local facilities, patients living in cities without transplant centers and rural areas may travel a considerable distance. Thus, defining choice sets based on city or distance alone will unreasonably exclude large numbers of patients and hospitals. Because results may be sensitive to the construction of choice sets, three distinct patient-center datasets were developed, each using different criteria to define choice sets. I estimated models separately on each dataset. Baseline results are based on Dataset A.
Dataset A
Transplant center j was included in patient i’s choice set if either
at least 5% of the registrants from i’s metropolitan statistical area4 (MSA) chose j in the two year window before i’s registration year,
at least 25 patients in i’s MSA chose j in the two year window, or
j is within 200 miles from i’s home and either (a) j is the closest center to i or (b) j is within 50 miles of any of the centers closer to i.5
If more than 10 centers metat least one of these criteria, centes were ranked by market share (descending) and then by distance (ascending) and only the top 10 were retained.
The first and second criteria incorporate actual choice patterns into the formation of choice sets. The third criterion includes newer centers (which may have had few or no registrations in previous years) in the choice sets of nearby patients. Sensitivity analyses were performed using datasets B and C.
Dataset B
Same as A, but the top 20 centers were retained after sorting by market share and distance (instead of only the top 10).
Dataset C
Same as A, but all centers within a 200 mile radius were included, subject to the 10 center choice set maximum.
I excluded from the analysis patients who registered at hospitals not included in their choice sets (for example, a patient living in Maine who registered at a center in San Diego) and patients with only one center in their choice set. Table 1 shows the number of consumers excluded and other dataset characteristics.
Table 1.
Dataset characteristics
| Dataset
|
|||
|---|---|---|---|
| A | B | C | |
| Number of consumers excluded | |||
| Only one center in choice set | 3,284 | 3,284 | 429 |
| Chosen center not in choice set | 1,359 | 1,302 | 1,009 |
| Sample size | |||
| Consumers | 36,991 | 37,048 | 40,196 |
| Consumer-center pairs | 203,448 | 224,831 | 346,014 |
| Choice set characteristics | |||
| Average number of centers | 5.5 | 6.1 | 8.6 |
| Proportion with ≥10 centers | 0.15 | 0.16 | 0.57 |
4. 2 Variable Construction
Patients, physicians, and health plans consider many different factors when choosing transplant centers. For purposes of estimating statistical choice models, it is necessary to limit the analysis to those that can be observed and measured unidimensionally. In the baseline analysis, I characterized transplant centers by twoattributes: quality (i.e. patient outcomes) and travel distance. Additional characteristics, such as bed size, were included in sensitivity analyses, described in Section 5.2.
Graft failure rates and expected graft failure rates were obtained from center-specific survival reports, provided in electronic format to the author by the Scientific Registry of Transplant Recipients. The Scientific Registry of Transplant Recipients calculates expected graft failure rates for each center after adjusting for a rich set of patient controls (including age, primary diagnosis, physiological measures of pre-transplant kidney function, and characteristics of the kidney donor) using models that were developed with extensive input from transplant physicians and biostatisticians.6
In the baseline model, quality is the difference between each center’s expected and actual graft failure rates at one-year post-transplant, 7,8 as reported in the July 2003 center-specific outcomes report. This report reflects transplant operations performed during the time period in which patients in the sample were choosing hospitals. Taking the difference between expected and actual graft failure rates effectively “risk adjusts” centers’ outcomes for underlying differences in patients’ characteristics. A patient is counted towards a center’s graft failure rate if they die, regardless of the cause of death, or their body rejects the donor organ and they are placed on dialysis or receive a second transplant.9
Table 2 presents summary statistics for various outcome measures contained in the July 2003 report. The average graft failure rate at one-year post-transplant for transplants performed between January 1, 2000 and June 31, 2002 is 0.10 (10%). Not surprisingly, the mean difference between the expected graft failure rate and the actual graft failure rate is zero. The average number of transplants performed over the 30-month observation period is 155, with a range of 7 to 932.
Table 2.
Summary of transplant center outcome measures, July 2003 report
| Mean | SD | Min | Max | |
|---|---|---|---|---|
| Actual one-year graft failure rate | 0.10 | 0.05 | 0.00 | 0.50 |
| Expected one-year graft failure rate | 0.09 | 0.01 | 0.05 | 0.13 |
| Quality (Expected rate minus actual rate) | −0.01 | 0.05 | −0.37 | 0.08 |
| Number of transplants 1/1/00–6/1/2002 | 155 | 133 | 7 | 932 |
| N | 207 |
In the baseline model, travel distance from patient i to hospital j is measured by the natural log of the great circle distance in miles from the center of patient i’s home zip code to the center of hospital j’s zip code. Straight-line distance is highly correlated with actual travel times (Phibbs and Luft 1995). Using logged miles, as in Luft et al., places a reasonable restriction on the relationship between distance and utility assuming that a patient gives less weight to the difference in distance between hospitals located at, say, 105 and 110 miles from his home than the difference between hospitals located at 5 and 10 miles.
Table 3 displays summary statistics for the transplant center attributes. The first panel displays statistics for individuals’ chosen centers, the second displays statistics for the entire dataset, which includes all centers in patients’ choice sets.
Table 3.
Summary of transplant center attributes facing January 2000-October 2002 registrants
| Variable | Mean | SD | Min | Max |
|---|---|---|---|---|
| Individual level, actual choices | ||||
| Quality, July 2003 report | 0.00 | 0.03 | −0.37 | 0.08 |
| Distance in miles | 43 | 61 | 0 | 2,138 |
| N | 36,991 | |||
| Entire data set | ||||
| Quality, July 2003 report | 0.00 | 0.05 | −0.37 | 0.08 |
| Distance in miles | 44 | 51 | 0 | 2,138 |
| N | 203,448 | |||
Identification of the statistical model, described below, is achieved by the variation in hospital attributes within choice sets. The mean and the 25th and 75th percentiles of the within-choice set standard deviation of quality are 0.038, 0.021, and 0.046, respectively. The equivalent figures for distance are 20, 6, and 23 miles. Collectively, these figures imply that there is meaningful within-choice set variation in quality and distance.
I interacted each transplant center attribute with the following patient characteristics: age, sex, race/ethnicity (white versus non-white), cause of renal failure (diabetes versus other), current treatment (dialysis versus none), education (college degree versus none), employment status (working versus not working), and insurance type (private10 versus Medicaid versus other). Including two transplant center attributes as levels and interactions with nine patient characteristics generates a model with 20 (= 2 × [1 + 9]) variables.
Patient characteristics are summarized in Table 4. Whites comprise 49% of the sample. Only 14% of patients have a college degree, compared to 26% of the general adult population (U.S. Census Bureau 2001). Medicaid is the source of insurance for 7% of registrants, and 47% have private insurance. Most of the remaining 46% are insured by the Medicare program.
Table 4.
Summary of patient characteristics
| Age | 50 |
| Male | 59% |
| White | 49% |
| Diabetic | 39% |
| On dialysis | 81% |
| College degree | 14% |
| Working | 35% |
| Insurance | |
| Medicaid | 7% |
| Private insurance | 47% |
| Medicare/Other | 46% |
| N | 36,991 |
4.3 Statistical Model
I modeled transplant center choice using a mixed logit model with an error-components specification. Mixed logit models relax the independence of irrelevant alternatives axiom (I.I.A.) by incorporating random terms, interacted with some or all product attributes, into the utility function, thereby allowing for correlation in the error terms across alternatives (McFadden and Train 2000). Note that by fully interacting center attributes with patient characteristics, the model permits additional flexibility in substitution patterns across observable patient types.
Let zij be a vector of transplant center characteristics for center j from the perspective of patient i and wi be a vector consisting of patient characteristics and a constant term. The vector of fully interacted center and patient attributes is xij = (zij ⊗ wi). Under the mixed logit model (with error components), the utility that patient i receives from transplant center j is:
| [1] |
where the β’s and σk’s are parameters, the μk’s are random terms with zero mean, and the ’s are a subset of the terms in xij. To estimate the parameters, it is necessary to assume a distributional form for the μk‘s. A model with μ,k = 0 for all k would reduce to the standard conditional logit model. In this application, the μk‘s are restricted to follow triangle distributions.11 In this case, parameters σ describe the spread of the distributions, so that μk follows a triangle distribution on the interval [−σk, σk].
I estimated parameters β and σ via maximum likelihood. Assuming that εij follows a type I extreme value distribution, the probability that patient i chooses hospital j, Pij, is:
| [2] |
Monte Carlo integration is used to approximate the choice probabilities:
| [3] |
where r indexes Halton draws (Train 2003) from mean-zero triangle distributions (as in Train 2002) and R is the total number of draws. Letting yij = 1 if patient i chose center j and zero otherwise, the simulated Ig- likelihood is:
| [4] |
I computed standard errors using the Berndt-Hall-Hall-Hausman method.
I placed error components on the coefficients of log distance and the interactions of log distance with employment status, Medicaid insurance, and private insurance. These variables were chosen based on prior beliefs that the influence of these characteristics on choice behavior varies in the population. Patients’ ability to travel to transplant centers outside their local area varies due to differences in health status and wealth. Some but not all employed patients face vacation and sick leave policies that restrict their ability to take time off for travel to centers outside their local area. Medicaid programs generally restrict reimbursement to in-state providers; the distance between patients’ homes and instate providers will be much larger for patients who live in large states like Texas compared to patients who live in smaller states like Delaware. The exclusivity of private insurers’ provider networks varies; those with more exclusive networks will require some patients to travel outside their local areas for transplant. I did not place error components on the quality variable and its interactions; doing so greatly complicates the computation of the choice-quality elasticities. For this application, R was set equal to 100.
5. The Impact of Quality on Choice
5.1 Baseline Results
Results from the baseline mixed logit model, with the quality measure based on the July 2003 center-specific survival report, are displayed in Table 5. A log-likelihood test rejects at the 1% level the null hypothesis that the coefficients on the error components are equal to zero. Put another way, the standard conditional logit model imposes overly restrictive assumptions on choice behavior. Intuitively, it is difficult to see why this is the case. It would seem as if the large, mostly academic hospitals that perform transplants are fairly good substitutes for one another, and that the violations of I.I.A. that might arise in a choice set consisting of, say, a Mercedes, BMW, and Ford, do not apply. Consistent with this notion, elasticity estimates from a standard conditional logit model (not shown) turn out to be fairly close to those from the mixed logit model.
Table 5.
Baseline model estimates
| Center attributes
|
||||
|---|---|---|---|---|
| Variable | Quality | Log distance | ||
| Mean parameters | ||||
| Level | 2.064 * | (0.991) | −1.754* | (0.105) |
| ×Age | −0.026 | (0.016) | −0.002 | (0.002) |
| ×Male | 0.092 | (0.383) | 0.025 | (0.039) |
| ×White | 1.464 * | (0.399) | 0.280 * | (0.040) |
| ×Diabetic | −0.241 | (0.403) | −0.021 | (0.041) |
| ×On dialysis | −0.702 | (0.546) | −0.054 | (0.052) |
| ×College degree | 2.275 * | (0.585) | −0.016 | (0.055) |
| ×Working | −0.504 | (0.448) | −0.274 * | (0.063) |
| ×Insurance=Medicaida | −2.883 * | (0.733) | −0.329 * | (0.083) |
| ×Insurance=Privatea | 2.821 * | (0.434) | 0.310* | (0.044) |
| Error components | ||||
| Level | −3.906 * | (0.110) | ||
| ×Working | −2.365 * | (0.390) | ||
| ×Insurance=Medicaida | 0.160 | (2.100) | ||
| ×Insurance=Privatea | −0.162 | (1.029) | ||
| Log-likelihood | 51,858 | |||
| Psuedo R2 | 0.21 | |||
P < 0.05
Medicare and other insurance are omitted.
Standard errors are in parentheses.
Higher values of the quality variable indicate better patient outcomes, so a positive value on a quality coefficient indicates that patients in the group seek out high quality transplant centers. Particular groups of patients - whites, college-educated individuals, and persons with private insurance - are more likely to register at high-quality transplant centers. As a group, the coefficients on the quality measure and its interactions are jointly significant at the 1% level.
The coefficient on log distance is negative, as expected. Coefficients on interaction terms must be interpreted cautiously because the coefficients and the marginal effects on choice probabilities can differ in sign (Ai and Norton 2003). Consistent with Medicaid policies that limit coverage to in-state facilities, the coefficient on the interaction of log distance is also negative, indicating that Medicaid patients are more likely to register at centers closer to home.12 The coefficient on the interaction of log distance with employment status is also negative, suggesting that employed patients are less likely to register at distant centers. This result may reflect the inability of employed patients to take time off from work for travel.
The individual coefficient estimates on the quality variable and its interactions are revealing, but are not particularly helpful for gauging the incentives facing providers with respect to quality. The elasticities of choice probabilities with respect to graft failure rates, which aggregate the information contained in the coefficient estimates, are more informative in this respect. Letting α equal the first nine elements of β (the coefficients on quality and its interactions) and represent the actual graft failure rate, the simulated elasticity for individual i and choice j with respect to the actual graft failure rate for j is:
| [5] |
The simulated sample elasticity is a weighted average of the individual-transplant center elasticities,
| [6] |
where N is the number of choice-level observations in the dataset. Note that quality is defined as the difference between expected and actual graft failure rates, but the elasticity is calculated with respect to the actual graft failure rate only. The reason is that an elasticity calculated with respect to the difference would have little meaning because the difference can take on both positive and negative values (elasticity refers to percent change, which could correspond to an increase or decrease in the difference).
The sample average elasticity estimate [6] is −0.12. The standard error, computed via the delta method, is 0.02. The interpretation of the elasticity is that a 10% increase in a center’s actual graft failure rate would lead to a 1.2% decline in registrations. To put this result in perspective, a center that experienced an increase in its actual one-year graft failure rate of one standard deviation (0.05) from the sample average (0.10, a 50% increase) could expect a 6% decline = (50% × −0.12) in patient registrations.
Figure 1 displays a histogram of the individual level elasticity estimates ( ). These values are negative for 29,385 consumers and positive for 7,606 consumers. However, just looking at the sign of the elasticities is misleading, since there is obviously a mass of consumers at zero, some with elasticities just above zero and others with elasticities slightly below. These consumers are basically unresponsive to quality. Only 4% of the sample has elasticities that are greater than 0.10, but 52% have elasticities below −0.10 (i.e. in the “correct” direction).
Figure 1.
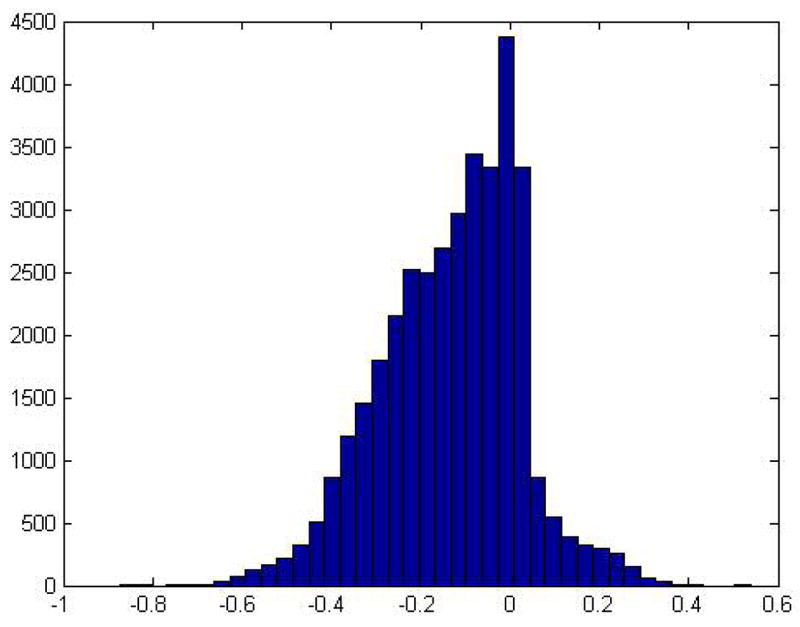
Histogram of the elasticity estimate from the baseline model (N = 36,991)
5.2 Sensitivity Analyses
Results from sensitivity analyses based on different specifications (Models 1–8) and choice set definitions (Datasets A–C) are displayed in Table 6. Dataset A/Model 1 is the baseline analysis, described above.
Table 6.
Quality-choice elasticity estimates
| Dataset
|
||||
|---|---|---|---|---|
| Model | Center attributes | A | B | C |
| 1 | Quality, log miles | −0.12 | −0.12 | −0.12 |
| 2 | Quality, log miles, lagged market share | −0.10 | −0.10 | −0.09 |
| 3 | Quality, log miles, transplant volume | −0.14 | −0.14 | −0.14 |
| 4 | Quality, log miles, staff/bed ratio | −0.12 | −0.12 | −0.12 |
| 5 | Quality, log miles, bed size | −0.12 | −0.11 | −0.12 |
| 6 | Quality, miles | −0.11 | −0.13 | −0.14 |
| 7 | Quality z-score, log miles | −0.12 | −0.12 | −0.14 |
| 8 | Latest reported quality, log miles | −0.09 | −0.09 | −0.90 |
Quality: expected - actual graft failure rate, from the July 2003 report.
Quality z-score: quality weighted by the inverse of its standard error.
Latest reported quality: quality is from the latest report available at registration.
Models 2–5 add an additional transplant center attribute to the model. Like quality and distance, each is fully interacted with patient characteristics and, like distance, error components are placed on the level coefficients and selected interactions. Model 2 includes lagged market share13 as a transplant center attribute. This variable serves as a proxy for the referral relationships between nephrologists, who care for renal failure patients in the community, and transplant centers. Model 3 includes transplant center volume, which controls for the potentially endogenous volume-outcome relationship.14 Model 4 includes total hospital beds, and Model 5 includes the ratio of hospital staff to beds, another possible measure of quality.
Model 6 enters miles into the model linearly instead of log miles. Model 7 weights the quality measure by the inverse of its standard error (which is based on the Scientific Registry of Transplant Recipient’s model of the expected graft survival rate), thereby converting the quality measure into a z-score.
The quality variable in Models 1–7 is based on outcomes for transplants occurring during the period in which patients registered. Since outcomes data for this period were not publicly available at the time of registration and in some cases failure events had yet to occur (recall that the outcome is graft failure at one-year post transplant), this specification assumes that patients, physicians, and payers are very well informed. Model 8 uses as a quality measure the difference between adjusted and actual graft failure rates based on the latest center-specific outcome report available at the time of registration (reports were released annually up to September 2000 and biannually thereafter). For example, the outcome variables for patients registering in February 2002 are based on the outcome report released in January of 2002, and the outcome variables for patients registering in October 2002 are based on the July 2002 outcome report.
Overall, the elasticity estimate is remarkably stable across models and datasets. Elasticities range from −0.09 (Model 8) to −0.14 (Model 3). Use of larger choice sets (Dataset B) or a more relaxed criterion for including transplant centers in choice sets based on distance (Dataset C) does not alter estimates appreciably.
5.3 Insurance Type and Quality
One result that came through very strongly in all of the models was that the interaction of quality with private insurance was positive and significant, implying that privately insured patients are less likely to register at poor quality hospitals. Based on parameter estimates from Model 1, the sample elasticity if all patients in the sample were privately insured would be −0.22. This finding is consistent with the claims of private insurers that their “centers of excellence” programs steer patients to high-quality centers (as discussed in Section 3). However, it may also reflect favorable selection into private plans, or, as one referee suggested, it may even arise if insurers contract only on price under certain assumptions about the declining marginal disutility of travel. Further exploration of this result is left for future research.
6. Conclusion
This study adds to a growing body of research showing that consumers take quality into account when choosing hospitals. Results indicate that a one standard deviation increase in one-year graft failure rates is associated with a 6% decline in patient registrations. Consistent with the findings of Escarce et al. (1999) and Chernew et al. (1998), I find that privately insured patients are particularly responsive to quality.
How generalizable are these results? Transplantation is undoubtedly a special case, but so are other procedure types (for example, cardiac surgery) that have been the subject of previous choice studies. There are reasons to expect that transplant patients are more responsive to quality than candidates for other types of surgeries. For example, the consequence of poor quality in transplantation is often death, and the cohesiveness of the end stage renal disease community may facilitate the diffusion of quality information through informal channels. There are also reasons to expect that transplant patients are less responsive to quality; namely, many are very sick and poorly educated.
The implication of this study for transplant policy is that because at least some consumers are responsive to differences in graft failure rates, increased competition will not automatically lead to decreased quality. Whether consumers’ choices are sufficiently responsive to quality so that increased competition actually improves quality is an open question. Competition may decrease centers’ incentives to increase organ donation, since the gains must be shared with competitors. In the case of heart transplantation, Scanlon et al. (2004) find that competition leads centers to misreport patients’ health status to increase their allotment of organs. Along the same lines, if outcomes are publicly reported and risk-adjustment is imperfect, aggressive quality competition may lead centers to turn away high risk patients to improve quality (Dranove et al. 2003). Evaluations of the impact of competition in transplantation must go beyond the standard economic framework to consider these types of issues.
Footnotes
The data reported here have been supplied by the University Renal Research and Education Association as the contractor for the Scientific Registry of Transplant Recipients (SRTR). The interpretation and reporting of these data are the responsibility of the author and in no way should be seen as an official policy of or interpretation by the SRTR or the U.S. Government. Grant support provided by NIDDK/NIH DK067611-01. I would like to thank Adam Atherly and seminar participants at the University of Florida and the 2004 Annual Health Economics Conference for helpful comments on an earlier draft.
This is not a sufficient condition, however, in cases where sicker, high-cost patients are differentially attracted to high-quality providers (Frank et al. 2000).
Medicare beneficiaries with end-stage renal disease cannot enroll in a Medicare managed care plan unless they were a member of the plan prior to becoming Medicare-eligible.
Immediately following diagnosis, coverage remains unchanged for patients who had insurance prior to diagnosis. At three months post-diagnosis, Medicare becomes the “secondary payer”, covering the portion of bills that are not paid by the patient’s primary insurer. At 30 months post-diagnosis, Medicare assumes “primary payer” status. If patients undergo kidney transplantation within three months following diagnosis, the three month waiting period no longer applies, and Medicare becomes the secondary payer (for patients with private insurance or Medicaid) or the primary payer (for uninsured patients). The primary payer’s policies determine patients’ access to transplant centers.
Patients living outside of MSAs were assigned to MSAs based on the first three digits of their zip code or, for patients whose first three zip code digits do not correspond to the first three digits of a zip code located in an MSA, distance.
This requirement incorporates the concept of “differential distance”. Suppose there are transplant centers located at 5, 10, 20, and 170 miles from a patient’s home. Only the closest three will be included in the choice set, since the differential distance to the fourth, 150, is greater than 50 miles.
Note that the difference between expected and actual rates as provided to the author is not the only possible measure of transplant center quality or even the best measure (there are many references on the subject of how to measure provider quality; for example, see Normand et al. 1997). However, it is the standard in the transplant field.
Center-specific survival reports include three-year graft survival rates and, ideally, the choice model would include both three- and one-year graft survival rates as quality indicators. However, one- and three-year rates are highly collinear and three-year graft survival rates are unavailable for transplant centers that have been in operation for less than three years. Also, three-year graft failure rates are influenced by many factors outside centers’ control (for example, patient compliance with immunosuppressive medications).
Previously, Luft et al. and others have measured quality by constructing a z-score, which incorporates both the differences between actual and expected mortality rates as well as the number of procedures performed by each center. The raw difference between the expected and actual rates is used in the baseline model for ease of interpretation and computation. The z-score and raw difference are highly correlated (ρ = 0.83).
Another measure of quality is the patient mortality rate, but in practice, graft failure rates and patient mortality rates are highly correlated.
The data include variables indicating if privately-insured patients were in fee-for-service or managed care plans. When I run the model with separate indicators for each plan type, the coefficients on the quality-plan type interactions are similar. I do not report these results because: 1) data are recorded by transplant center personnel, who probably do not make the effort to determine plans’ types accurately, and 2) use of selective contracting in transplantation is widespread, even among traditionally “fee-for service” plans (for example, see: http://www.bcbs.com/transplant). Thus, the distinction between fee-for-service and managed care in transplantation is somewhat meaningless.
The use of mean-zero triangle distributions for the error components allows some choosers to have positive valuations of the attribute in question while others have negative valuations. Train (2003) suggests that in situations where there is a strong prior belief about tastes (for example, all choosers dislike distant transplant centers) investigators use distributions with strictly positive support. Were the purpose of this paper to estimate the distribution of tastes in the population, it would have made sense to explore alterative distributional specifications. However, since a mixed logit model was used simply to permit flexible substitution patterns, triangle distributions were chosen for computational simplicity.
To examine the impact of Medicaid coverage policies, I also estimated a model where one of the variables was the interaction of distance, Medicaid insurance, and an indicator equal to one if the transplant hospital was in the patient’s home state. The coefficient was positive and significantly different from zero at the 1% level, as expected. The resulting elasticity was −0.11.
Formally, the lagged market share variable for patient i and hospital j equals the proportion of patients from patient i’s MSA registering at hospital j in the past two years.
The relationship between quality and volume at the transplant center level (N = 207) in the sample is significant at the 10% level.
References
- Adams E Kathleen, Houchens Robert, Wright George E, Robbins James. Predicting Hospital Choice for Rural Medicare Beneficiaries: the Role of Severity ofl llness. Health Services Research. 1991;26(5):583–612. [PMC free article] [PubMed] [Google Scholar]
- Ai Chunrong, Norton Edward C. Interaction Terms in Logit and Probit Models. Economics Letters. 2003;80(1):123–129. [Google Scholar]
- Bronstein Janet M, Morrisey Michael A. Bypassing Rural Hospitals for Obstetrics Care. Journal of Health Politics, Policy and Law. 1991;16(1):87–118. doi: 10.1215/03616878-16-1-87. [DOI] [PubMed] [Google Scholar]
- Burns JM, Miller J, Miller L. Centers of Excellence or Centers of Discount? Business & Health. 2000;18(9):37–38. [PubMed] [Google Scholar]
- Burns Lawton R, Wholey Douglas R. The Impact of Physician Characteristics in Conditional Choice Models for Hospital Care. Journal of Health Economics. 1992;11:43–62. doi: 10.1016/0167-6296(92)90024-u. [DOI] [PubMed] [Google Scholar]
- Capps Cory, Dranove David, Greenstein Shane, Satterthwaite Mark. The Silent Majority Fallacy of the Elzinga-Hogarty Criteria: a Critique and New Approach to Analyzing Hospital Mergers. National Bureau of Economic Research Working Paper 8216. 2001 [Google Scholar]
- Chernew Michael, Scanlon Dennis, Hayward Rod. Insurance Typeand Choice of Hospital for Coronary Artery Bypass Graft Surgery. Health Services Research. 1998;33(3 Pt 1):447–466. [PMC free article] [PubMed] [Google Scholar]
- Chirikos Thomas N. Quality Competition in Local Hospital Markets: Some Econometric Evidence from the Period 1982–1988. Social Science & Medicine. 1992;34(9):1011–1021. doi: 10.1016/0277-9536(92)90132-a. [DOI] [PubMed] [Google Scholar]
- Cutler David, McClellan Mark, Newhouse Joseph P. How Does Managed Care Do It? Rand Journal of Economics. 2000;31(3):526–548. [PubMed] [Google Scholar]
- Dranove David, Satterthwaite Mark. Monopolistic Competition When Price and Quality Are Not Perfectly Observable. Rand Journal of Economics. 1992;23:518–534. [Google Scholar]
- Dranove David, Stanley Mark, White William D. Price and Competition in Local Hospital Markets: The Switch from Patient-Driven to Payer-Driven Competition. Journal of Law and Economics. 1993;36:405–415. [Google Scholar]
- Dranove David, White William D, Wu Lawrence. Segmentation in Local Hospital Markets. Medical Care. 1993;31(1):52–64. doi: 10.1097/00005650-199301000-00004. [DOI] [PubMed] [Google Scholar]
- Dranove David, Kessler Daniel, McClellan Mark, Satterthwaite Mark. Is More Information Better? The Effects of “Report Cards” on Health Care Providers. Journal of Political Economy. 2003;111(3):555–588. [Google Scholar]
- Escarce Jose J, Van Horn R Lawrence, Pauly Mark V, Williams Sankey V, Shea Judy A, Chen Wei. Health Maintenance Organizations and Hospital Quality for Coronary Artery Bypass Surgery. Medical Care Research & Review. 1999;56(3):340–362. doi: 10.1177/107755879905600304. [DOI] [PubMed] [Google Scholar]
- Frank Richard G, Glazer Jacob, McGuire Thomas G. Measuring Adverse Selection in Managed Health Care. Journal Of Health Economics. 2000;6(19):829–854. doi: 10.1016/s0167-6296(00)00059-x. [DOI] [PubMed] [Google Scholar]
- Ginsburg Paul B, Hammons Glenn T. Competition and the Quality of Care: The Importance of Information. Inquiry. 1998;25:108–115. [PubMed] [Google Scholar]
- Hart Oliver, Shleifer Andrei, Vishny Robert W. The Proper Scope of Government: Theory and an Application to Prisons. The Quarterly Journal of Economics. 1997:128–1160. [Google Scholar]
- Hodgkin Dominic. Specialized Service Offerings and Patients’ Choice of Hospital: the Case of Cardiac Catheterization. Journal of Health Economics. 1996;15:305–322. doi: 10.1016/0167-6296(96)00004-5. [DOI] [PubMed] [Google Scholar]
- Luft Harold S, Garnick Deborah W, Mark David H, Peltzman Deborah J, Phibbs Ciaran S, Lichtenberg Erik, McPhee Stephen J. Does Quality Influence Choice of Hospital? Journal of the American Medical Association. 1990;263(21):2899–2906. [PubMed] [Google Scholar]
- McFadden Daniel, Train Kenneth. Mixed MNL Models for Discrete Response. Journal of Applied Econometrics. 2000;15(5):447–70. [Google Scholar]
- Normand Sharon L, Glickman Michael E, Gatsonis Constantine A. Statistical Models for Profiling Providers of Medical Care: Issues and Applications. Journal of the American Statistical Association. 1997;92:803–814. [Google Scholar]
- Phibbs Ciaran S, Mark David H, Luft Harold S, Peltzman-Rennie DJ, Garnick Deborah W. Choice of Hospital for Delivery: A Comparison of High-Risk and Low-Risk Women. Health Services Research. 1993;28(2):201–222. [PMC free article] [PubMed] [Google Scholar]
- Phibbs Ciaran S, Luft Harold S. Correlation of Travel Time on Roads Versus Straight Line Distance. Medical Care Research & Review. 1995;52(4):532–542. doi: 10.1177/107755879505200406. [DOI] [PubMed] [Google Scholar]
- Scanlon Dennis, Hollenbeak ChristopherS, Lee Woolton, Loft Evan, Ubel Peter A. Does Competition for Transplantable Hearts Encourage ‘Gaming’ of the Waiting List? Health Affairs. 2004;23(2):191–198. doi: 10.1377/hlthaff.23.2.191. [DOI] [PubMed] [Google Scholar]
- Tay Abigail. Hospital Quality and Competition, Dissertation. Stanford University; 2000. [Google Scholar]
- Train Kenneth. Discrete Choice Methods with Simulation. Cambridge University Press; Cambridge, UK: 2003. [Google Scholar]
- U.S. Census Bureau. Statistical Abstract of the United States 2002. 122. Washington D.C.: U.S. Census Bureau; 2001. Table 208. [Google Scholar]