

Abstract
BAFF and APRIL have been shown to promote multiple myeloma (MM) cell growth. We show that the main site of production for BAFF and APRIL is the bone marrow (BM) environment, mainly by monocytes and neutrophils. In addition, osteoclasts produce very high levels of APRIL, unlike BM stromal cells. Myeloma cells (MMC) express TACI, the receptor of BAFF/APRIL at varying levels. TACI expression is a good indicator of a BAFF-binding receptor. Expression data of purified MMC from 65 newly-diagnosed patients have been generated using Affymetrix microarrays and were analyzed by supervised clustering of groups with higher (TACIhigh) vs. lower TACI (TACIlow) expression levels. Patients in the TACIlow group had clinical parameters associated with bad prognosis. A set of 659 genes was differentially expressed between TACIhigh and TACIlow MMC. This set makes it possible to efficiently classify TACIhigh and TACIlow MMC in an independent cohort of 40 patients. TACIhigh MMC displayed a mature plasma cell gene signature, indicating dependence on the BM environment. In contrast, the TACIlow group had a gene signature of plasmablasts suggesting an attenuated dependence on the BM environment. Taken together, our findings suggest using gene expression profiling to identify the group of patients which might benefit most from treatment with BAFF/APRIL inhibitors.
Keywords: B-Cell Activating Factor, Bone Marrow, metabolism, Cluster Analysis, Gene Expression Profiling, Gene Expression Regulation, Neoplastic, Humans, Membrane Proteins, analysis, genetics, Middle Aged, Multiple Myeloma, genetics, pathology, Osteoclasts, metabolism, Plasma Cells, pathology, Prognosis, Receptors, Tumor Necrosis Factor, analysis, genetics, Transmembrane Activator and CAML Interactor Protein, Tumor Necrosis Factor Ligand Superfamily Member 13, Tumor Necrosis Factor-alpha, analysis, genetics
Introduction
Multiple myeloma (MM) is a universally fatal neoplasia characterized by the accumulation of malignant plasma cells (MMC) in the BM 1. There is increasing evidence for a major role of interactions between MMC and BM stroma for the support of survival and proliferation of the MMC 2.
Patients with MM can be grouped in accordance to cytogenetic aberrations identified by conventional metaphase cytogenetics or (interphase) fluorescence in situ hybridization (iFISH) in MMC 3,4. Patients can also be grouped in accordance to gene expression profiling (GEP) with a link between cytogenetic and GEP data 4,5. A good example is the correlation between the translocation t(4;14) and the overexpression of the multiple myeloma set domain (MMSET), or between the translocation t(11;14) and a high CCND1 overexpression 6,7. GEP has the potential to identify new pathways involved in the biology of MMC, in particular regarding the communication with the tumor environment 8–10. DNA arrays permitted to show that some HMCLs expressed a gene coding for heparin binding epidermal growth factor-like growth factor (HB-EGF), a member of the epidermal growth factor family able to bind syndecan-1 11. Further studies demonstrated that HB-EGF is a potent myeloma cell growth factor 12,13. Using Affymetrix microarrays, we also found that TACI (transmembrane activator and calcium modulator and cyclophilin ligand interactor) and BCMA (B-cell maturation antigen), each gene coding for a receptor of B-cell activating factor (BAFF) 14,15 and A Proliferation-Inducing Ligand (APRIL) 16–18 were overexpressed in malignant plasma cells compared to their normal counterparts 8,9. BAFF is a tumor necrosis factor (TNF)-family member involved in the survival of normal and malignant B cells as well as normal plasmablasts 18,19. APRIL is highly expressed in several tumor tissues and stimulates the growth of tumor cells 16. A third receptor specific for BAFF, BAFF-receptor (BAFF-R) was also identified 20. We and others showed that BAFF and APRIL serum levels are elevated in patients with MM and that BAFF and APRIL contribute to the survival of some HMCLs and of primary MMC21,22.
In this study, we have shown that the tumor environment is the main source of BAFF and APRIL in patients with MM and that TACI expression yields a functional receptor. Using Affymetrix microarrays, we demonstrated that TACIhigh MMC displayed a mature plasma cell gene signature, indicating dependence on the BM environment. In contrast, the TACIlow group had a gene signature of plasmablasts suggesting an attenuated dependence on interactions with cells in the BM environment.
Materials and methods
Cell samples
XG-1, XG-3, XG-4, XG-5, XG-6, XG-7, XG-10, XG-11, XG-12, XG-13, XG-16, XG-19, and XG-20 human myeloma cell lines (HMCLs) were obtained as described 23. SKMM, OPM2, LP1 and RPMI8226 HMCLs were purchased from ATTC (LGC Promochem, France). MMC were purified from a first series of 65 myeloma patients at diagnosis (median age, 59 years) and a second series of 40 newly-diagnosed patients after written informed consent was given. In the first series, according to Durie-Salmon classification, 12 patients were of stage IA, 12 of stage IIA, 38 of stage IIIA, and 3 of stage IIIB. 11 patients had IgAκ MM, 7 IgAλ MM, 26 IgGκ MM, 9 IgGγ MM, 7 Bence-Jones κ MM, 3 Bence-Jones γ MM, and 2 non-secreting MM. In the second series, 6 patients were of stage IA, 5 of stage IIA, 27 of stage IIIA, and 2 of stage IIIB. 4 patients had IgAκ MM, 5 IgAλ MM, 18 IgGκ MM, 7 IgGγ MM, 4 Bence-Jones κ MM, 1 Bence-Jones λ MM, and 1 non-secreting MM. Normal BM plasma cells (BMPCs) and whole BM cells (WBMCs) were obtained from healthy donors after informed consent was given. WBMCs were collected after lysis of red blood cells with NH4CI. After Ficoll-density gradient centrifugation, plasma cells were purified using anti-GDI 38 MACS microbeads (Miltenyi Biotech, Bergisch Gladbach, Germany). BM environment cells from 7 newly diagnosed patients were obtained after depletion of MMC with anti-GDI38 MACS microbeads (Miltenyi Biotech). BM culture supernatants were prepared culturing 5 × 10⁵ BM cells depleted of MMC for 3 days in RPMI1640 and 10% PCS. Supernatants were frozen at −20°C until use. For 3 newly diagnosed patients, BM T cells, monocytes and polymorphonuclear neutrophils (PMN) were purified. BM cells were labeled with a phycoerythrin (PE)-conjugated anti-CD3 MoAb, Allophycocyanin (APC)-conjugated anti-GDI 4 MoAb, and a fluorescein isothiocyanate (FITC)-conjugated anti-GDI5 MoAb (all from Becton Dickinson, San Jose, CA). CD3+, CD14+ and CD15+ cells were sorted with a FACSAria cell sorter (Becton Dickinson). Memory B cells, polyclonal plasmablasts (PPCs), immature dendritic cells (DCs) and BM stromal cell lines (BMSCs) were generated as described previously 9,24,25. BMSC culture supernatants were prepared from 3-day culture before reaching confluence and were stored at −20°c until use.
Osteoclasts
Peripheral blood mononuclear cells were obtained from 7 patients with MM after informed consent. Cells were cultured at 2.5 × 10⁶ cells/ml in αMEM-10% FCS. After 12 hours of culture, non-adherent cells were eliminated and adherent cells were cultured in αMEM-10% FCS, RANKL (50 ng/ml, PeproTech, EC Ldt, London, UK), M-CSF (25 ng/ml, Peprotech), and 10 nM dexamethasone for 14 days. Before use, osteoslasts were phenotyped by RT-PCR (TRAP and cathepsin K expression), by cytometry (integrin αvβ3 expression) and bone resorbing activity (OsteoLyse assay kit, Cambrex, Emerainville, France). Culture supernatants were prepared from mature osteoclasts cultured for 3 days with M-CSF, RANKL and DEX and were frozen at −20°C until use.
BAFF or APRIL ELISA
The concentration of BAFF was assayed using the ELISA as described previously 21, and APRIL with an ELISA purchased from Bender MedSystems (Burlingame, CA) in accordance with the manufacturer’s instructions.
Modulation of the gene expression profile by addition or deprivation of BAFF/APRIL in MMC
The modulation of gene expression by addition of BAFF and APRIL was investigated with the XG-13 HMCL21. XG-13 cells were starved of IL-6 for 2 hours, washed and cultured for 12 hours in RPM11640/10% FCS. Then BAFF and APRIL (200 ng/mL each) were added in one culture group for 10 hours. We also investigated the modulation of gene expression profile in primary MMC by BAFF and APRIL.26. BM cells of a newly-diagnosed patient with TACIhigh MMC were harvested and whole BM cells (5 × 10⁵ cells/mL) were cultured for 24 hours in RPMI1640-10%FCS. Then, 20 (μg/ml of TACI-Fc (R&D Systems, Abington, United Kingdom) were added for 10 hours in one culture group. Cells were harvested, labeled with CD138 MACS microbeads at 4°C and primary MMC were purified. RNA were extracted for gene expression profiling.
Preparation of complementary RNA (cRNA) and microarray hybridization
RNA was extracted using the RNeasy Kit (Quiagen, Hilden, Germany). Biotinylated cRNA was amplified with a double in-vitro transcription and hybridized to the human HG U133 A and B or U133 2:0 plus GeneChips, according to the manufacturer’s instructions (Affymetrix, Santa Clara, CA). Fluorescence intensities were quantified and analyzed using the GECOS software (Affymetrix).
Conventional and real-time RT-PCR
BCMA, TACI and BAFF-R PCR analysis was done as previously described 21. The assays-on-demand primers and probes and the TaqMan Universal Master Mix were used according to the manufacturer’s instructions (Applied Biosystems, Courtaboeuf, FRANCE). Real-time RT-PCR was performed using the ABI Prism 7000 Sequence Detection System and normalized to GAPDH for each sample.
Binding of BAFF to MMC
The binding of BAFF to HMCLs and primary MMC was determined using a human BAFF-murine CD8 biotinylated fusion protein (Ancell, Bayport, MN) and FACS analysis as previously described 21.
Fluorescence in-situ hybridization (FISH)
Interphase FISH was performed according to our previously reported standard protocol 27. Metaphase spreads and interphase cells were evaluated using a DM RXA2 fluorescence microscope (Leica, Bensheim, Germany).
Statistical analysis and TACIlow and TACIhigh group definition
Gene expression data were normalized with the MAS5 algorithm and analyzed with our bioinformatics platform (RAGE, Remote Analysis of microarray Gene Expression) designed by Dr T Reme (INSERM U475, Montpellier, France). Hierarchical clustering was performed with the Cluster and Treeview softwares from Eisen 28. We performed a two-sided supervised clustering between a group of patients with a high (TACIhigh) and one with low (TACIlow) expression of TACI. To account for the log-normal distribution of TACI expression, we performed this analysis with decreasing proportions of patients in the TACIhigh and TACIlow group: 40%, 25%, and 15%, respectively, of patients with the highest vs. lowest TACI expression. Genes were interpreted as differentially expressed if the p-value (Mann-Whitney test) was ≤ .01 and the ratio ≥ 1.5 or ≤ 0.67. A permutation test29 was performed to generate 100 times two arbitrary groups comprising 40%, 25% or 15%, respectively, of patients in order to get an evaluation for the number of genes differentially expressed between two arbitrary groups (P ≤ .01 and ratio ≥ 1.5 or ≤ 0.67) by chance. Statistical comparisons were done with Mann-Whitney, Chi-square, or Student t-tests.
Results
BAFF and APRIL genes are mainly expressed by the BM environment
BAFF and APRIL gene expression levels were analyzed by real time RT-PCR in 4 samples of memory B cells, 7 of normal plasmablasts, 10 of HMCLs, 7 of primary MMC, 7 of BM environment cells depleted from MMC and 5 of BM cells of healthy individuals. These data were compared with those of dendritic cells to which an arbitrary value of 100 was assigned (Figures 1A). BAFF and APRIL were highly expressed in MM BM environment as well as in normal BM. No significant differences were found between MM and normal BM samples (P = .26 for BAFF expression and P = .88 for APRIL). Concerning MM BM environment samples, median expression values were 66 for BAFF and 46 for APRIL, about half of the expression in dendritic cells known to highly produce BAFF or APRIL 30. Primary MMC weakly expressed BAFF or APRIL. The median expressions were 102-fold and 45-fold lower than those in the tumor environment (P = .005) respectively. The majority of HMCLs and normal plasmablasts also expressed BAFF or APRIL but at a rather low level as compared to the BM environment. The two cell lines (XG-5 and XG-20) with the highest APRIL expression have been previously identified with conventional RT-PCR 21. BAFF and APRIL expressions in plasmablasts were 29- and 31-fold lower, respectively, than those in memory B cells from which they arose (P = .002 and P = .007) 9. Thus, BAFF and APRIL genes are mainly expressed by the BM environment and only occasionally by MMC.
Figure 1. Expression of B/AFF and APRIL in the BM environment cells and MMC.
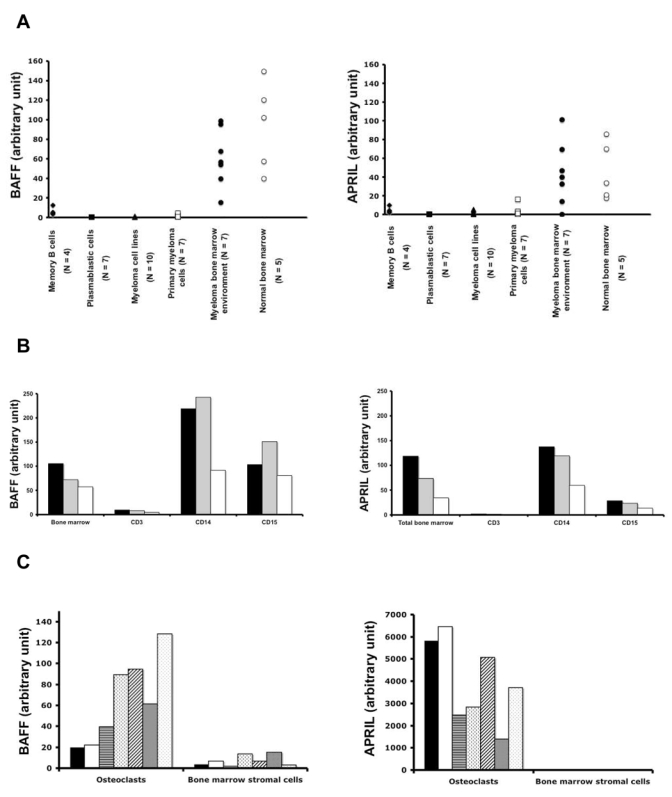

A. BAFF and APRIL expressions were determined by quantitative PCR in 4 samples of memory B cells, 7 of normal plasmablasts, 10 of HMCLs, 7 of primary MMC, 7 of BM environment cells depleted from MMC and 5 of BM cells of healthy individuals.
B. BAFF and APRIL expressions were determined by quantitative PCR in purified BM CD3, CD14, or CD15 positive cells. These cells were obtained from 3 newly-diagnosed patients with MM.
C. BAFF and APRIL expressions were determined by quantitative PCR in 7 samples of BM stromal cell lines and 7 samples of in-vitro-generated osteoclasts. Primary cells were obtained from newly-diagnosed patients with MM.
Dendritic cells (DC) were used as positive control and assigned the expression value of 100 arbitrary units.
D. BAFF and APRIL concentrations in culture supernatants of BM cells of 10 patients with MM, 7 different BM stromal cell line samples from MM patients, and 7 different samples of osteoclasts were determined by ELISA.
In order to identify the cell type expressing BAFF or APRIL in the MM environment, BM CD3, CD14 and CD15 cells of 3 patients were purified. BAFF was mainly expressed by BM CD14 and CD15 cells and APRIL by CD14 cells. CD3 cells expressed BAFF and APRIL only at a low level (Figure 1B). To assess a broad range of populations present in the bone microenvironment, BMSCs and osteoclasts were also studied. BMSCs from 7 patients with MM expressed weakly BAFF and APRIL (Figure 1C). Of major interest, osteoclasts largely expressed APRIL gene. Median APRIL expression was 80-fold higher than that in BM environment (P = .001). Osteoclasts also express BAFF gene but in the same extent as the BM environment.
BAFF and APRIL production by BM cells
The production of BAFF and APRIL was investigated in 3-day culture supernatants of BM cells of 10 newly-diagnosed patients, of 7 osteoclasts, and of 7 BMSCs. In agreement with real time RT-PCR data, low amount of BAFF and no APRIL could be found in BMSC supernatants. Median concentrations of 12.5 ng/ml of BAFF and 24.6 ng/mL of APRIL were measured in supernatants of BM cells. Again, in agreement with RT-PCR data, osteoclasts produced large amounts of APRIL (a concentration of 206 ng/ml), i.e. 8-fold higher than BM cells (P ≤ .001). The median production of BAFF by osteoclasts was 3-fold higher than that of BM cells (P ≤ .001).
TACI gene expression yields a functional BAFF-binding receptor in HMCLs and primary MMC
Gene expression profiling (GEP) was performed on 17 HMCL using Affymetrix U133 A+B microarrays. On these, no probeset for BAFF-R was available. The Affymetrix data for TACI expression perfectly matched the real time RT-PCR and previous RT-PCR data 21 and were consistent with the HMCL ability to bind BAFF-murine CD8. Indeed TACI had an Affymetrix “absent” call (as decided by the GCOS-software) in these HMCLs that showed a lack of TACI mRNA expression by real time or conventional RT-PCR and a lack of binding of BAFF-murine CD8. TACI had an Affymetrix “present” call in the TACI RT-PCR+ HMCLs which also bound BAFF-murine CD8 (Table 1). The BCMA gene had a “present” call in 17/17 HMCLs, as had been assumed after BCMA was found in RT-PCR experiments (Table 1). These data suggest that although BCMA is expressed, the BCMA protein is not functional, possibly due to retention in the Golgi apparatus as shown for plasma cells 31. This observation holds true for purified primary MMC. MMC (# 1-5) that highly expressed BCMA but weakly TACI according to RT-PCR results, failed to bind BAFF-murine CD8 (Figure 2). In contrast, primary MMC (# 6-10) that highly expressed TACI bound human BAFF-murine CD8 (Figure 2). Thus, TACI gene expression yields a BAFF-binding receptor in HMCLs or primary MMC.
Table 1.
TACI gene expression yields a BAFF/APRIL receptor with functional binding capacity in HMCLs.
| HMCLs | PCR | Binding of BAFF-muCD8 | Real-time RT-PCR TACI | Affymetrix TACI | Affymetrix BCMA | ||
|---|---|---|---|---|---|---|---|
| BCMA | BAFF-R | TACI | |||||
| XG-12 | + | − | + | + | + | P | P |
| XG-13 | + * | + * | + * | + * | + | P | P |
| XG-19 | + | + | + | + | + | P | P |
| XG-20 | + * | + * | + * | + * | + | P | P |
| RPMI8226 | + * | + * | + * | + * | + | P | P |
| LP1 | + * | + * | + * | + * | + | P | P |
| XG-1 | + * | + * | −* | −* | − | A | P |
| XG-3 | + | − | − | − | − | A | P |
| XG-4 | + | + | − | − | − | A | P |
| XG-5 | + * | −* | −* | −* | − | A | P |
| XG-6 | + * | −* | −* | −* | − | A | P |
| XG-7 | + * | + * | −* | −* | − | A | P |
| XG-10 | + | + | − | − | − | A | P |
| XG-11 | + * | −* | −* | −* | − | A | P |
| XG-16 | + | − | − | − | − | A | P |
| OPM2 | + | + | − | − | − | A | P |
| SKMM | + | − | − | − | − | A | P |
Expression of BCMA, BAFF-R and TACI mRNA were determined by RT-PCR in 17 HMCLs. TACI and BCMA expressions were also determined with Affymetrix microarrays. The probeset for BAFF-R was not available on the Affymetrix HG U133 A+B DNA microarrays. The expression of BAFF-binding was determined by flow cytometry using biotinylated human BAFF-murine CD8 fusion protein and phycoerythrin-conjugated streptavidin.
Indicates that these data were from our previous published data21.
Figure 2. Expression of the receptors for BAFF and APRIL in MMC.

Expression of BCMA, BAFF-R, TACI and GAPDH mRNA were determined by RT-PCR in CD138+ purified primary MMC from 10 patients with intramedullary MM. The ability of MMC to bind BAFF was determined by flow cytometry using a biotinylated human BAFF-murine CD8 fusion protein and phycoerythrin-conjugated streptavidin.
Clinical and genetic data of the TACIlow and TACIhigh patients
Gene expression profiles of the 65 primary myeloma cell samples were determined with Affymetrix microarrays. TACI had a “present” Affymetrix call in all primary MMC investigated, displaying a lognormal distribution. We did not find the clear-cut difference (absent or present Affymetrix call) for primary MMC which was observed for HMCIs. One possible explanation is the presence of MMC subclones with different levels of TACI expressions in the same patient. We looked for differences in the major clinical, biological or genetic markers in patients with a low or high TACI expression in MMC (TACIlow or TACIhigh patients). To find the best way to delimit TACIlow and TACIhigh patients, we considered subgroups defined by 50%, 40%, 25% or 15%, respectively, of the patients with the highest or lowest TACI expression in MMC. The clinical and biological differences observed showed the clearest distinction when the 15%-group was considered. Here, the TACIhigh group included a higher frequency of patients within stage I MM, with lambda light-chain isotype, with t(4;14) translocations, with hemoglobin > 10 g/dL, and a lower frequency of patients with bone lesions (Table 2). The percentage of patients with MMC harboring a t(4;14) translocations was 14% in agreement with published data 3,32. Most of these differences were kept when considering TACI groups representing 25% and 40% of the patients (distribution of bone lesions, t(4;14) translocations, lambda light chain isotype). However, they were lost when considering TACI subgroups delimited by the median. Whatever method used to define TACIlow and TACIhigh subgroups, no differences in age, β2m, CRP, albumin, LDH levels, IgG subtypes, or chromosome 13 deletion were found (Table 2).
Table 2.
Clinical data of the TACIhigh and TACIlow patients. 65 newly-diagnosed patients with MM were separated in 2 subgroups according to TACI gene expression in MMC assayed with Affymetrix microarrays. The 2 subgroups represent either 50% (n = 32), 40% (n = 25), 25% (n = 15), or 15% (n = 10) of the patients with highest (TACIhlgh) or lowest (TACIlow) TACI expression. Data are the percentages of patients within each subgroup with the indicated clinical or biological parameters.
| Definition of TACIlow and TACIhigh subgroups (% of all id patients) | ||||||||||||||||||||||||
|---|---|---|---|---|---|---|---|---|---|---|---|---|---|---|---|---|---|---|---|---|---|---|---|---|
| 50%/50% | 40%/40% | 25%/25% | 15%/15% | |||||||||||||||||||||
| Categories | TACIhigh | TACIlow | TACIhigh | TACIlow | TACIhigh | TACIlow | TACIhigh | TACIlow | ||||||||||||||||
| % of patients in each subgroups | ||||||||||||||||||||||||
| Age ≥ 65 yr | 30% | 24% | 28% | 28% | 20% | 40% | 20% | 40% | ||||||||||||||||
| Kappa light chain | 65% | 70% | 64% | 80% | 60% | 66% | 50% | 70% | ||||||||||||||||
| Lambda light chain | 35% | 26% | 36%* | 16%* | 40%* | 76%* | 50%* | 20%* | ||||||||||||||||
| Non-secreting | 0% | 4% | 0% | 4% | 0%* | 18%* | 0%* | 10%* | ||||||||||||||||
| IgA subtype | 25% | 31% | 24% | 24% | 33% | 27% | 20% | 30% | ||||||||||||||||
| Beta2-microglobulin ≥ 4 mg/liter | 44% | 37% | 40% | 40% | 40% | 60% | 30% | 60% | ||||||||||||||||
| C-reactive protein ≥ 4 mg/liter | 44% | 53% | 40% | 56% | 47% | 67% | 50% | 70% | ||||||||||||||||
| Lactate dehydrogenase ≥ 190 IU/liter | 28% | 16% | 28% | 20% | 27% | 20% | 40% | 30% | ||||||||||||||||
| Albumin < 35 g/liter | 37% | 37% | 40% | 36% | 47% | 33% | 60% | 40% | ||||||||||||||||
| Hemoglobin < 10 g/dl | 28% | 35% | 36% | 44% | 20%* | 47%* | 20%* | 60%* | ||||||||||||||||
| Bone lesions | ||||||||||||||||||||||||
| 0 lesions | 42% | 20% | 45%* | 70%* | 43%* | 8%* | 44%* | 0%* | ||||||||||||||||
| ≥ 1 lesions | 58% | 80% | 55%* | 90%* | 57%* | 92%* | 56%* | 100%* | ||||||||||||||||
| Cytogenetic abnormalities | ||||||||||||||||||||||||
| Chromosome 13 deletion | 22% | 31% | 24% | 32% | 27% | 33% | 30% | 40% | ||||||||||||||||
| t(4;14) translocation | 22%* | 6%* | 20%* | 8%* | 27%* | 6%* | 30%* | 0%* | ||||||||||||||||
| t(11;14) translocation | 9% | 9% | 12% | 12% | 20% | 6% | 20% | 10% | ||||||||||||||||
| 50%/50% | 40%/40% | 25%/25% | 15%/15% | |||||||||||||||||||||
| TACIhigh | TACIlow | TACIhigh | TACIlow | TACIhigh | TACIlow | TACIhigh | TACIlow | |||||||||||||||||
| Staging | I | II | III | I | II | III | I | II | III | I | II | III | I | II | III | I | II | III | I | II | III | I | II | III |
| 9 | 5 | 18 | 3 | 5 | 24 | 8 | 5 | 12 | 3 | 4 | 18 | 6 | 2 | 7 | 0 | 3 | 12 | 4 | 1 | 5 | 0 | 2 | 8 | |
| P = 0.1 | P = 0.02 | P = 0.02 | P = 0.08 | |||||||||||||||||||||
When the percentages were different with the Chisquare test (P ≤ .05), the data are shown in italic.
Gene expression signature of microenvironment dependence in TACIhigh MMC and plasmablastic signature in TACIlow MMC with Affymetrix microarrays
In order to investigate if different gene signatures could be identified comparing two groups with different TACI expression, we performed a supervised clustering. We considered the three groups with significant clinical differences (40%, 25% and 15% of the patients). Of 49.000 probesets present on the U133 A+B DNA-microarrays, we found 1612, 2709 and 1805 probesets, respectively, to be differentially expressed between the two groups (P ≤ .01 with Mann Whitney test and ratio of the mean expressions ≥ 1.5 or ≤ 0.67). To get an impression about the number of genes differentially expressed by chance between the groups, we performed 100 permutations with two subgroups comprising 40%, 25% or 15% of the MM patients randomly sorted out of the 65 samples. Only 5% of the genes appeared to be differentially expressed, if the groups were selected by chance. A common set of 548 distinct genes and 111 distinct expressed sequence tags (EST) were differentially expressed between TACIhigh and TACIlow MMC independently of the definition of TACIhigh and TACIlow groups. This list of 659 genes/EST is available on our web site as supplementary Tables A and B.
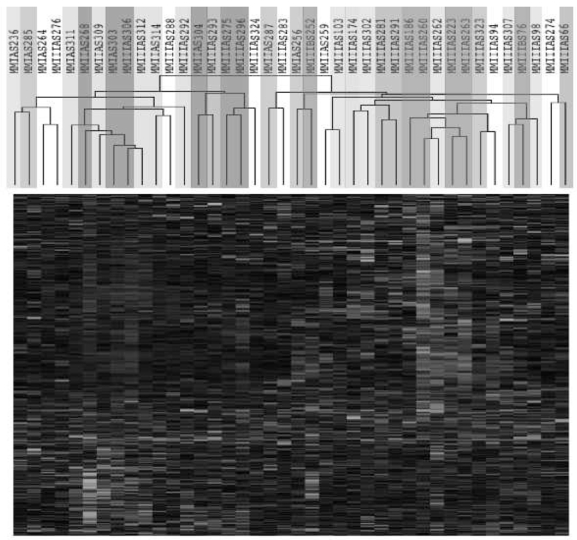
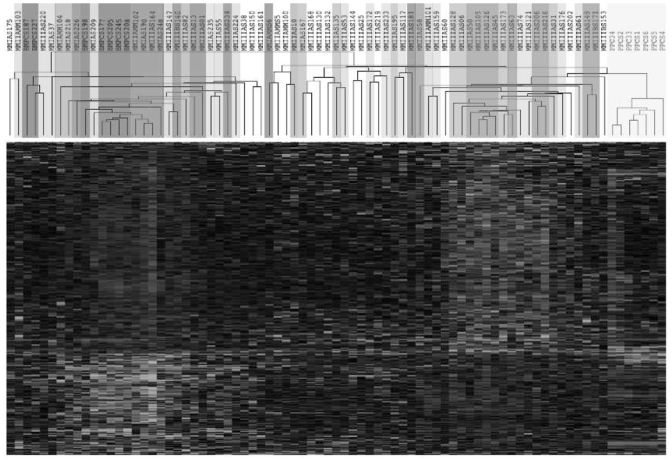
We performed an unsupervised hierarchical clustering using these 659 genes/EST (Figure 3 A). TACIhigh and TACIlow MMC appear in different branches of the cluster analysis. The TACUI40low, TACI25low and TACI15low groups were represented by graded blue color (more intense in TACI15low) and were classified in one branch with limited misclassifications in each category. For example, the 40%-groups were significantly classified (P ≤ .01) with 5 misclassifications. The TACI40high, TACI25high, and TACI15high were represented with graded red color (more intense in TACI15high) and classified in another branch. Patients outside the subgroups (white color) were interdispersed in the two clusters. The ability of this 659 gene/EST list to classify TACIhigh and TACIlow MMC was validated with another series of GEP from 40 purified MMC, unrelated to the 65 previous ones, that was obtained with Affymetrix U133 2.0 plus microarrays (Figure 3 B). Although this new series of primary MMC was smaller and that a different microarray was used, the U133 2.0 plus probesets corresponding to the 659 U133 A+B genes/EST were able to efficiently classify TACIhigh and TACIlow MMC. In particular, the 40%-groups were significantly classified (P ≤ .01) with 6 misclassifications. This differential gene expression in TACIhigh and TACIlow MMC observed with Affymetrix microarrays was validated for TACI and 3 other genes (CDC2, TYMS and c-met) with real time RT-PCR. 3334Real time RT-PCR and Affymetrix data showed a good correlation (r ≥ .85, P ≤ .01) (Figure 4).
Figure 3. Unsuoervised hierarchical clustering of TACIhigh and TACIlow MMC.
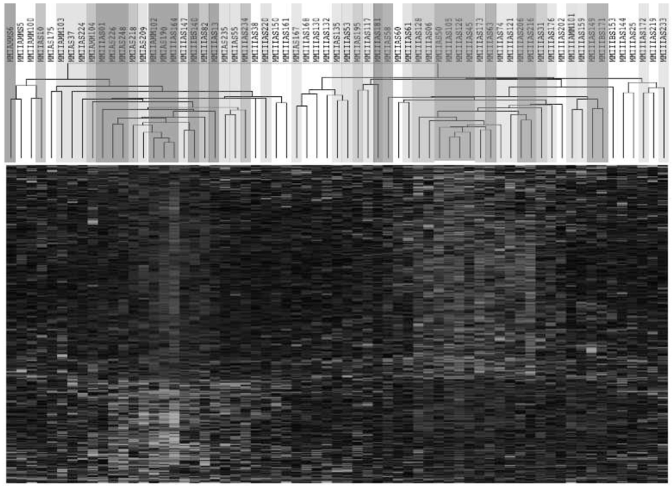
The 659 genes that statistically (P ≤ .01) distinguished (ratio ≥ 1.5 or ≤ 0.67) TACIhigh patients and TACIlow patients are presented graphically using hierarchical clustering. The color of each cell in the tabular image represents the expression level of each gene (red, expression higher than the mean; green, expression lower than the mean; increasing color intensity represents a higher magnitude of deviation from the mean). The TACI40low, TACI25low and TACI15low subgroups were represented by graded blue color (more intense in TACI15low) and the TACI40high, TACI25high, and TACI15high were represented with graded red color (more intense in TACI15high).
A. Initial set of 65 patients.
B. Validation set of 40 patients.
Figure 4. Validation of Affymetrix data.
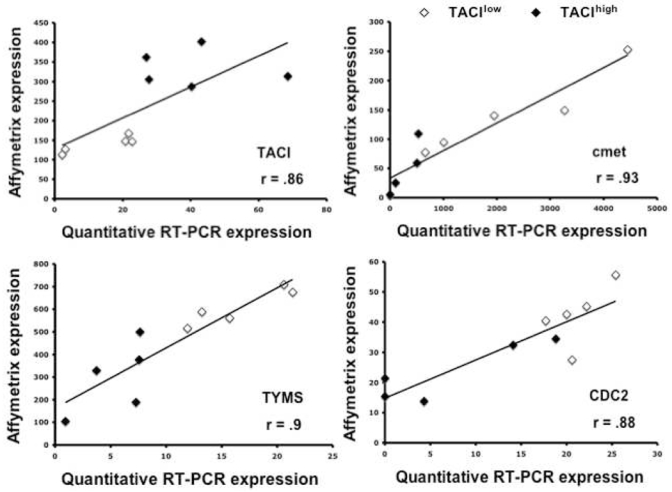
Gene expressions of TACI, MET, TYMS, and CDC2\n TACIlow and TACIhigh patients were assayed with real time RT-PCR and normalized with GAPDH. The XG-13 HMCL was used as the standard. The coefficient of correlations between Affymetrix and real-time RT-PCR values were determined.
339 of the 659 genes and ESTs mentioned above (52% of the 479 genes/EST overexpressed in TACIhigh patients and 50% of the 180 genes/EST overexpressed in TACIlow patients) could be assigned to 8 functional categories listed in Table 3 using Gene Ontology terms. TACIhigh MMC expressed a higher percentage of genes coding for intercellular communication signals, cytoskeleton-associated proteins and signal transduction (Table 3). Conversely, TACIlow MMC overexpressed genes coding for proteins involved in cell cycle and nuclear functions (Table 3).
Table 3.
Intercellular communication signature in TACIhigh MMC and plasmablastic signature in TACIlow MMC. A. 339 of the 659 genes differentially expressed between the TACIhigh and TACIlow groups could be assigned to 8 functional categories using Gene Ontology terms. Data are the percentages of genes of a given category compared to the total number of TACIlow (91 genes) or TACIhigh (248 genes) genes.
| TACIlow | TACIhigh | ||
|---|---|---|---|
| Genes coding for protein implicated in: | |||
| Intercellular communication signals (N = 69)* | 2.1 % | 26.3 % | P = 4.9.10−7** |
| Cytoskeleton (N = 20) | 2.1 % | 7.2 % | P = .04** |
| Transduction signals (N = 52) | 1 1 .2 % | 17% | P = 05** |
| Protein synthesis and regulation (N = 19) | 7.7 % | 4.8 % | NS |
| Cell cycle (N = 11) | 10% | 0.8 % | P = 2.5.10−5** |
| Metabolism (N = 85) | 22.1 % | 26.6 % | NS |
| Apoptosis (N = 10) | 4.2 % | 2.8 % | NS |
| Nuclear functions (N = 73) | 40.6 % | 1 5.2 % | P = 1.10−6** |
| Total of classified genes (N = 339) | 100% (n = 91) | 100% (n = 248) | |
in parenthesis are indicated the number of genes out of the 339 in one category.
the statistical comparisons of the percentages of genes belonging to one GO-category between the TACIlow and TACIhigh group genes were performed with Chisquare test.
TACIhigh MMC have a BMPC signature and TACIlow a plasmablastic signature
We investigated the association of plasmablasts and normal BMPCs with MMC in the TACIhigh and TACIlow groups. Using an unsupervised clustering with the above mentioned 659 genes, the samples of patients in the TACIlow group clustered together with plasmablasts (correlation coefficient, 0.33; P = .001) whereas TACIhigh samples clustered with BMPC (correlation coefficient, 0.35; P = .001) (Figure 5). When comparing plasmablasts with normal BMPC, of the 659 genes/EST differentially expressed between the TACIhigh and TACIlow groups, 195 also appeared as differentially expressed between the plasmablasts and BMPC. Of these, 115 were overexpressed in BMPC compared to plasmablasts and 80 overexpressed in plasmablasts compared to BMPC (ratio of the mean expressions ≥ 1.5 and ≤ 0.67, and P ≤ .01). 111 out of 115 BMPC genes were also upregulated in TACIhigh compared to TACIlow MMC. Conversely, 77 out of the 80 PPC genes were overexpressed in TACIlow MMC (P ≤ .01). BMPC and plasmablast genes are indicated in supplementary Tables C and D.
Figure 5. Hierarchical clustering of MMC. BMPC. and PPG identifies a signature of BM stroma interaction for TACIhigh patients and a plasmablastic signature for TACIlow patients.
Unsupervised hierarchical clustering analysis of the expression profile of MMC of 65 patients at diagnosis, 7 PPC samples and 7 BMPC samples show that TACIlow MMC cluster (blue) together with PPC (yellow) whereas TACIhigh cluster (red) with normal BMPC (purple). The clustering was performed on the 659 genes differentially expressed between TACIhigh and TACIlow MMC. The TACI40low, TACI25low and TACI15low subgroups were represented by graded blue color (more intense in TACI15low) and the TACI40high, TACI25high, and TACI15high with graded red color (more intense in TACI15high).
Taken together, these results suggest that grouping of patients in accordance with “high” and “low” TACI expression delineates a group of patients whose MMC share gene expression characteristics with plasmablasts (TACIlow) and a group in which the gene expression profiling resembles normal mature BM plasma cells (TACIhigh). TACIhigh MMC overexpress many genes coding for potentially interesting intercellular communication or transduction signals whose biology is discussed below. In contrast, TACIlow MMC mainly overexpress cell cycle genes.
Modulation of gene expression profile by addition or deprivation of BAFF and APRIL in MMC
In order to look whether the TACIhigh and TACIlow gene signature could be induced by BAFF/APRIL, we first used the XG-13 HMCL which is stimulated by BAFF and APRIL 21. After growth factor starvation, addition of BAFF and APRIL for 10 hours induced an increase of 196 genes/EST and a decrease of 348 genes/EST (P ≤ .01 and ratio ≥ 1.5 or ≤ 0.67). However, only 19 genes were common with the TACI-related gene signature (supplementary data in Table E). We then26 decided to investigate the effect of BAFF/APRIL deprivation using a whole BM culture system in which BAFF and APRIL were blocked by TACI-Fc inhibitor for 10 hours. Subsequently, MMC were purified for gene expression profiling with Affymetrix U133 2.0 plus microarrays. 188 genes and ESTs were down regulated in BAFF/APRIL deprived MMC (treated with TACI-Fc) and 259 were upregulated (P ≤ .01 and ratio ≥ 1.5 or ≤ 0.67). However, only some of these genes were common with the TACIhigh of TACIlow gene signature. This list is available as supplementary data in Table F.
Discussion
Two recent studies have shown that BAFF and APRIL are growth factors for human MMC and that serum levels of BAFF and APRIL are increased in these patients 21,22. Using real time PCR, we show that BAFF and APRIL genes are poorly expressed by MMC and mainly by the BM environment of MM patients. BM cells from healthy individuals exhibit a similar expression. The MM bone environment comprises mainly of PMN (45%), monocytes (5%) and T cells (10%). We show here that BAFF was largely expressed by PMN and monocytes whereas APRIL was expressed by monocytes only. A majority of the studies about MM use BM mononuclear cells after removal of PMN with centrifugation on a ficoll hypaque cushion. Thus, the contribution of PMN is in many cases ignored whereas they are the main BM cell components in vivo and here shown to be the main source of BAFF. Another cell component in the BM environment important for myeloma cell biology is bone cells. Primary MMC can survive in contact with BMSCs 35 or osteoclasts 36. In addition, fetal bone is critical to grow MMC in SCID mice 37,38. As these bone cells cannot be harvested by BM aspiration, they are usually produced in vitro. We show here that cultured osteoclasts display a huge APRIL expression, about 80-fold higher than those found in the MM BM environment or in dendritic cells. The BAFF expression was in the same order of magnitude in both cases. Using ELISA, we confirmed that osteoclasts produced very large amounts of APRIL. Thus APRIL could likely play an important role in the MMC growth stimulation by osteoclasts 36. BM stromal cells produced only a low amount of BAFF and no APRIL.
Purified MMC also express BAFF or APRIL but in the median about 100 fold weaker than the BM environment. This BAFF or APRIL expression pattern and distribution resembles the one of IL-6. A current consensus is that IL-6 is a paracrine growth factor in multiple myeloma and that some MMC may produce autocrine IL-6 and uses it to escape from their dependency on the tumor environment. 39,40. 39,40 In particular, several HMCLs use IL-6 as an autocrine growth factor 41,42. Similarly, we have previously found that two HMCLs - L363 and RPMI 8226 - use BAFF or APRIL as autocrine growth factors, while we found here that BAFF and APRIL are mainly paracrine growth factors if assessing primary MM cells. The autocrine production may have contributed to the escape of these MMC from the tumor environment.
Given that BAFF and APRIL are paracrine growth factors, our aim was to look for a difference in the GEP of patients’ MMC expressing a high or alow level of BAFF and APRIL receptors. An important point is that TACI expression (assayed with Affymetrix microarrays or RT-PCR) is a good indicator for the presence of a receptor, able to bind BAFF. There are three receptors for BAFF and APRIL, BCMA, BAFF-R and TACI. Probesets for BCMA and TACI were available on the Affymetrix U133 A+B chips, unlike BAFF-R. We could not identify an EST with BAFF-R sequence homology in any Affymetrix probesets. BCMA was probably not functional in MMC and TACI expression was a good indicator of a functional BAFF receptor. Indeed only the 6 out of the 17 HMCLs with a “present” call for TACI expression with Affymetrix microarrays were able to bind a BAFF-murine fusion protein, independent of BCMA expression. BCMA was already shown to be not functional in several cell types, in particular in human plasma cells and the U266 myeloma cell line due to retention in golgi apparatus 31. However, it is not likely the case for murine plasma cells since BCMA−/− mice have normal B cell function but fail to develop mature plasma cells 43.
When grouping the patients in accordance with the TACI-expression levels as described above, the MMC in the TACIhigh group show a signature resembling mature BMPCs with an emphasis on the expression of genes with products functioning in intercellular communication and signal transduction. In contrast, the TACIlow MMC showed a signature sharing similarities with plasmablasts, especially as regards to the expression of cell cycle genes. The consistency of this signature was validated on an independent group of 40 MMC using Affymetrix U133 2.0 plus microarrays. We looked for the possibility that this gene signature could be due in part to signal transduction induced by TACI activation. We used first the XG-13 HMCL whose growth is stimulated by BAFF or APRIL 21. We also used primary MMC from a newly-diagnosed patient. In this case, as primary MMC rapidly apoptosed as soon as they are purified 26, we looked for the effect of BAFF/APRIL deprivation on the gene expression profile of MMC cultured together with their BM environment. In the two cases investigated, a large number of genes were up- or downregulated but only a few genes belonged to the TACI signature.
This indicated that this gene signature is not linked to TACI stimulation but to the degree of dependency of myeloma cell growth on the interaction with the BM environment. As BAFF or APRIL are mainly produced by the BM environment and are potent growth factors for normal and malignant plasma cells, it seems logical that MMC that depend more on BAFF/APRIL for their growth, overexpress TACI and molecules involved in the interaction with their environment.
Of interest, clinical and genetic differences were found between patients with TACIlow or TACIhigh MMC. TACIlow patients had a plasmablast signature, an increase in the percentage of stage III MM, a decrease in hemoglobin level, an increase in the percentage of bone lesions. It is of note that clinical parameters and risk factors (β2m, CRP, LDH) were not different between TACI groups suggesting that TACI might be an independent prognostic factor, which has to be evaluated in further studies. No significant difference in event-free and overall survivals were found between TACIlow and TACIhigh patients. This is understandable because the median follow-up of this series of patients was short at the time of the study (18 months). Recently, DKK gene upregulation was associated with increased bone lesions 10. Tian et al. pointed out that DKK1 was not expressed in plasmablastic MMC 10, one of the major characteristic features of TACIlow MMC. This may explain why we found no upregulation of DKK1 in TACIlow MMC although increased bone lesions are found in TACIlow patients. Regarding genetic alterations, we found a higher percentage of patients with a t(4;14) translocation within the TACIhigh group and no increase of chromosome 13 deletion in the TACIhigh group although t(4;14) was strongly associated with deletion 13 3. Actually about half of the MMC have deletion 13 and only 14% a t(4;14) translocation, which may explain this discrepancy.
It was not in the scope of our work to comment on all the genes differentially expressed between TACIlow and TACIhigh MMC. Therefore, in figure 6, we have selected for genes that appeared to us the most promising for myeloma biology understanding. First, we found an increased proportion of MMC secreting lambda light chain in TACIhigh MMC. Given that immunoglobulin light chain rearrangement occurs in pre-B cells, we have no explanation for this observation. Focusing on growth factor related molecules, we found that MMC in the TACIhigh group overexpress two neurotrophic tyrosine kinase receptors, NTRK3 which binds neurotrophin 3 and NTRK4. They also overexpress Platelet derived growth factor, CCR6, TNF, interleukin-22 receptor, two ephrins (B4 and B6) and the somatostatin receptor 2 (SSTR2). The IL-22 receptor complex consists of IL-10Rβ and IL-22R 44. The IL-10Rβ serves as a common receptor chain for both IL-10 and IL-22. As we previously demonstrated IL-10 to be a growth factor for human MMC 45, the role of IL-22 in multiple myeloma biology needs to be investigated. The somatostatin receptor family comprises several members and SSTR2 is expressed in different cancers 46,47. Of interest, the somatostatin analog octeotride binds SSRT2 and has been shown to induce apoptosis in MMC 48. MMC in the TACIhigh group overexpress the carcinoembryonic antigen-related cell adhesion molecule (CEACAM)1, CEACAM5 and CEACAM6 adhesion molecules. CEACAM1 is necessary for VEGF activity 49. Given the likely role of VEGF in multiple myeloma, a role of CEACAM1 in MM demands further investigation. Furthermore, we found an overexpression of two ephrin receptors: EphB4 and EphB6. Ephrin receptors are overexpressed in various tumor types, suggesting that they play a role in cancer progression 50. Recently, a study demonstrated that EphB4 acts pro-angiogenic in breast cancer51. It proposes that the interplay between the EphB4 ectodomain on tumor cells and the ephrin-B2 in the vasculature promotes blood vessel formation and remodeling. TACIhigh MMC overexpress the chemokine CXCL1. This is of interest because CXCL1 was recently found to bind soluble syndecan-1 52, a proteoglycan that is a hallmark of plasma cell differentiation. Actually, MMP7 deficient mice have a major defect in neutrophil attraction due to a defect in cleavage of syndecan-1 by MMP7, of binding of CXCL-1 to syndecan-1 and thus of a chemoattracting role of CXCL-1 52. MMC produce soluble syndecan-1, the serum level of which is increased in patients with MM 53. MMP7 is expressed in all myeloma cell samples investigated by Affymetrix microarrays. CXCL1 produced by MMC in the TACIhigh group could play an important role in the biology of MMC by recruiting cells of the microenvironment, in particular PMN that largely express BAFF.
Figure 6. BM environment dependence signature of TACIhigh patients and plasmablastic signature of TACIlow patients.
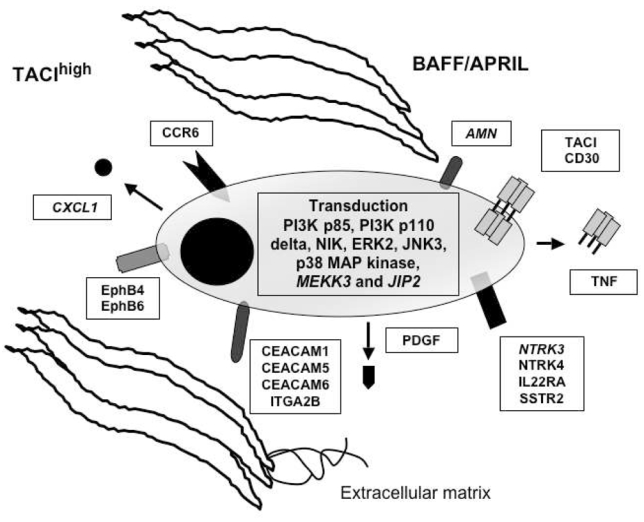
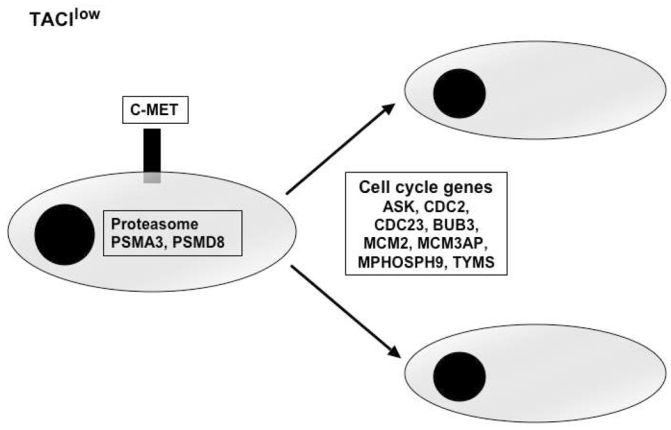
TACIhigh MMC had a BM environment dependence signature with overexpression of intercellular communication and transduction genes. TACIlow MMC have a plasmablastic signature with an overexpression of genes involved in the cell cycle.
Regarding adhesion molecules, MMC in the TACIhigh group overexpress several of theses, in particular integrin alpha 2B, also overexpressed in BMPCs compared to plasmablasts 54.
Regarding the transduction elements that may be associated with TACI activation, we found an overexpression of mitogen-activated kinase kinase 3 (MKK3), mitogen-activated protein kinase (ERK2), mitogen-activated protein kinase 10 (JNK3), mitogen-activated protein kinase 14 (P38 MAP Kinase), and mitogen-activated protein kinase 8-interacting protein 2 (JIP2) in MMC belonging to the TACIhigh group. The substrate of MKK3 is P38 MAP kinase, which is known to be induced by BAFF/APRIL in various cells 55. JIP2 forms complexes with MAP kinases, in particular with MKK3 and P38 56,57. The overexpression of ERK2 in MMC of the TACIhigh group is in good agreement with our previous results demonstrating that the MAPK pathway is activated, in MMC, by BAFF and APRIL. P38 kinase is also activated in MMC and an inhibitor of P38 induces apoptosis in MMC 58. BAFF/APRIL trigger PI-3 kinase in MMC 21, and in good agreement, the P85 subunit of PI-3K is overexpressed in TACIhigh MMC. PIK3CD (P110 delta polypeptide) is also overexpressed in TACIhigh MMC. P110 delta is expressed at high levels in lymphocytes of lymphoid tissues and play a role in phosphatidylinositol 3-kinase-mediated signaling in the immune system 59. Promotion of survival of BAFF and APRIL in B cells and MMC are consistent with NF-kappaB activation. In agreement with these data, the NF-kappaB inducing kinase (NIK) is overexpressed in TACIhigh patients. In T1 B cells, BAFF stimulation promote B cell survival, causing the processing of the p100 form of NfκB2 to p52 which required BAFF-R and NIK 60. Previously, we demonstrated that BAFF and APRIL induce the upregulation of the anti-apoptotic protein Bcl-2 21. Confirming these results, we show here that TACIhigh patients overexpress Bcl-2.
MMC from patients belonging to the TACIlow group overexpress genes coding for proteins implicated in cell-cycle and in nuclear functions. These cells overexpress genes coding for protein involved in G1/S transition and mitosis and contributing to plasmablastic signature. Among them, we validated two genes: thymidilate synthetase (TYMS) and cell cycle controller CDC2.61 Their overexpression is associated with chemotherapy resistance in cancer 62,63 and these two genes are also differentially expressed between patients with or without chromosomal abnormalities 33. 64MMC in the TACIlow group overexpress two genes coding for proteasome subunits and could also be an indicator of increased sensitivity to proteasome inhibitors 65. MMC from patients belonging to the TACIlow group overexpress c-met, the receptor of HGF. HGF is a myeloma growth factor 66,67. 68These results suggest that c-met could be a therapeutic target in TACIlow MMC.
In conclusion, TACI is overexpressed in patients whose MMC have a gene signature indicative of a dependence on the tumor environment. This fits well with the production of the TACI ligands, BAFF and APRIL, by the tumor environment. TACIlow MMC overexpress in turn cell cycle genes indicative of a plamablastic signature. Taken together, our findings foster a clinical use of inhibitors interfering with the BAFF/APRIL – TACI interaction like the TACI-Fc fusion protein, and at the same time suggest to use gene expression profiling to identify the group of patients which might benefit most from this kind of treatment.
References
- 1.Klein B, Tarte K, Jourdan M, et al. Survival and proliferation factors of normal and malignant plasma cells. Int J Hematol. 2003;78:106–113. doi: 10.1007/BF02983377. [DOI] [PMC free article] [PubMed] [Google Scholar]
- 2.Hideshima T, Bergsagel PL, Kuehl WM, Anderson KC. Advances in biology of multiple myeloma: clinical applications. Blood. 2004;104:607–618. doi: 10.1182/blood-2004-01-0037. [DOI] [PubMed] [Google Scholar]
- 3.Avet-Loiseau H, Facon T, Grosbois B, et al. Oncogenesis of multiple myeloma: 14q32 and 13q chromosomal abnormalities are not randomly distributed, but correlate with natural history, immunological features, and clinical presentation. Blood. 2002;99:2185–2191. doi: 10.1182/blood.v99.6.2185. [DOI] [PubMed] [Google Scholar]
- 4.Fonseca R, Barlogie B, Bataille R, et al. Genetics and cytogenetics of multiple myeloma: a workshop report. Cancer Res. 2004;64:1546–1558. doi: 10.1158/0008-5472.can-03-2876. [DOI] [PubMed] [Google Scholar]
- 5.Hose D, Rossi J-F, Ittrich C, de Vos J, Reme T, Benner A, Bila J, Raab M, Theil A-C, Kaukel P, Moos M, Grau V, Jauch A, Jourdan E, Goldschmidt H, Klein B, Cremer F. A New Molecular Classification Of Multiple Myeloma (MM) Using Gene Expression Profiling (GEP) And Fluorescence In Situ Hybridisation As Predictor For Event Free Survival (EFS) Blood. 2004;104:25a. [Google Scholar]
- 6.Bergsagel PL, Kuehl WM. Critical roles for immunoglobulin translocations and cyclin D dysregulation in multiple myeloma. Immunol Rev. 2003;194:96–104. doi: 10.1034/j.1600-065x.2003.00052.x. [DOI] [PubMed] [Google Scholar]
- 7.Zhan F, Hardin J, Kordsmeier B, et al. Global gene expression profiling of multiple myeloma, monoclonal gammopathy of undetermined significance, and normal bone marrow plasma cells. Blood. 2002;99:1745–1757. doi: 10.1182/blood.v99.5.1745. [DOI] [PubMed] [Google Scholar]
- 8.De Vos J, Thykjaer T, Tarte K, et al. Comparison of gene expression profiling between malignant and normal plasma cells with oligonucleotide arrays. Oncogene. 2002;21:6848–6857. doi: 10.1038/sj.onc.1205868. [DOI] [PubMed] [Google Scholar]
- 9.Tarte K, De Vos J, Thykjaer T, et al. Generation of polyclonal plasmablasts from peripheral blood B cells: a normal counterpart of malignant plasmablasts. Blood. 2002;100:1113–1122. [PubMed] [Google Scholar]
- 10.Tian E, Zhan F, Walker R, et al. The role of the Wnt-signaling antagonist DKK1 in the development of osteolytic lesions in multiple myeloma. N Engl J Med. 2003;349:2483–2494. doi: 10.1056/NEJMoa030847. [DOI] [PubMed] [Google Scholar]
- 11.De Vos J, Couderc G, Tarte K, et al. Identifying intercellular signaling genes expressed in malignant plasma cells by using complementary DNA arrays. Blood. 2001;98:771–780. doi: 10.1182/blood.v98.3.771. [DOI] [PubMed] [Google Scholar]
- 12.Wang YD, De Vos J, Jourdan M, et al. Cooperation between heparin-binding EGF-like growth factor and interleukin-6 in promoting the growth of human myeloma cells. Oncogene. 2002;21:2584–2592. doi: 10.1038/sj.onc.1205355. [DOI] [PubMed] [Google Scholar]
- 13.Mahtouk K, Jourdan M, De Vos J, et al. An inhibitor of the EGF receptor family blocks myeloma cell growth factor activity of HB-EGF and potentiates dexamethasone or anti-IL-6 antibody-induced apoptosis. Blood. 2004;103:1829–1837. doi: 10.1182/blood-2003-05-1510. [DOI] [PMC free article] [PubMed] [Google Scholar]
- 14.Moore PA, Belvedere O, Orr A, et al. BLyS: member of the tumor necrosis factor family and B lymphocyte stimulator. Science. 1999;285:260–263. doi: 10.1126/science.285.5425.260. [DOI] [PubMed] [Google Scholar]
- 15.Schneider P, MacKay F, Steiner V, et al. BAFF, a novel ligand of the tumor necrosis factor family, stimulates B cell growth. J Exp Med. 1999;189:1747–1756. doi: 10.1084/jem.189.11.1747. [DOI] [PMC free article] [PubMed] [Google Scholar]
- 16.Hahne M, Kataoka T, Schroter M, et al. APRIL, a new ligand of the tumor necrosis factor family, stimulates tumor cell growth. J Exp Med. 1998;188:1185–1190. doi: 10.1084/jem.188.6.1185. [DOI] [PMC free article] [PubMed] [Google Scholar]
- 17.Stein JV, Lopez-Fraga M, Elustondo FA, et al. APRIL modulates B and T cell immunity. J Clin Invest. 2002;109:1587–1598. doi: 10.1172/JCI15034. [DOI] [PMC free article] [PubMed] [Google Scholar]
- 18.Mackay F, Schneider P, Rennert P, Browning J. BAFF AND APRIL: A Tutorial on B Cell Survival. Annu Rev Immunol. 2003;21:231–264. doi: 10.1146/annurev.immunol.21.120601.141152. [DOI] [PubMed] [Google Scholar]
- 19.Litinskiy MB, Nardelli B, Hilbert DM, et al. DCs induce CD40-independent immunoglobulin class switching through BLyS and APRIL. Nat Immunol. 2002;3:822–829. doi: 10.1038/ni829. [DOI] [PMC free article] [PubMed] [Google Scholar]
- 20.Mackay F, Browning JL. BAFF: a fundamental survival factor for B cells. Nat Rev Immunol. 2002;2:465–475. doi: 10.1038/nri844. [DOI] [PubMed] [Google Scholar]
- 21.Moreaux J, Legouffe E, Jourdan E, et al. BAFF and APRIL protect myeloma cells from apoptosis induced by interleukin 6 deprivation and dexamethasone. Blood. 2004;103:3148–3157. doi: 10.1182/blood-2003-06-1984. [DOI] [PMC free article] [PubMed] [Google Scholar]
- 22.Novak AJ, Darce JR, Arendt BK, et al. Expression of BCMA, TACI, and BAFF-R in multiple myeloma: a mechanism for growth and survival. Blood. 2003 doi: 10.1182/blood-2003-06-2043. [DOI] [PubMed] [Google Scholar]
- 23.Zhang XG, Gaillard JP, Robillard N, et al. Reproducible obtaining of human myeloma cell lines as a model for tumor stem cell study in human multiple myeloma. Blood. 1994;83:3654–3663. [PubMed] [Google Scholar]
- 24.Tarte K, Fiol G, Rossi JF, Klein B. Extensive characterization of dendritic cells generated in serum-free conditions: regulation of soluble antigen uptake, apoptotic tumor cell phagocytosis, chemotaxis and T cell activation during maturation in vitro. Leukemia. 2000;14:2182–2192. doi: 10.1038/sj.leu.2401925. [DOI] [PubMed] [Google Scholar]
- 25.Mahtouk K, Hose D, Reme T, et al. Expression of EGF-family receptors and amphiregulin in multiple myeloma. Amphiregulin is a growth factor for myeloma cells. Oncogene. 2005 doi: 10.1038/sj.onc.1208536. [DOI] [PMC free article] [PubMed] [Google Scholar]
- 26.Gu ZJ, Vos JD, Rebouissou C, et al. Agonist anti-gp130 transducer monoclonal antibodies are human myeloma cell survival and growth factors. Leukemia. 2000;14:188–197. doi: 10.1038/sj.leu.2401632. [DOI] [PubMed] [Google Scholar]
- 27.Popp S, Jauch A, Schindler D, et al. A strategy for the characterization of minute chromosome rearrangements using multiple color fluorescence in situ hybridization with chromosome-specific DNA libraries and YAC clones. Hum Genet. 1993;92:527–532. doi: 10.1007/BF00420933. [DOI] [PubMed] [Google Scholar]
- 28.Eisen MB, Spellman PT, Brown PO, Botstein D. Cluster analysis and display of genome-wide expression patterns. ProcNatl Acad Sci USA. 1998;95:14863–14868. doi: 10.1073/pnas.95.25.14863. [DOI] [PMC free article] [PubMed] [Google Scholar]
- 29.Landgrebe J, Wurst W, Welzl G. Permutation-validated principal components analysis of microarray data. Genome Biol. 2002;3:RESEARCH0019. doi: 10.1186/gb-2002-3-4-research0019. [DOI] [PMC free article] [PubMed] [Google Scholar]
- 30.Craxton A, Magaletti D, Ryan EJ, Clark EA. Macrophage- and dendritic cell-dependent regulation of human B-cell proliferation requires the TNF family ligand BAFF. Blood. 2003;16:16. doi: 10.1182/blood-2002-10-3123. [DOI] [PubMed] [Google Scholar]
- 31.Gras MP, Laabi Y, Linares-Cruz G, et al. BCMAp: an integral membrane protein in the Golgi apparatus of human mature B lymphocytes. Int Immunol. 1995;7:1093–1106. doi: 10.1093/intimm/7.7.1093. [DOI] [PubMed] [Google Scholar]
- 32.Santra M, Zhan F, Tian E, Barlogie B, Shaughnessy J., Jr A subset of multiple myeloma harboring the t(4;14)(p16;q32) translocation lacks FGFR3 expression but maintains an IGH/MMSET fusion transcript. Blood. 2003;101:2374–2376. doi: 10.1182/blood-2002-09-2801. [DOI] [PubMed] [Google Scholar]
- 33.Shaughnessy J, Jacobson J, Sawyer J, et al. Continuous absence of metaphase-defined cytogenetic abnormalities, especially of chromosome 13 and hypodiploidy, ensures long-term survival in multiple myeloma treated with Total Therapy I: interpretation in the context of global gene expression. Blood. 2003;101:3849–3856. doi: 10.1182/blood-2002-09-2873. [DOI] [PubMed] [Google Scholar]
- 34.Derksen PW, Keehnen RM, Evers LM, van Oers MH, Spaargaren M, Pals ST. Cell surface proteoglycan syndecan-1 mediates hepatocyte growth factor binding and promotes Met signaling in multiple myeloma. Blood. 2002;99:1405–1410. doi: 10.1182/blood.v99.4.1405. [DOI] [PubMed] [Google Scholar]
- 35.Chauhan D, Uchiyama H, Akbarali Y, et al. Multiple myeloma cell adhesion-induced interleukin-6 expression in bone marrow stromal cells involves activation of NF-kappa B. Blood. 1996;87:1104–1112. [PubMed] [Google Scholar]
- 36.Yaccoby S, Wezeman MJ, Henderson A, et al. Cancer and the microenvironment: myeloma-osteoclast interactions as a model. Cancer Res. 2004;64:2016–2023. doi: 10.1158/0008-5472.can-03-1131. [DOI] [PubMed] [Google Scholar]
- 37.Yaccoby S, Barlogie B, Epstein J. Primary myeloma cells growing in SCID-hu mice: a model for studying the biology and treatment of myeloma and its manifestations. Blood. 1998;92:2908–2913. [PubMed] [Google Scholar]
- 38.Yata K, Yaccoby S. The SCID-rab model: a novel in vivo system for primary human myeloma demonstrating growth of CD138-expressing malignant cells. Leukemia. 2004;18:1891–1897. doi: 10.1038/sj.leu.2403513. [DOI] [PubMed] [Google Scholar]
- 39.Klein B, Zhang XG, Jourdan M, et al. Paracrine rather than autocrine regulation of myeloma-cell growth and differentiation by interleukin-6. Blood. 1989;73:517–526. [PubMed] [Google Scholar]
- 40.Kawano M, Hirano T, Matsuda T, et al. Autocrine generation and requirement of BSF-2/IL-6 for human multiple myelomas. Nature. 1988;332:83–85. doi: 10.1038/332083a0. [DOI] [PubMed] [Google Scholar]
- 41.Hata H, Xiao H, Petrucci MT, Woodliff J, Chang R, Epstein J. Interleukin-6 gene expression in multiple myeloma: a characteristic of immature tumor cells. Blood. 1993;81:3357–3364. [PubMed] [Google Scholar]
- 42.Klein B, Zhang XG, Lu ZY, Bataille R. Interleukin-6 in human multiple myeloma. Blood. 1995;85:863–872. [PubMed] [Google Scholar]
- 43.O’Connor BP, Raman VS, Erickson LD, et al. BCMA is essential for the survival of long-lived bone marrow plasma cells. J Exp Med. 2004;199:91–98. doi: 10.1084/jem.20031330. [DOI] [PMC free article] [PubMed] [Google Scholar]
- 44.Kotenko SV, Izotova LS, Mirochnitchenko OV, et al. Identification of the functional interleukin-22 (IL-22) receptor complex: the IL-10R2 chain (IL-10Rbeta) is a common chain of both the IL-10 and IL-22 (IL-10-related T cell-derived inducible factor, IL-TIF) receptor complexes. J Biol Chem. 2001;276:2725–2732. doi: 10.1074/jbc.M007837200. [DOI] [PubMed] [Google Scholar]
- 45.Gu ZJ, Costes V, Lu ZY, et al. Interleukin-10 is a growth factor for human myeloma cells by induction of an oncostatin M autocrine loop. Blood. 1996;88:3972–3986. [PubMed] [Google Scholar]
- 46.Ardjomand N, Schaffler G, Radner H, El-Shabrawi Y. Expression of somatostatin receptors in uveal melanomas. Invest Ophthalmol Vis Sci. 2003;44:980–987. doi: 10.1167/iovs.02-0481. [DOI] [PubMed] [Google Scholar]
- 47.Zatelli MC, Tagliati F, Taylor JE, Rossi R, Culler MD, degli Uberti EC. Somatostatin receptor subtypes 2 and 5 differentially affect proliferation in vitro of the human medullary thyroid carcinoma cell line tt. J Clin Endocrinol Metab. 2001;86:2161–2169. doi: 10.1210/jcem.86.5.7489. [DOI] [PubMed] [Google Scholar]
- 48.Georgii-Hemming P, Stromberg T, Janson ET, Stridsberg M, Wiklund HJ, Nilsson K. The somatostatin analog octreotide inhibits growth of interleukin-6 (IL-6)-dependent and IL-6-independent human multiple myeloma cell lines. Blood. 1999;93:1724–1731. [PubMed] [Google Scholar]
- 49.Wagener C, Ergun S. Angiogenic properties of the carcinoembryonic antigen-related cell adhesion molecule 1. Exp Cell Res. 2000;261:19–24. doi: 10.1006/excr.2000.5038. [DOI] [PubMed] [Google Scholar]
- 50.Dodelet VC, Pasquale EB. Eph receptors and ephrin ligands: embryogenesis to tumorigenesis. Oncogene. 2000;19:5614–5619. doi: 10.1038/sj.onc.1203856. [DOI] [PubMed] [Google Scholar]
- 51.Noren NK, Lu M, Freeman AL, Koolpe M, Pasquale EB. Interplay between EphB4 on tumor cells and vascular ephrin-B2 regulates tumor growth. Proc Natl Acad Sci USA. 2004;101:5583–5588. doi: 10.1073/pnas.0401381101. [DOI] [PMC free article] [PubMed] [Google Scholar]
- 52.Li Q, Park PW, Wilson CL, Parks WC. Matrilysin shedding of syndecan-1 regulates chemokine mobilization and transepithelial efflux of neutrophils in acute lung injury. Cell. 2002;111:635–646. doi: 10.1016/s0092-8674(02)01079-6. [DOI] [PubMed] [Google Scholar]
- 53.Klein B, Li XY, Lu ZY, et al. Activation molecules on human myeloma cells. Curr Top Microbiol Immunol. 1999;246:335–341. doi: 10.1007/978-3-642-60162-0_41. [DOI] [PubMed] [Google Scholar]
- 54.Tarte K, Zhan F, De Vos J, Klein B, Shaughnessy J., Jr Gene expression profiling of plasma cells and plasmablasts: toward a better understanding of the late stages of B-cell differentiation. Blood. 2003;102:592–600. doi: 10.1182/blood-2002-10-3161. [DOI] [PubMed] [Google Scholar]
- 55.Hatzoglou A, Roussel J, Bourgeade MF, et al. TNF receptor family member BCMA (B cell maturation) associates with TNF receptor-associated factor (TRAF) 1, TRAF2, and TRAF3 and activates NF- kappa B, elk-1, c-Jun N-terminal kinase, and p38 mitogen-activated protein kinase. J Immunol. 2000;165:1322–1330. doi: 10.4049/jimmunol.165.3.1322. [DOI] [PubMed] [Google Scholar]
- 56.Negri S, Oberson A, Steinmann M, et al. cDNA cloning and mapping of a novel islet-brain/JNK-interacting protein. Genomics. 2000;64:324–330. doi: 10.1006/geno.2000.6129. [DOI] [PubMed] [Google Scholar]
- 57.Yasuda J, Whitmarsh AJ, Cavanagh J, Sharma M, Davis RJ. The JIP group of mitogen-activated protein kinase scaffold proteins. Mol Cell Biol. 1999;19:7245–7254. doi: 10.1128/mcb.19.10.7245. [DOI] [PMC free article] [PubMed] [Google Scholar]
- 58.Hideshima T, Akiyama M, Hayashi T, et al. Targeting p38 MAPK inhibits multiple myeloma cell growth in the bone marrow milieu. Blood. 2003;101:703–705. doi: 10.1182/blood-2002-06-1874. [DOI] [PubMed] [Google Scholar]
- 59.Chantry D, Vojtek A, Kashishian A, et al. pi 110delta, a novel phosphatidylinositol 3-kinase catalytic subunit that associates with p85 and is expressed predominantly in leukocytes. J Biol Chem. 1997;272:19236–19241. doi: 10.1074/jbc.272.31.19236. [DOI] [PubMed] [Google Scholar]
- 60.Claudio E, Brown K, Park S, Wang H, Siebenlist U. BAFF-induced NEMO-independent processing of NF-kappa B2 in maturing B cells. Nat Immunol. 2002;3:958–965. doi: 10.1038/ni842. [DOI] [PubMed] [Google Scholar]
- 61.Draetta G, Piwnica-Worms H, Morrison D, Druker B, Roberts T, Beach D. Human cdc2 protein kinase is a major cell-cycle regulated tyrosine kinase substrate. Nature. 1988;336:738–744. doi: 10.1038/336738a0. [DOI] [PubMed] [Google Scholar]
- 62.Serra M, Reverter-Branchat G, Maurici D, et al. Analysis of dihydrofolate reductase and reduced folate carrier gene status in relation to methotrexate resistance in osteosarcoma cells. Ann Oncol. 2004;15:151–160. doi: 10.1093/annonc/mdh004. [DOI] [PubMed] [Google Scholar]
- 63.Wang TL, Diaz LA, Jr, Romans K, et al. Digital karyotyping identifies thymidylate synthase amplification as a mechanism of resistance to 5-fluorouracil in metastatic colorectal cancer patients. Proc Natl Acad Sci USA. 2004;101:3089–3094. doi: 10.1073/pnas.0308716101. [DOI] [PMC free article] [PubMed] [Google Scholar]
- 64.Silvestris F, Cafforio P, Tucci M, Grinello D, Dammacco F. Upregulation of osteoblast apoptosis by malignant plasma cells: a role in myeloma bone disease. Br J Haematol. 2003;122:39–52. doi: 10.1046/j.1365-2141.2003.04374.x. [DOI] [PubMed] [Google Scholar]
- 65.Hideshima T, Richardson PG, Anderson KC. Targeting proteasome inhibition in hematologic malignancies. Rev Clin Exp Hematol. 2003;7:191–204. [PubMed] [Google Scholar]
- 66.Borset M, Seidel C, Hjorth-Hansen H, Waage A, Sundan A. The role of hepatocyte growth factor and its receptor c-Met in multiple myeloma and other blood malignancies. Leuk Lymphoma. 1999;32:249–256. doi: 10.3109/10428199909167385. [DOI] [PubMed] [Google Scholar]
- 67.Derksen PW, de Goiter DJ, Meijer HP, et al. The hepatocyte growth factor/Met pathway controls proliferation and apoptosis in multiple myeloma. Leukemia. 2003;17:764–774. doi: 10.1038/sj.leu.2402875. [DOI] [PubMed] [Google Scholar]
- 68.Hov H, Holt RU, Ro TB, et al. A selective c-met inhibitor blocks an autocrine hepatocyte growth factor growth loop in ANBL-6 cells and prevents migration and adhesion of myeloma cells. Clin Cancer Res. 2004;10:6686–6694. doi: 10.1158/1078-0432.CCR-04-0874. [DOI] [PubMed] [Google Scholar]