

Abstract
There is an increasing need for new methods and tools that support knowledge construction from complex geospatial datasets related to public health. This study is part of a larger effort to develop, implement, and test such methods and tools. To be successful, the design of methods and tools must be grounded in a solid understanding of the work practices within the domain of use; the research reported here focuses on developing that understanding. We adopted a user-centered approach to toolset design where we investigated the work of cancer researchers and used the results of that investigation as inputs into the development of design guidelines for new geovisualization and spatial analysis tools. Specifically, we conducted key informant interviews focused on use, or potential use, of geographic information, methods, and tools and complemented this with a systematic analysis of published, peer-reviewed articles on geospatial cancer research. Results were used to characterize the typical process of analysis, to identify fundamental differences between intensive users of geospatial methods and infrequent users, and to outline key stages in analysis and tasks within the stages that methods and tools must support. Our findings inform design and implementation decisions for visual and analytic tools that support cancer prevention and control research and they provide insight into the processes used by cancer researchers for addressing the challenges of geographic factors in public health research and policy.
Keywords: cancer, GIS, mapping, spatial analysis, research practices, toolset design
1. Introduction
Over the past decade, the availability of geographically-referenced data for cancer prevention and control has increased dramatically. The National Cancer Institute (NCI) supports a program of research focused on utilizing this growing resource to address geographic aspects of cancer in the U.S. (NCI, 2007). Within this program, one of the challenges is the development of new methods of exploratory spatial data analysis (ESDA) to support construction of knowledge from increasingly complex datasets. The research we report on here is one component of a larger project directed to this challenge (GeoVISTA Center, 2007).
The long-term goal of our research is to develop, implement, and evaluate methods and tools for visualizing and analyzing geospatial health data, and thereby enhance public health research and policy development. Although geospatial tools are currently used by some public health researchers and their potential benefits have been recognized through focused research programs by both the National Cancer Institute and the Centers for Disease Control, geospatial tools remain underutilized in this domain. This may in part be due to accessibility barriers related to the difficulty that researchers have in finding the time to learn how to integrate geospatial methods with other methodologies they traditionally employ in an already time-constrained environment. Hence, a wider deployment of geospatial tools is only likely to occur when the tools can be easily integrated into health researchers’ current work practices.
To address the goal of designing more accessible and therefore more useable geospatial tools for public health researchers, we have adopted a user-centered systems approach that places a primary and early emphasis upon potential users of the methods and tools. Our current research has targeted cancer prevention and control, but our findings may also be applicable to other domains of public health.
While there has been an increase in the number and utilization of tools for multivariate analysis of geospatial health data, limited attention has been given to understanding the methods by which health researchers utilize the tools or analyze the data; for exceptions see: Exeter (1999), Griffin (2004), Robinson (2005), and Seo and Shneiderman (2006). The research reported here addresses this gap by focusing on the methods, tools and logic used by health researchers, primarily epidemiologists. We used two methods to gather information. To develop an understanding of the processes of and methods for exploration and analysis of geospatial data, we first conducted in-depth interviews with cancer control and prevention researchers. To supplement the interviews, we also conducted a systematic analysis of peer-reviewed literature in health-related journals for which geographic information and tools were involved. We used a rigorous coding scheme to extract information from the published papers and systematic qualitative data analysis methods to develop generalizations from the interviews. We then used these two perspectives to develop a conceptual approach to support future application of a user-centered design approach to development of methods and tools for analysis of geospatial health data.
2. Background
Research into geospatial aspects of disease can be divided into three general areas. The first, disease mapping, is usually traced to John Snow’s map of cholera in London (Snow, 1855). Disease mapping research has generally employed simple maps to illustrate geographic variation in disease occurrence; occasionally spatial analyses and inferential statistics are also incorporated. This research sometimes begins with an hypothesis and focuses upon its visual representation; in other cases maps are used to prompt hypothesis generation (Clayton and Kaldor, 1987; Cliff and Haggett, 1988; Marshall, 1991; Getis and Ord, 1992; Cressie, 1992; Cliff et al., 1993; Langford, 1994; Rushton and Lolonis, 1996; Langford et al., 1999; Pickle et al., 1999; Cliff et al., 2000). Within this approach, researchers have also discussed the limitations of mapping rare diseases and suggested alternative methods to address these limitations (Lawson and Williams, 2001; MacNab, 2003; Jarup et al., 2002; Thomas and Carlin, 2003). Additionally, a number of mapping packages have been designed specifically for the public health domain, including EpiInfo/EpiMap, HealthMapper, SIGEpi, DispmapWin, and DMAP (Martínez-Piedra et al., 2004).
A second focus of geospatial research has been on statistical and computational methods used to identify spatial patterns and to measure the relationship between disease and potential covariates. This research is frequently used to generate hypotheses about disease etiology. Among the most significant methodological developments in this area are Openshaw’s Geographical Analysis Machine (GAM) and its successors (Openshaw et al., 1988a; Openshaw et al., 1988b; Openshaw, 1995), Kulldorff’s Spatial Scan Statistic (Kulldorff and Nagarwalla 1995; Kulldorff, 1997), which builds upon the core approach of GAM, and Geographically Weighted Regression (GWR) (Brunsdon et al. 1998). Both GAM and the spatial scan statistic have been applied to detecting cancer clusters. All of these methods have directed attention to exploratory health analysis and have been a prompt for other advances in analytical methods. The use of the analytical capabilities of geographic information systems (GIS) in investigating geographic factors has also made an important contribution to the study of disease (Croner et al., 1996; Gordon and Womersly, 1997; Gatrell and Loytonen, 1998; Cromley and McLafferty, 2002; Rushton, 2003).
The third focus of geospatial disease research is the development and application of exploratory spatial data analysis (ESDA) methods (Anselin, 1994) that can help researchers uncover complex relationships between disease and covariates, and which are specifically graphically- rather than computationally-driven. Rather than addressing a specific analytic question (e.g., such as how to measure whether or not a spatial cluster is significant), ESDA enables innovative thinking and helps to generate new hypotheses. ESDA methods typically link multiple visual display types, such as maps and statistical graphics (Edsall, 2003a, 2003b; Anselin et al., 2006) or linked small multiple representations (Carr et al., 2000; Carr et al., 2005). Extensions of ESDA techniques into the spatio-temporal realm have been developed and applied to health data analysis by AvRuskin et al. (2004) and Jacquez et al. (2005).
The potential to uncover complex relationships between geographically-varying risk factors and disease has increased during the past decade because both the volume of geospatial data and sophistication of available analytical tools have increased dramatically. Indeed, medical geographers and spatial analysts have found many meaningful relationships between geography (location) and disease (e.g., Cressie (1992); Rushton and Lolonis (1996); Kulldorff (1998); Gatrell and Loytonen (1998); Cromley and McLafferty (2002)). However, a clear understanding of the current approaches that health researchers (and particularly, cancer researchers) take to using analytical tools has not been articulated. Such an understanding is critical to successful design of new tools because researchers are more likely to try new methods and approaches if they can clearly see how the new tools can both improve and be integrated into their current research practices and are convinced that the tools have the potential to lead to answers to questions that they identify as important.
In the following section, we discuss the user-centered design process we have adopted to support the development of such tools. More specifically, we outline how the process guides the design and implementation of a comprehensive visual-analytical, geospatially-capable tool set to support epidemiological research.
3. Implementing a User-Centered Design Framework for Building Geospatial Tools for Cancer Control and Prevention
The research reported here aims to provide a base of knowledge to inform the design and implementation of visual and analytic tools that can effectively support cancer prevention and control activities. In so doing, it provides insight into the challenges faced by researchers as they consider geographic factors in cancer prevention and control, including surveillance, epidemiology, programs and policy (NRC, 2006). To achieve this, we are employing a user-centered design-based conceptual framework to building tools. The work reported here, of course, does not answer all relevant questions about tool design. But, it provides an evidence-based framework for pursuing these answers and it results in a robust, high-level framework to guide tool design.
As a relatively new approach to the design of computer applications, user-centered design (UCD) has attracted much attention in the software design community (Maguire, 2001; Davies and Medyckyj-Scott, 1996; Davies, 1998; Carroll, 2000; Jankowski and Nyerges, 2001; Fischer and Sullivan, 2002). Maguire (2001) characterized the end result of a successful UCD process as a usable system, specifically a system that increases productivity, reduces errors, training and support costs, and increases acceptance among users. To achieve this objective, a core principle in UCD is the early involvement of potential users and an iterative cycle of interaction between users and designers so that resulting tools match both needs and practice. In this work with users, a UCD tool development strategy focuses on the tasks of using the software and considers all of the factors - physical, cognitive, social, and cultural - that influence a user’s interaction with the software. The process of UCD, then, includes a task or requirements analysis, conceptual modeling of the domain knowledge for which the software will be used, the design of the system, its implementation, and iterative refinement.
Robinson et al. (2005) described the user-centered design process as an iterative, six-step process (Figure 1). His description of the process begins with a work domain analysis in which the software developer gathers information on the users’ requirements. In the second step, conceptual development, the developer translates what s/he learned from the work domain analysis into a description of the features that need to be implemented in the software. The final four steps follow from the first two steps, where the features are developed, initial usability analysis is conducted, the tools are implemented, and finally software debugging and revision is carried out once problems with the features and design of the software have been identified.
Figure 1.

Robinson et al.’s (2005) user-centered design process.
The research we report here is one component of a broader program of research directed to creating a geospatially-enabled toolkit for cancer prevention and control researchers. Each component within this program is designed to provide a contrast with the others, working with a range of data collection techniques that provide a number of vantage points onto how cancer prevention and control researchers work with current and potential future geospatial tools. This approach is similar to a dialectical approach to resolving disputes over knowledge claims in which contrasting pieces of evidence are set against each other to either 1) accept one of the claims as valid or 2) synthesize a third claim that resolves inconsistency between the two original claims (Hemingway and Gough, 2000). Each of our component studies, then, is directed to developing the competing claims about the nature of users’ interactions with geospatial methods that are an input to the dialectical process. Moreover, within this research, which constitutes steps 1 and 2 in Robinson et al.’s (2005) UCD process, we draw upon a multiple-method approach that produces a synthetic claim about how cancer prevention and control researchers currently work with geospatial tools (see section 4 for a detailed description of the methodology we employed and section 6 for the synthetic claim we present).
The specific focus of the research we report here, is to develop an understanding of the processes of data exploration and analysis that cancer prevention and control researchers undertake and the actual or potential roles that geospatial methods and tools can play in that process. In other words, a key goal of this paper is to provide an evidence-based framework for geospatial tool design by documenting the analytical behaviors that health researchers adopt when working with geospatial data. The evidence we collected includes information on both the generic ways in which cancer researchers go about carrying out their work tasks as well as the specific environments (software, data and organizational) in which they currently work.
In the work reported here, we focused particularly on determining the kinds of analysis questions cancer researchers pose that geospatial data and analytical tools are relevant for, the strategies they employ in their analyses, the tools they currently use along with the limitations of these tools, and other factors that may influence both the researchers’ adoption of new tools and the tools’ success in supporting new analytical insights (e.g., the ways in which their disciplinary training might affect their propensity and/or current ability to use geospatial tools effectively in their work practice). To acquire this information, we used in-depth interviews with key informants. However, interviews alone, no matter how in-depth, provide only a partial perspective on any knowledge or task domain. Therefore, we balanced the information on work practices obtained through the interviews with a systematic analysis of end results of research as they appear in scientific literature. This multi-method approach also helps to address the limitations of each method when used in isolation. We describe the methods we used for both types of analysis in the next section.
4. Methods
We carried out our data collection in two phases: key-informant interviews and systematic analysis of published scientific literature. Each is outlined below.
4.1. Interviews with cancer researchers
In the first phase, we used semi-structured telephone interviews with cancer researchers to characterize the methods they commonly use for analyzing geospatial data. We sought information on: sources and types of geospatial data; methods of data exploration and analysis; types of research questions (e.g., hypothesis generation or hypothesis testing); and perceived usefulness of various visual and analytic methods and tools. We developed the interview questions by drawing on two techniques: focused discussion and the ACT1-based representation of knowledge (ARK2) technique (Cooke, 1994). We developed and pilot-tested the interview script following guidelines from Dillman (1978). The Institutional Review Board of The Pennsylvania State University approved this study.
We used a purposeful sampling strategy to identify potential candidates for the interviews. The goal of this sampling strategy was to identify respondents who represent a wide spectrum of potential (and actual) geospatial tool users (i.e., those who do and do not currently use geospatial data and tools in their research) within the population of researchers whose work is focused on cancer prevention and control. The population we are designing tools to support does not include researchers who focus on cancer control solely at the molecular level (e.g., biomedical researchers who are testing the efficacy of particular drugs for fighting a particular type of cancer), but does include those researchers whose work may focus on questions of access to cancer screening or treatments and researchers whose work aims to elucidate the etiology of a particular type of cancer. We aimed to include both individuals who currently use GIS extensively in their research and individuals with little or no actual experience with GIS in our sample. This diversity was a conscious choice, made to provide us with evidence to help us to understand both the limitations of geospatial tools for current users as well as barriers to use and potential transition paths for non-users.
We began the process of soliciting participants by asking our large set of professional contacts (in the Appalachia Cancer Network, the National Cancer Institute, and elsewhere) to help us identify a pool of potential interview candidates comprised of cancer epidemiology researchers in senior positions at universities and cancer research centers. We asked our contacts to identify individuals whose work could either provide rich examples of experience with geospatial information and methods within cancer prevention and control research or whose work in this domain that could benefit from using geospatial data. We also asked contacts to help us identify additional individuals who could provide additional contact information for other potentially appropriate participants (i.e., we used a snowball recruitment technique (Patton, 2002)). This process yielded a pool of 68 potential interview candidates. We narrowed the pool of candidates to a balanced group of 20 individuals representing varying academic backgrounds, levels of experience in cancer research, and likely experience in using geospatial methods and tools. These 20 individuals were mailed an invitation to participate in the study. The process yielded 16 researchers who agreed to participate; one member of the research team conducted these interviews in late 2003. Upon verbal consent, we conducted and audio-taped the interviews. As explained more completely below, we subsequently transcribed the tapes and analyzed them using a systematic reflexive data summary technique; we extracted quotes to highlight particularly salient points.
Although our interviews incorporated a few future-oriented questions (e.g., “We’d like to identify ways that GIS and spatial data analysis tools currently prove useful OR might prove useful in the future. Please rate how useful you think spatial data analysis is for each of the following items.”), the questions we asked and responses we received focus on information about the current state of work practices that involve geospatial tools rather than ‘what might be’. This was a deliberate choice on our part, as we had previously seen anecdotal evidence that one barrier to more widespread adoption of geospatial tools by public health professionals might relate to the difficulty that researchers have in easily integrating geospatial tools into traditional epidemiological work-flows (see section 5.3.3 for evidence of this problem in the results of this research).
Like any method that involves collecting self-reports, there are limitations to relying solely on interview responses. For example, individuals are generally better at giving a report of what they do than of their rationale for why they have done something (Nesbitt and Wilson, 1977). Interview respondents may also provide distorted information (i.e., inaccurate or incomplete information) due to a desire to please the interviewer, embarrassment, nervousness, recall error or selective perceptions. For this reason, we decided to supplement the interview results with a systematic analysis of scientific literature that used geospatial tools for cancer prevention and control research.
4.2. Analysis of scientific literature
In the second phase of the research, we conducted a systematic analysis to characterize the content of published scientific literature that reported a geospatial analysis of factors related to cancer prevention and control. We searched the Medline® and Web of Science® databases for manuscripts published between 2001 and 2003 with keywords in both 1) geospatial analysis, and 2) cancer epidemiology. The geospatial analysis MeSH search terms were: small-area analysis, space-time clustering, geography, spatial analysis, or spatio-temporal analysis; the cancer epidemiology MeSH search terms were: neoplasm, mortality, prevention and control, epidemiology, etiology, or risk factors. These two searches yielded 317 unique articles; this was reduced to 102 articles by eliminating non-English publications, and those that were not focused upon human cancers, did not refer to geospatial information, or did not contain results of original data analysis. We randomly selected 50% of the 102 articles (n = 51) for analysis.
Each of the 51 articles was assigned to one of four teams that were each composed of one epidemiologist and one geographic information scientist (GIScientist). The epidemiologist and GIScientist then independently coded the article according to an initial coding scheme. The initial scheme (Appendix 1) was finalized after coding eight articles. During the coding process, we determined that six additional articles did not include an original report of human cancer and geospatial analysis. Thus, our final sample included 45 articles. We assessed inter-rater reliability (IRR) using the percent-agreement method, which is generally considered acceptable when greater than 70% (Stemler, 2004). The overall IRR was 88%, which we can consider to be high.
Some limitations of systematic scientific literature analysis include: not all research results appear in the scientific record (i.e., some research results may be published only in technical reports or white papers); researchers do not commonly report research that does not produce positive results; and written reports often do not provide information on all parts of the research process, but rather focus more on the analytic rather than exploratory methods that researchers employ. In addition, researchers seldom include reasons for not doing analysis, thus it would be impractical to determine from published papers whether researchers omitted geographic analysis because they were unfamiliar with the methods or did not have access to appropriate software, they specifically considered geographic analysis to be irrelevant to the question at hand, or they did not even think of the possibility. Taken together, these limitations mean that some use of geospatial tools for cancer prevention and control research, and some reasons for not using such tools, may be missed when relying solely upon published literature analysis.
To thereby provide a more comprehensive picture of the current use of geospatial tools for cancer prevention and control, we used data from both the interviews and the publication analysis to help develop our conceptualization of the cancer researchers’ current approaches to geospatial analysis of cancer data. We analyzed our data by generating frequencies, percentages, and summary tables and by identifying salient quotes from the interviews. Using these results, we then constructed flow charts that visualize the analytic process and to help interpret our results.
5. Results and Discussion
In this section, we report our results, beginning with the interview data. Then, within each sub-section, we supplement these findings with results of the publication analysis. We begin by briefly reporting interview participant characteristics. Then we focus upon the results from questions about the process of, strategies for, and data utilized in exploration and analysis. These results are presented in five subsections focused on: data analysis tasks and methods, the research process, spatial analysis and GIS, data types, and visual data representation.
For practical reasons, we group results into categories for clarity and we provide numerical summaries to allow readers to assess the strength of evidence. However, it is important to recognize that the evidence provided is based not on simple responses to a questionnaire with fixed objective questions, but on in-depth interviews and systematic qualitative data analysis that allow rich insights to be derived from a relatively small number of expert participants complemented by findings from the analysis of publications. The specific findings and insights derived from this analysis are used directly to construct the graphic research process models that are a key outcome of the research (and presented in section 6).
5.1 Background of interview participants
Most interview participants (n = 11; 69%) were academics in universities and institutes: professors (n = 4), associate professors (n = 4), assistant professors (n = 3), and senior administrators in research institutes (n = 3), but we also interviewed one research associate and one staff epidemiologist from a non-profit cancer hospital whose mission includes both clinical care and research. The interview participants included six females and ten males, 14 Caucasians, one Hispanic and one Asian. The participants included individuals with a wide range of backgrounds. Our sample included researchers with training in medicine (i.e., M.D.s) as well as researchers with advanced degrees in public health, statistics, information science, health education, epidemiology, psychology, biology and demography. Many of the researchers had training in multiple areas. The length of experience in their current position averaged 9.2 years but varied greatly (range: 1 - 30 years). Some of the participants were involved in health-related work prior to working in their current position. In other cases, participants entered the field of cancer research relatively recently, having completed their basic training in some other field. Based on the above, we believe that our participant solicitation strategy (described in section 4.1) has resulted in a diversity of participants that is representative of the target audience that the analytical methods and tools that we are developing are intended to support.
5.2 Cancer research specialization
Among the 16 interviewees, most (n = 13; 82%) work exclusively or partially in the field of cancer research. Among those 13, all reported working on more than one cancer site. Of the sites these researchers focused upon, breast cancer was a focus for the largest group of participants (n = 8; 63%), followed by colon-rectum (n = 5; 38%) and prostate (n = 3; 23%).
Most of the researchers working on cancer (n = 8; 63%) indicated that their research addressed both exogenous (e.g., environment, occupational exposures, lifestyle) and endogenous (e.g., gene composition, hormonal dysfunction) factors. Two researchers focus exclusively on exogenous factors and four on endogenous factors. Beyond these foci, most of the interviewees (n = 9; 69%) were involved with research directed to outreach for cancer prevention and control.
The publication analysis results provided further details of the different kinds of cancer research that are being conducted (section IRR: 78.8%). Thirty-one (69%) of the articles were focused upon a specific cancer site. The remaining papers reported research on multiple cancer sites. Among the different potential cancer sites, female breast cancer was the most frequently studied (n = 10; 22%), followed by the “other” category (n = 9; 20%)3. Other common cancer sites included colon and rectum, bronchus-lung, and prostate.
5.3 Data exploration and analysis
A focus of method and tool development in information visualization, exploratory data analysis (EDA), exploratory spatial data analysis (ESDA), and geovisualization is to provide support for data exploration, a key part of the scientific process that traditional analysis and visual display methods were not designed to support (Andrienko et al., 2005). Typical goals of data exploration are to uncover unexpected aspects of a dataset (patterns, relationships, trends, etc.) and to prompt hypotheses about them.
When compared to the history of the development of analytic methods, the history of the development of methods for data exploration is short. As a result, we have a limited understanding of how visual and statistical methods targeted at exploration are used by domain specialists. A key goal in this research, therefore, was to gather information to provide input toward this understanding. Specifically, we wanted to develop a basic understanding of the processes of data exploration and analysis that researchers undertake and the actual or potential roles that geospatial methods and tools can play in that process. We directed particular attention to identifying the typical task sequence for exploring and analyzing data; the kinds of questions for which spatial data exploration/analysis methods are (or might be) useful; and the methods, tools, or features that are missing from current software and that impede the data exploration and analysis process.
Our interview script did not ask directly about “exploration and analysis”, since we did not want to bias participants toward adopting this categorization of steps of the scientific process. Responses to the interview prompts, however, made it easy to identify exploration and analysis as separate but linked parts of the process used by most participants. As a result, we summarize results separately below. Articles published in peer-reviewed journals clearly focused more upon analysis and results than upon the exploration part of research. Exploration, while often a critical step, is typically a private aspect of the individual researcher’s research process that is infrequently reported in published literature. But, we also coded specifically for references to exploration and analysis in publication, and this coding was also useful in separating analysis from exploration and identifying methods and tools appropriate to each. We can see clear evidence of the more private nature of exploration in the overall research process when we compare results from the interviews and the publication analysis.
5.3.1 The research process
To understand the research process, we began by asking the participants about testing and generating hypotheses. Most participants (n = 12; 75%) said they both generate and test hypotheses, while 25% (two each of the 16 participants) specified that their research focused upon just one of these steps.
To understand the methods of exploration, we asked questions about the primary tasks in typical data exploration and analysis (Appendix 2). The interview script prompted participants to discuss tasks in the order they usually completed them.
We have summarized these results in Figure 2, which contains information synthesized from all of our interview participants. One key finding from our analysis is that most researchers categorize the research process into three broad stages (that are typically carried out sequentially) and that each contains a series of tasks: (1) pre-analysis problem framing and exploration; (2) analytical exploration; (3) result confirmation, testing and presentation.
Figure 2.

Modeling health researchers’ thinking processes. This figure shows that most cancer control and prevention researchers conceptualize their work as being composed of stages. We describe these typical, conceptually separable stages as pre-analysis problem framing and exploration; analytical exploration and hypothesis formation; and confirmation, testing and presentation.
In the pre-analysis problem framing and exploration stage, researchers suggested that they set bounds on and contextualize the research they are planning to carry out as well as organize and evaluate data for its suitability to address their general research question. In the analytical exploration stage, researchers explore the structure of their data and search for explanations for this structure. In the final stage, result confirmation, testing and presentation, researchers contextualize their results and disseminate them to other interested parties through publications and other forms of communication. It is important to note that this process is typically iterative across research projects, with the results of one analysis or the testing of results within the broader context guiding the problem definition stage in subsequent research projects.
While three stages are typical and the stages defined above reflect the interviews and literature analysis carried out, the ordering of tasks within stages varies among individuals as well as within individuals as their research goals change. The typical research sequence reported was to study a new data set, then consult the literature for discussion of potentially relevant information about patterns and relationships seen, then return to analyzing the data in greater depth. An alternative was to start with a hypothesis based on past research and/or related literature, then test the hypothesis and explore evidence that counters that hypothesis. We discuss individual differences in researchers’ thinking processes in more detail below (section 6.1), in conjunction with a conceptual model of their data analysis process and the methods, software packages, and different types of data and data displays they employed.
It is important to recognize these results, while derived from the combined evidence of interviews and published papers, are based on self-reporting. This self-reporting (as in science generally) requires researchers to summarize and generalize a complex and variable process that, while conceptualized as a sequence of tasks, may not be as systematic as subsequent reports (either verbal or written) imply that it is. One particular limitation of the interview method is that important aspects of the research process will be left out of responses because they are considered too obvious to mention, outside the scope of discussion, or are simply not remembered at the time. For example, only 10 out of 16 people (63%) mentioned writing up the results in the form of papers or reports. It is likely that the other five participants also report on their findings in written form, but either did not consider this step a part of the research process we were asking about or treated this step as implicit in the research.
A majority of the articles we coded in the publication analysis reported hypothesis testing (n = 29; 64%), while a substantial proportion (n = 20; 44%) reported generation of new hypotheses from the analysis carried out for the publication (section IRR: 79.3%). A smaller subset (n = 10; 22%) tested and developed methods. A number of articles utilized multiple types of analysis: both hypothesis generation and testing (n = 6; 13%); or hypothesis generation and methods testing (n = 2; 4%); or hypothesis testing and methods testing (n = 6; 13%).
5.3.2 Data analysis tasks and methods
The most common analysis tasks were basic ones, such as cleaning datasets and making graphs and charts (undertaken regularly by 75% and 87.5% of participants, respectively; Table 1). Participants often performed result reliability tests; nearly two thirds of participants regularly generate confidence intervals and most of the rest do so occasionally, and most participants generate odds ratios, trend analysis, and survival models at least occasionally. More complex spatial analysis functions and methods were used less frequently, but at least half of participants reported occasional use of all of the methods asked about (with the exception of cluster analysis, which was reported by 43.75% of participants). About one-third of participants reported geocoding, map creation, and GIS-based spatial analysis as regular activities.
Table 1.
Prevalence of analysis tasks undertaken by interview participants.
| Participants’ Frequency of Data Analysis Methods Use (%) | |||
|---|---|---|---|
| Basic Methods | Regularly | Occasionally | Not at all |
| Making graphs or charts | 87.5 | 6.3 | 6.3 |
| Editing or cleaning data sets | 75 | 18.8 | 6.3 |
| Tests of Reliability | Regularly | Occasionally | Not at all |
| Confidence intervals | 62.5 | 25 | 12.5 |
| Odds ratios | 43.8 | 25 | 31.3 |
| Trend analysis | 37.5 | 50 | 12.5 |
| Survival models | 37.5 | 31.3 | 31.3 |
| Spatial Analysis | Regularly | Occasionally | Not at all |
| Geocoding data sets/address-matching | 37.5 | 37.5 | 25 |
| Creating maps of multiple factors | 31.3 | 43.8 | 25 |
| Spatial analysis using a GIS | 31.3 | 37.5 | 31.3 |
| Exploratory spatial data analysis | 25 | 25 | 50 |
| Cluster analysis | 18.8 | 25 | 56.3 |
| Spatial statistics | 12.5 | 43.8 | 43.8 |
The publication analysis identified a large number of tasks and methods in data preparation and analysis, well more than we anticipated finding (overall section IRR: 82.2%; data preparation IRR: 75.6%; methods of testing IRR: 88.9%). Commonly reported preparation activities included data aggregation, cleaning and geocoding (Table 2). We classified analytical methods that were reported in publications into three types: cluster detection, spatial autocorrelation and other analytical methods (Table 3). While a few articles reported the use of cluster detection or spatial autocorrelation methods, aspatial methods were more common. The aspatial methods were highly diverse, with 33 different methods in the ‘other’ category.
Table 2.
Prevalence of data preparation tasks reported in publications.
| Percent of Articles Reporting Data Preparation Tasks | |
|---|---|
| None | 37.8 |
| Aggregation | 26.7 |
| Cleaning | 24.4 |
| Geocoding | 24.4 |
| Integration | 15.6 |
| Other (total) | 15.6 |
|
Centroid calculation
Creation of composite variables Creation of exposure variables Linear interpolation Log-transformation Multiple operations |
4.4
2.2 2.2 2.2 2.2 2.2 |
Table 3.
Prevalence of analytical methods reported in publications.
| Percent of Articles Reporting Analytical Methods | |
|---|---|
| Cluster detection | 20 |
| Geographic analysis machine (GAM) | 0 |
| K statistic | 2.2 |
| Scan statistic | 13.3 |
| Other cluster detection method | 4.4 |
| Spatial autocorrelation | 6.7 |
| Moran’s I | 0 |
| Anselin’s local Moran test (LISA) | 0 |
| Geary’s C | 0 |
| G statistic | 0 |
| Other spatial autocorrelation method | 6.7 |
| Other general analytical methods | 93.3 |
| Smoothing | 20 |
| Computational modeling | 17.8 |
| Stratification or effect modification | 40 |
| Inclusion of confounding factors in the model | 20 |
| Regression | 15.6 |
| Logistic regression | 15.6 |
| Other | 62.2 |
Comparing the results from the interviews and publication analysis, we see that the article coding process managed to elicit a greater amount of detail about spatial data analysis methods than the interviews. This detail is probably absent from the interview data due to participants’ reliance on memory for reporting specific analysis methods and the use of a semi-structured interview method.
Many articles did not report any data cleaning activities. The reasons for this may be that data preparation is completed during the exploration phase of analysis, which often does not get reported in publications, or because data preparation is an implicit part of the research process that researchers do not focus upon independently. Overall, the differences in insights obtained from publication analysis and interviews on these topics illustrates why a mixed methods approach to understanding work practices is needed.
5.3.3 Spatial analysis and GIS
We asked participants a range of questions about the software they used, and the present and future usefulness of spatial analysis and GIS. The most commonly used GIS software package was ArcView (n = 7; 43.8%). MapInfo (n = 4; 25%) had a few users, while participants also mentioned other mapping and analysis software, specifically Business Map, ArcGIS, Maptitude, EpiMap, GeoDA, and MapPro.
The publication analysis also identified GIS software use (software section IRR: 92.9%) including ArcView (n = 3; 6.7%), MapInfo (n = 2; 4.4%), Maptitude (n = 2; 4.4%), Microsoft Streets 98 (n = 2; 4.4%), AtlasGIS (n = 2; 4.4%). However, the total use of GIS was limited (n = 11; 24.4%).
Beyond identifying typical software packages used, the additional sets of interview questions related to GIS and spatial analysis have two primary foci: (a) investigating the usefulness (or perceived usefulness) of GIS and spatial analysis for addressing a series of research goals, and (b) identifying limitations of current spatial analysis methods and tools (both within and outside of GIS packages).
The interview questions that focused on usefulness of GIS and spatial analysis addressed a set of nine potential research goals. These included goals that were specifically geographic (e.g., determining spatial patterns of cancer incidence and cancer mortality); goals that focused on multivariate analysis (e.g., comparing cancer rates with environmental risks or demographic indicators); and goals focused on understanding data quality. For each goal, participants were asked to respond with one of the following ratings: “very useful” “moderately useful”, “not very useful” and “not sure.” The interviewer then prompted additional discussion to clarify and contextualize the responses. This additional detail is an important input to the conceptual models of geospatial method and tool use developed in section 6 below.
Overall, GIS and spatial analysis were rated as moderately or very useful in more than 70% of the scenarios that we asked about. For all questions, at least half of the participants indicated that GIS and spatial analysis were at least moderately useful for addressing the listed research goal (with a range from 50.1% for the task “To assess the quality of data available” to 87.6% for the task “To determine geographical patterns of cancer incidence”; Table 4). Not surprisingly, the highest ratings were given for the explicitly geographic goals of determining geographical patterns of cancer incidence and mortality (with 81.3% and 68.8%, respectively, saying GIS and spatial analysis were very useful). The difference between ratings of the utility of spatial methods for determining patterns of incidence and mortality is interesting, and may be due to the wider availability of other geospatial data layers (i.e., non-health outcome data) that could potentially explain geographic differences in incidence and mortality. For example, while there is a plethora of environmental data available that could help researchers to quantify possible patient exposure to carcinogens (e.g., the EPA’s Toxic Release Inventory), data relevant for mortality rate differences (e.g., differences in access to screening programs or particular treatment options) may be less commonly available in a spatially explicit format. At the other extreme, less than one-third of participants rated GIS and spatial analysis as very useful to either finding missing data (31.3%) or for looking for associations between different kinds of cancer (31.3%). This suggests that new ESDA methods that assess missing data and explore associations among variables should be developed and procedures for using them effectively should be disseminated, as they are tasks for which visual analysis methods have been shown to be effective in other domains (Swayne et al., 1997; Andrienko and Andrienko, 2001; Guo et al., 2005).
Table 4.
Interview participant perceptions of the utility of GIS and spatial analysis for common cancer research goals.
| Participants’ Judgments on the Utility of GIS and Spatial Analysis Methods for Particular Analytical Goals (%) | ||||
|---|---|---|---|---|
| Potential Uses | Very Useful | Moderately Useful | Not very useful | Not sure |
| To determine geographical patterns of cancer incidence | 81.3 | 6.3 | 0 | 12.5 |
| To determine geographical patterns of cancer mortality | 68.8 | 18.8 | 0 | 12.5 |
| To determine geographical patterns of cancer staging | 56.3 | 12.5 | 12.5 | 18.8 |
| To compare spatial patterns of cancer incidence and cancer mortality | 56.3 | 18.8 | 6.3 | 18.8 |
| To look for association among environmental risk factors and cancer rates | 56.3 | 18.8 | 12.5 | 12.5 |
| To compare distribution of health indicators with social and demographic characteristics | 56.3 | 25.0 | 0 | 18.8 |
| To compare cancer incidence rates or odds of exposure between two or more study groups | 43.8 | 18.8 | 18.8 | 18.8 |
| To look for associations between different types of cancers | 31.3 | 25.0 | 18.8 | 25 |
| To assess the quality of data available (for example, to assess the extent of missing data). | 31.3 | 18.8 | 25 | 25 |
Slightly more than half of the participants judged GIS and spatial analysis to be very useful for tasks involving comparisons, such as between specific cancer stages, between cancer incidence and mortality, between cancer rates and environmental risk factors, and between health indicators and socio-demographic characteristics. If we assume that there are important geographic components in such comparisons, this limited endorsement of GIS and spatial analysis suggests that attention needs to be directed to developing more understandable and easy to use methods and tools that enable spatial comparisons and to developing training and dissemination strategies to support this use.
To supplement the above findings, we analyzed participants’ responses to questions about other potential uses of GIS and ESDA for cancer research. One participant was not sure and five participants could not think of any other potential uses of GIS and ESDA for their work other than those about which they were specifically asked (Table 4). The rest of the participants had suggestions regarding additional spatial methods. These suggestions were specific to the type of research that the individual conducted. One specific example mentioned was correlating a particular disease and a type of disaster site (e.g. explosion). Another participant mentioned that GIS and spatial analysis tools could be useful for determining factors in disease clustering and their correlation with related spatial factors. Some participants also thought that the ability to combine data from different domains (e.g., demographic, education and screening services) was another useful GIS capability. Another participant thought that “tight integration between GIS and ESDA functionalities, especially of time series data, would be very helpful.” The most important finding from this section of the interviews is that participants are willing to use ESDA tools for future analysis. This knowledge, along with information about what an ideal tool should do and the limits imposed on the research process by present spatial analysis software, are useful inputs to the design and implementation of ESDA tools for health researchers.
In addition to asking participants to consider the utility of GIS and spatial analysis for their research, we asked them to discuss the limitations of the technology as they currently understood them. Four participants did not think present GIS software had any limiting factors. Another four were either not sure or did not comment on limits. The remaining participants (n = 8) suggested a number of limitations, which we have sorted into four types.
The participants felt that the most important limitations are those related to geocoding and data aggregation. Researchers often aggregate their data to particular geographic units (e.g., census tracts) because certain socio-economic data are only available in these units. While more detail is often desired, individual-level data or other high-spatial resolution data, such as zip-code extensions are often unavailable. When individual-level data are available, accurately geocoding them can be a further barrier to their efficient and effective use. Some participants also mentioned additional spatio-temporal data problems such as not getting “real-time data in timely fashion”, or the “calculation of the interim periods” with census data. Related to this are issues of confidentiality for high spatial resolution data, (e.g., postcodes and point locations). Therefore, if ESDA tools can help to efficiently and effectively geocode data (see Krisp et al., 2007 for a recent example of using geovisualization to detect geocoding errors), and exploit aggregated individual or high-resolution data without reducing the quality of the analysis or revealing identity, they will be more useful.
Second, participants cited a lack of support for merging data from different sources or data that have been constructed using different software tools. As one step to address this, they wanted geospatial software to interoperate with other popular software packages (e.g., to have import and export capabilities with such packages). One participant gave the example of BusinessMap (v3), which is compatible with Microsoft products. Comments such as “be very flexible in terms of the kinds of data it can accept as inputs,” “usability in terms of interfacing with presentation software,” “to be able to accept data from SAS and SPSS,” and “interfacing with administrative tasks” were common.
A third limitation was functionality. A comment by one participant described the problem: “though it [GIS] is powerful and useful, there are too many steps involved while trying to overlay multiple layers – no easy way of cutting and pasting. Therefore it is very time consuming. If there was a memory of the steps that can be used…” This idea of capturing and reusing sequences of actions was also reflected in a comment from one participant who wanted more flexibility in “storing of different paths” from which data are accessed. Other functionality that participants mentioned when describing the “ideal” spatial analysis package includes: having a comprehensive program menu; be able to change scale; and to be able to make 3-D maps. Another participant also mentioned labeling and printing issues.
Finally, many participants felt current spatial analysis software was needlessly complex and should be simplified. They also felt that there is general confusion about spatial analysis because of limited knowledge in the research community. It was clear that some participants were not completely aware of the functionalities and capabilities in current software as they have not used them often or in much detail. This problem is exacerbated because spatial analysis is perceived by some as having a steep learning curve and few standard statistical functions. Thus, many participants assume that they will have problems with the core analysis tasks.
The above discussion illustrates that if we want to design ESDA tools that have the potential to be used widely and successfully, the tools must be easy for intended users to understand, they should provide clear examples related to epidemiological research and analysis, and they should be portable or compatible with other programs. Because of a lack of familiarity with GIS and the complexity of existing GIS software, some participants were under the impression that successful GIS software use requires training at the Masters degree level; we assert that with the right training, an undergraduate can easily and successfully operate GIS software. Therefore, clear instructions through comprehensive tutorials and examples are needed to reduce researchers’ assumptions that the software is too complex. A more comprehensive approach to disseminating tools and examples of their successful applications as well as training in tool use is clearly needed.
5.3.4 Types of data used by health researchers
We also asked about the kinds of data that participants typically used in their research. Participants’ responses reveal, to an extent, the kinds of associations and relationships that they are trying to identify (Table 5). All participants used demographic datasets (e.g., age, gender and education). Almost all participants also reported investigating relationships between race or ethnicity and disease (n = 15; 94%), and a large proportion used data on different measures of cancer occurrence (e.g., incidence or mortality). Although not as many participants used psychosocial or environmental information, the correlation of environmental factors with cancer incidence was often mentioned as a potential future use of the software.
Table 5.
Comparison of participant responses to questions about the types of data they typically use with the types of data reported in publications. Data types for which we did not have similar categories in both the interviews and publication analysis are described with the abbreviation NCC (‘no comparable category’).
| Percent Using a Dataset Type | Participants | Articles |
|---|---|---|
| Age/gender/education | 100 | 73.3 |
| Race/ethnicity | 93.8 | |
| Cancer mortality | 87.5 | 31.1 |
| Cancer incidence or morbidity | 87.5 | 46.7 |
| Cancer prevalence | NCC | 17.8 |
| Behavioral or lifestyle | 75.0 | 31.1 |
| Health services (organizations) | 75.0 | 15.6 |
| Health services (providers by type) | 62.5 | |
| Other morbidity | 56.3 | 8.9 |
| Other (cancer staging) | 56.3 | NCC |
| Transportation information | 43.8 | NCC |
| Other (policy) | 43.8 | NCC |
| Environmental or Toxicological | 37.5 | 35.6 |
| Other (health insurance) | 37.5 | NCC |
| Other (genetic characteristics) | 18.8 | 4.4 |
| Distance | NCC | 8.9 |
| Other (general) | NCC | 35.6 |
The publication analysis also identified several kinds of data use (Table 5; IRR: 80.3%). Not surprisingly, the publication analysis results are very similar to the interview results, with socio-demographic data ranked highest followed by disease incidence and environmental and toxicological factors as the next most commonly used data.
The most commonly used scales of geospatial data are those that are used for aggregating census data such as counties, census tracts, census blocks and zip codes (Table 6). Since most available socio-demographic data are aggregated to predefined units, researchers are unable to work with study-defined spatial units without interpolating between existing area aggregation units. This lack of spatial unit definition flexibility was a recurrent concern among many participants. This problem has also been extensively discussed in the broader public health community (including some articles that focus specifically on cancer data) in a series of recent papers on problems associated with geocoding, interpolating between areal units and data aggregation (e.g., see Rushton et al., 2006, Lovasi et al., 2007, Schootman et al., 2007).
Table 6.
Prevalence of geospatial analytical units commonly used by interview participants.
| Percent of Participants Using Particular Geographical Areal Units | |
|---|---|
| Census Blocks | 31.3 |
| Census Block Groups | 31.3 |
| Census Tracts | 50.0 |
| Counties | 75.0 |
| States | 68.9 |
| Zip Codes | 50.0 |
| Health Service Areas | 43.8 |
| Health Professional Shortage Areas | 25.0 |
| Economic Development Districts | 18.8 |
| Study Defined | 0.0 |
| Don’t Know | 6.3 |
| Other | 6.3 |
| None | 18.8 |
The publication analysis identified point, area and surface data used at different geographical scales (Table 7; IRR: 87.9%). Data aggregated to areal units were most common (point: 31.1% of articles, area: 86.7%, surface: 6.7%). Census area aggregations were more commonly used than non-census area aggregations (73.3% vs. 26.7% of articles); U.S. census units were less commonly reported in the articles than in interviews possibly because the articles include many non-U.S. studies. User-defined units were employed in only 8.9% of articles.
Table 7.
Prevalence of geospatial analytical units reported in publications.
| Percent of Articles Using Particular Geographical Units | |
|---|---|
| Point | |
| Non-residence places | 6.7 |
| Residences | 17.8 |
| Other (total) | 11.1 |
|
Radio station
Individual cases Address at birth Billboard location Multiple point types |
2.2
2.2 2.2 2.2 2.2 |
| Census Area | |
| Block | 0.0 |
| Block group | 8.9 |
| Census tract | 11.1 |
| County | 11.1 |
| State | 2.2 |
| Other or international (total)
Prefecture International state Island Enumeration district Output area Province Municipality Electoral ward Urban-rural Country Settlement Village Administrative boundary Multiple areas Census division Individual |
46.7
2.2 2.2 2.2 2.2 2.2 4.4 2.2 6.7 2.2 8.9 2.2 2.2 2.2 2.2 2.2 2.2 |
| Non-census Area | |
| ZIP code | 6.7 |
| Health service area | 2.2 |
| Study defined (total)
Large cities UK CSS study regions 3 km wide concentric zones Small Area Market Statistics Areas |
8.9
2.2 2.2 2.2 2.2 |
| Other (total)
Postal forward sortation area State economic area Regional cancer registry area Geographic region City ward |
11.1
2.2 2.2 2.2 2.2 2.2 |
| Surface | |
| Continuous surface | 6.7 |
5.3.5 Visual representation
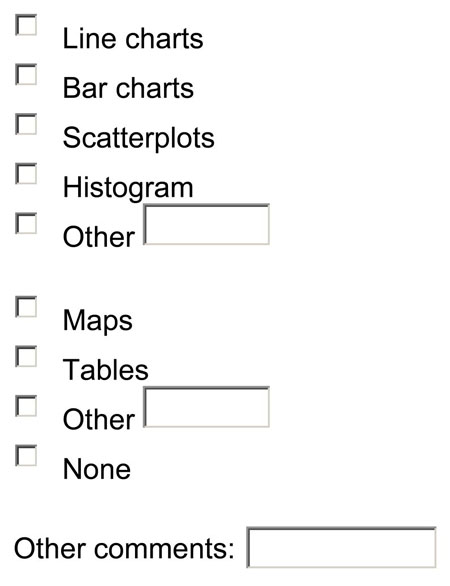
All of interviewees reported using visual representations to display their data. The most commonly employed visual data displays were histograms (n = 10; 63%), scatterplots and scattergrams (n = 10; 63%), maps (n = 9; 56%), and line charts or line graphs (n = 7; 44%). Other display methods that participants used included bar charts, boxplots, pie charts, and 3-D spin scattergrams. Some participants used terms like “simple plots” to describe visual displays. Most researchers used tables for organizing and presenting their data; some participants mentioned tables as a type of display, while others did not consider them to be displays.
For several types of displays, the proportion of display use we observed in the publication analysis differed from the use our interview participants reported (Table 8; IRR: 90.2%). Maps and tables appear in publications about as often as they were mentioned in interviews. However, the proportions for other display forms are quite different. While histograms, scatterplots, and scattergrams are mentioned by well over half of the participants, they appear in fewer than 11% of the publications. Line charts and bar charts appear more frequently in publications than they were mentioned in the interviews. This suggests that the display types that researchers find most useful for exploring their data and coming to an understanding of relationships within those data may differ from the display types they feel are most suited to communicating their findings.
Table 8.
Prevalence of visual display forms observed in the publication analysis.
| Percent of Articles Using Graphs or Figures | |
|---|---|
| Table | 93.3 |
| Map | 53.3 |
| Line chart | 20.0 |
| Bar chart | 17.8 |
| Scatterplot | 11.1 |
| Other graph type
Cross section diagram Methylation assay example Flow chart) |
6.7
2.2 2.2 2.2 |
| Other display type (total)
Photo Linked micromap plot |
4.4
2.2 2.2 |
| Histogram | 2.2 |
6. Conceptual approach to user-centered design: Models of geospatial method use by cancer researchers
As part of our UCD development process, the research reported above constitutes a work domain analysis. Here, we draw upon that analysis to outline key implications for system design and we formalize the results into graphic models that provide a framework for matching tool functionality to research stages and specific tasks.
6.1. Characterizing user types
Since our data are qualitative, and based on a limited set of domain expert interviews complemented by analysis of published results of research, we present models based upon the synthesis of perspectives we ultimately derived (figure 3) and upon representative individuals (figures 4 and 5). These three diagrams are based on information that we gathered in the interviews and publication analysis and that is reported in Section 5.
Figure 3.

A model for grounding ESDA method and tool development in the work practices of cancer researchers. This model can be used to direct both interface design and the development of new, epidemiologically-relevant geospatial methods.
Figure 4.

Modeling the workflow characteristics of an intensive ESDA- and GIS-user. Current ESDA tool development pathways have produced tools that most effectively support this type of user. Knowledge about this user type can provide tool designers with a model of the successful integration of geospatial methods within an epidemiological work flow.
Figure 5.

Modeling the workflow characteristics of a potential new ESDA- and GIS-user. This diagram can help us to identify new potential pathways for developing ESDA tools that will be more effective in supporting this user type (e.g., providing direct support for pre-analytical exploration of spatially-referenced data and more seamless methods of integrating non-geospatial analytical tasks with geospatial analysis).
Figure 3 presents the range of materials and methods that cancer researchers use to support their thinking about research problems. The characterization of steps in the research process (the section on the left) and their relation to data inputs and analytical tools (sections in the middle and right) provides a starting point for grounding ESDA method and tool development in the work practices of researchers for whom the methods and tools are designed. In both cases, the items highlighted are those identified as important through a combination of the interviews and literature analysis (see section 5 and Appendices for details).
The systematic qualitative analysis of systematically collected qualitative data that we used to produce this diagram led to a number of important insights relevant for geospatial toolkit design to support cancer prevention and control. First, this diagram shows that most cancer control and prevention researchers conceptualize their work as having stages and that three conceptually separable stages are typical. This suggests a tool design approach that organizes tools in ways that are complementary to the typical stages and, perhaps, adjusts tool behavior to the stage of analysis. Second, the diagram highlights tasks that are particularly common, and that are thus critical to support explicitly in a geospatial epidemiological toolkit. Third, it draws attention to database-related issues that are usually not addressed in ESDA or geovisualization research (i.e., those related to use of OLAP data organization and access methods, data warehousing, and data mining). Finally, it led us to realize that cancer control researchers utilize a much wider array of statistical and GIS tools than we anticipated before conducting this research.
Knowledge about cancer researchers’ thinking processes can be used to support the design of more effective user interfaces. For example, we might develop a wizard-like interface for less-sophisticated ESDA users that combines the use of simple statistical and spatial techniques to scan datasets for missing data. Similarly, knowledge about the types of analyses cancer researchers undertake, and the types of data, displays and software they use is critical to design of new components for ESDA tools. For example, we could develop data import routines that allow researchers using software such as SaTScan to more seamlessly map and explore their analysis results. Knowledge derived in this research also provides a base from which to approach a more comprehensive observational study of the research process (as currently practiced and as enabled by advanced ESDA methods and tools – see Robinson, in press for such a study that was informed by preliminary results of the research reported here) and from which to design controlled laboratory tests of ESDA methods and tool usability and usefulness.
However, because a ‘synthesized’ individual does not exist in reality, and because different users are best supported by different software features, a more effective software design strategy is to design software that can be adapted to multiple user groups. There is substantial variation between individuals with regard to both how they think while undertaking research and the methods and tools they use to support their work. In figures 4 and 5, we present a graphic summary of two individuals from our participant set who represent end points on the scale from frequent, sophisticated use of GIS and spatial analysis (i.e., an intensive user) to no use of GIS and spatial analysis (i.e., a potential new user).
The intensive ESDA and GIS user works with a large number of different software tools that perform a broad array of analytical functions. S/he utilizes several different types of data, and employs a variety of data display types to visualize her or his data. Such users are likely to want and need tools that allow data to be moved from one software package to another, that support temporal or spatio-temporal analysis (e.g., trend analysis), and that can easily and quickly visualize the uncertainty encapsulated in confidence intervals for a map. Documenting how an exemplar intensive geospatial tool user structures his or her analysis is particularly valuable as a model against which to develop tool and training materials. For example, we did not expect to uncover use of maps in early stages of research to provide a geographic overview, nor did we anticipate that such a large number of spatial and non-spatial methods would be used by one individual.
The potential new ESDA and GIS user works with a more limited suite of data types and data display types, and performs fewer different types of analytical tasks with fewer pieces of software. This user might benefit most from ESDA tools that are tightly integrated with traditional statistical software packages and that allow her/him to identify missing information or to visually explore associations in data easily. Beyond these functions, this user might benefit from an interface to ESDA methods that suggests (and provides a related, compelling example of) when in the research process to use a particular method or technique. A particularly important finding, illustrated in this figure, is that pre-analysis exploration is a common and important step undertaken by researchers in cancer surveillance and control. This step has not been documented previously and no past research in ESDA or geovisualization has explicitly addressed this set of tasks as important ones that tools must support.
6.2. Key findings for informing tool design
Overall, the interviews and publication analysis each provided important insights into the analytic methods, visual representations, and tools used or required by cancer researchers. We identified a consistent parsing of the research process into three stages and identified core tasks within each stage. In addition, we documented the typical sequence(s) of tasks that researchers follow and that are an important input to determining the overall layout and functionalities that an ESDA tool should have. We generated three particularly important insights about cancer researchers’ use of geospatial methods.
The first centers on the exploration and analysis methods that cancer control researchers use. Understanding exploration goals is a key input to design of support for exploration. Although exploration is often interwoven with analysis, through the combination of interviews and publication analysis, we were able to identify distinct goals for exploratory methods (e.g., validity checks, understanding dataset structure, generating hypotheses). We can separate exploration into two distinct types: pre-analytical exploration and analytical exploration. The former includes tasks such as data cleaning (e.g., validity checking) and basic descriptive analysis (e.g., understanding dataset structure), while the latter focuses on identifying patterns and relationships, with the ultimate aim of generating hypotheses.
Pre-analytical exploration, based on the evidence compiled, is a key part of the research process. But, it is underrepresented in current geospatial/ESDA tools. Pre-analytical exploration often involves tasks that can be routine, but when not supported within an analytical tool set can impede subsequent analysis, lead to flawed analysis in which dataset limitations are not considered sufficiently, or discourage researchers from even initiating the analysis.
In comparison to pre-analytical exploration, analytical exploration can involve more elaborate and complicated interactions with the data and with visual representations of the data. Thus, many users, especially the more intensive users may benefit from the ability to capture their analytical process so that they can revisit what they have already done (see Robinson and Weaver (2006) for an example of one potential method for providing such functionality). Such functionality may help to make the process of analytical exploration more efficient, as it would allow easier reuse of a particular analytical exploration strategy.
Analysis (and the methods employed for analysis) is dependent on the kind of hypothesis being tested and is done with the help of specific software, which varies significantly between individual researchers. From this, we can conclude that our ESDA environments need to allow flexibility to account for the variety of tasks that researchers carry out and the variety of characteristics of the datasets they work with.
The second insight centers on geographic information systems (GIS) and spatial analysis. We observed that researchers often use spatial data, yet spatial analysis with GIS is limited by the currently available tools and by researchers’ knowledge of how to use such tools. Cancer prevention and control researchers who use GIS and spatial analysis tools most intensively cited limitations with the capabilities of currently available tools, such as a lack of methods for quickly, easily and effectively visualizing data uncertainty and for quickly transforming data from the format required for one analytical method into another. Those researchers with little prior experience with GIS and spatial analysis tools are most hampered by a lack of knowledge about when a particular analytical approach may be useful within their broader workflow. Thus, the types of software environments that we design for these two different user groups may look and act quite differently. For example, intensive users need extended functionality, while less-intensive users need tool packages that help them to learn which methods are appropriate in particular contexts.
The third insight relates to the types of data, their sources and spatial scales used by health researchers. We found that cancer researchers use a wide range of data types, including socio-demographic, disease incidence and mortality, health services, and environmental data, as well as geographical proximity and genetic information. This insight has important implications for understanding the data handling capabilities that the present (or future) ESDA tools need to manage. Specifically, there is a need to support multiple-source, multi-format data at a variety of spatial scales.
7. Conclusions
As noted in the introduction, this study represents one component in a larger effort to develop a comprehensive understanding of the data exploration and analysis strategies used by researchers in the fields of epidemiology, medical geography, biostatistics, and related domains. We are integrating this understanding into the design and implementation of integrated visual, statistical, and computational methods and tools for studying the geographic aspects of cancer and its covariates.
By itself, this study has some obvious limitations. The key informant interviews, while in-depth, were done with a relatively modest number of participants. Following usual qualitative research practice, we complemented these interviews with publication analysis. Nevertheless, semi-structured interviews complemented by analysis of published research can only uncover knowledge that is conscious and expressible in language (and related graphics, tables, and other formal representations in the case of the publications). Both methods are unlikely to expose either tacit knowledge or more specific knowledge that is tied to particular contexts. To address this issue, we have completed complementary research using user observation and task analysis (Robinson et al., 2005; Bhowmick et al., 2006). Future complementary research could be directed to sampling a wider array of researchers in less depth.
The next step in our user-centered design process is to translate the model of the research process that we have developed in this research and the aforementioned, related studies into new designs for the software content, functionality, and interfaces. This requires a collaborative effort with the system designers, software developers, and potential users. This process is not a simple linear sequence of events (Shadbolt et al., 1999), but rather an iterative process where there is a constant exchange and feedback between the knowledge domain and the implementation domain.
Acknowledgments
We would like to thank Alistair Geddes, Xiping Dai, Megan Darnell and Ann Ward for their contribution to early discussions on the research design and for their participation in data collection activities.
This material is based upon work supported by the National Cancer Institute under Grant No. CA95949.
Appendix 1: Literature Review Data Coding


Appendix 2: Interview questions
SECTION 1 (FOR ALL RESPONDENTS)
1. First of all, will you tell me your position title? ____________________________________
2. How long have you been in your position? ________________________________________
3. Does your work involve the analysis or interpretation of cancer data? Yes/No
If Yes: proceed to section 2.
4. Does your work involve the analysis or interpretation of other health-related data? Yes/No
If Yes: proceed to section 3.
5. If not, will you briefly describe what your work entails?
________________________________________________________________________
If the person does not do data analysis of any kind, you will judge that from the above two questions and keep or remove them from the study. If you need to remove them, then say…
We are focusing this survey toward people who use cancer or health data and/or statistical analysis tools. Since you do not fit that criteria at this time, we don’t need to proceed with this interview. Would you be able to identify a coworker or other collaborator who does this kind of work that we could interview? If yes, note the name and contact information of that person.
Name: ___________________________________________________
Phone 1: _________________________________________________
Organization: _____________________________________________
Thank you for your time.
SECTION 2 (FOR RESPONDENTS WORKING WITH CANCER DATA)
1. Which cancer sites do you work on, either primarily or occasionally? (CHECK AN ‘X’ FOR EACH ONE IN THE FOLLOWING TABLE)
| BRAIN/NERVOUS SYSTEM | LIVER/INTRAHEPATIC BILE DUCT | ||
| BREAST (FEMALE) | LYMPHOMAS (NON-HODGKIN) | ||
| BRONCHUS & LUNG | MELANOMA OF THE SKIN | ||
| BUCCAL (ORAL) CAVITY & PHARYNX | MYELOMA (MULTIPLE) | ||
| CERVIX UTERI | OVARY | ||
| COLON & RECTUM | PANCREAS | ||
| CORPUS/UTERUS | PROSTATE | ||
| ESOPHAGUS | STOMACH | ||
| HODGKIN LYMPHOMAS | TESTIS | ||
| KIDNEY & RENAL PELVIS | THYROID | ||
| LARYNX | URINARY BLADDER | ||
| LEUKEMIAS | NOT SPECIFIED | ||
| ALL CANCERS | OTHER1 | ||
| OTHER2 | OTHER3 |
It’s convenient to divide possible causes of cancer into exogenous factors and endogenous factors. What we mean by “exogenous” are external causes such as environmental, behavioral, cultural, and health services factors. In contrast, endogenous factors include genetic pathogenic mechanisms.
2. Does your work primarily involve: 1) exogenous factors 2) endogenous factors or 3) both?
If 1 or 3 continue here:
3. I’m now going to read you some general descriptions of exogenous, or external, cancer risk factors. For each one, please tell me approximately what percentage of your time involves work in that area (RECORD % BELOW)
| a. Occupational exposures, (e.g. on the job exposure to hazardous chemicals) | d. Lifestyle factors (such as smoking, diet or physical activity) | ||
| b. Residential or other NON-occupational exposure to environmental carcinogens | e. Access to healthcare systems or services | ||
| c. Socio-economic factors or conditions, (for example low poverty or education levels) | Other: |
4. You mentioned that your work involves exploration of endogenous cancer risk factors. Can you tell me what areas specifically and how much time you spent doing each of the tasks:
Area 1 _____________ Time spent _____________
Area 2 _____________ Time spent _____________
Other Areas _______________________________________
5. Does your cancer work involve data collection or analysis of data related to ‘cancer prevention’ efforts? (for example, do you work on topics related to cancer screening rates, nutrition interventions and other prevention activities, or educational outreach)? (CIRCLE CHOICE BELOW)
NO (GO TO SECTION 3)
YES (GO TO NEXT QUESTION)
What specifically: ______________________________
Please tell me approximately what percentage of your time involves work in those areas (RECORD % BELOW)
| cancer screening programs and rates | |
| nutrition interventions | |
| other prevention activities | |
| educational outreach | |
| Other |
SECTION 3: GIS AND SPATIAL ANALYSIS QUESTIONS
1. I would like to ask you some questions about data analysis tasks and methods that you might use in your work. For each one, please tell me whether you use them regularly, occasionally, or not at all.
| REGULARLY Daily or Weekly | OCCASIONALLY about 3 x month | NOT AT ALL | |
|---|---|---|---|
| a. odds ratios | |||
| b. spatial statistics (e.g. Moran’s I, LISA, point pattern analysis | |||
| c. trend analysis | |||
| d. survival models | |||
| e. cluster analysis | |||
| f. exploratory spatial data analysis | |||
| g. gamma confidence intervals | |||
| h. creating maps of multiple factors | |||
| i. geocoding data sets/address-matching | |||
| j. spatial analyses using a GIS | |||
| k. editing or cleaning data sets | |||
| l. making graphs or charts |
2. When you are working on a data set or sets in your position, do you use your skills to generate or test hypothesis?
Generate Hypothesis
Test Hypothesis
Both
Neither
3. We’d like to understand how you and other researchers like yourself approach data exploration and analysis.
a. When you begin work on a multi-variable database to, say identify patterns of cancer/other disease incidence…, how would you describe your first three primary tasks.
b. Following those tasks, what do you do next?
c. What would you describe as the final tasks you would do for this type of data exploration or analysis…
4. In your daily work, which of the following computer software packages do you use? Check those used most frequently.
| MAPINFO | SAS | ||
| ARCVIEW SPATIAL ANALYST | SPSS | ||
| SPACESTAT | CLUSTERSEER | ||
| SATSCAN | S-PLUS | ||
| SEER-STAT | DEVCAN | ||
| JOINPOINT | EPI INFO | ||
| CDC WONDER | |||
| OTHER1 | OTHER2 |
5. We are also interested in the kinds of data plots and displays that data analysts like you are currently using, such as different kinds of statistical graphs or maps, or other forms of charts. So first, of all, do you generally use these kinds of plots in the process of your work? Yes/No
6. What kinds of displays and plots do you commonly use with your data?
7. We’d like to identify ways that GIS and spatial data analysis tools currently prove useful OR might prove useful in the future. We’d like to known your own personal opinions about this. Please rate how useful you think spatial data analysis is for each of the following items (Skip if GIS and Spatial analysis not applicable). (CIRCLE RELEVANT CHOICE BELOW)
| Very | Moderately | Not Very | Not | |
|---|---|---|---|---|
| sure | Useful | Useful | Useful | |
| To determine geographical patterns of cancer incidence | 1 | 2 | 3 | 4 |
| To determine geographical patterns of cancer mortality | 1 | 2 | 3 | 4 |
| To determine geographical patterns of cancer staging | 1 | 2 | 3 | 4 |
| To compare spatial patterns of cancer incidence and cancer mortality | 1 | 2 | 3 | 4 |
| To look for association among environmental risk factors and cancer rates | 1 | 2 | 3 | 4 |
| To compare distribution of health indicators with social and demographic characteristics | 1 | 2 | 3 | 4 |
| To compare cancer incidence rates or odds of exposure between two or more study groups | 1 | 2 | 3 | 4 |
| To look for associations between different types of cancers | 1 | 2 | 3 | 4 |
| To assess the quality of data available (for example, to assess the extent of missing data). | 1 | 2 | 3 | 4 |
8. Are there any other ways that you think that GIS and exploratory spatial data analysis tools might prove useful to you in your work in the future?
9. Are there any ways that you think current spatial analysis methods and tools, whether or not they are in GIS packages, impose limits on the sort of work that you do?
10. If you could have a GIS package and no holds barred in time or funding, what would you want it to do for you.
11. We have already created some geographic analysis tools that work with data aggregated to areas, such as data for counties or zip codes and are working on other tools that focus on point data, such as individual addresses. We are interested in the extent to which your work uses either kind of data. Do you work with area-based data sets, point based data sets, or both, or neither? (CIRCLE CHOICE BELOW)
Area-Based Data Sets,
Point Based Data Sets
Both
12. I am going to read a list of area frameworks. For each one, please say if it is important in your own work.
| CENSUS BLOCKS | STATES | ||
| CENSUS BLOCK GROUPS | 5 | ZIP CODES | |
| CENSUS TRACTS | HEALTH SERVICE AREAS | ||
| COUNTIES | ECONOMIC DEVELOPMENT DISTRICTS | ||
| HEALTH PROFESSIONAL SHORTAGE AREAS | OTHER 2 | ||
| OTHER 1 | DON’T KNOW | ||
| OTHER 3 | STUDY DEFINED |
13. What kinds of locations do the point data sets cover? For example, people’s addresses or other types of places such as health clinics?
Individual Addresses
Other
Don’t Know
14. Do you use any other types of spatial data sets? Yes/No/Don’t know
15. Where you get the data that you normally work with?
| own organization | |
| cancer registry | |
| population census | |
| Behavioral Risk Factor Surveillance System (BRFSS) | |
| On line national databases (SEER, NCHS, ARF etc.) | |
| State health department | |
| university research projects | |
| Other1 | |
| Other2 | |
| Other3 | |
| Don’t Know |
16. From our point of view, it would also be helpful to try to categorize your data according to a number of different kinds of data variables. Please tell me if your data you use are related to……….
| Environmental Or Toxicological Data | |
| Age/Gender/Education | |
| Behavioral Or Lifestyle Data | |
| Health Services (Organizations) | |
| Cancer Incidence Or Morbidity | |
| Health Services (Providers By Type) | |
| Other Morbidity | |
| Cancer Mortality | |
| Race/Ethnicity | |
| Transportation Information | |
| OTHER1 (Health Insurance, Genetic Something, Cancer Staging, Policy, Demographics) | |
| Other2 | |
| Other3 | |
| Unsure/Don’t Know |
17. Are there data you would like to have, but can’t get?
Yes/No.
If yes, specify
SECTION 4 (RESPONDENT DESCRIPTORS)
I have just of a few more questions left.
1. Are there any journals or other publications that you regularly read that are important references for your own work?
NO_____
YES_____
(SPECIFY):_______________________________________________________________
2. Is there anything else you would like to add, either based on the on the questions we’ve just been through, or on the goals of our project? (RECORD BELOW)
________________________________________________________________________
3. Finally, we will be continuing with more detailed consultations a few months from now. That effort will involve doing more in-depth interviews and focus groups as part of our software testing. Would it be ok if we contact you again to ask you either to do an interview or to take part in a focus group? Yes/No
4. Do you have a preference for being interviewed or taking part in focus group? (CIRCLE CHOICE)
______INTERVIEW
______FOCUS GROUP
______UNDECIDED
Footnotes
ACT-based representation of knowledge (ARK) is inspired by Anderson’s (1983) ACT model. See Anderson (1983) and Geiwitz et al. (1988).
This technique[0] helps probe both “static knowledge” as well as a “set of procedures performed on that knowledge.” It specifically seeks to describe both a network of static knowledge about the domain and a set of procedures that are performed on that knowledge (Cooke, 1994, p. 809).
The “other cancer site” category included the following types of cancers: all childhood cancers; all cancers combined; anal gland; childhood non-central nervous system solid tumors; gastric; numerous sites; penile and urethral; respiratory; upper aerodigestive; and unspecified.
Publisher's Disclaimer: This is a PDF file of an unedited manuscript that has been accepted for publication. As a service to our customers we are providing this early version of the manuscript. The manuscript will undergo copyediting, typesetting, and review of the resulting proof before it is published in its final citable form. Please note that during the production process errors may be discovered which could affect the content, and all legal disclaimers that apply to the journal pertain.
References
- Anderson JR. The Architecture of Cognition. Harvard University Press; Cambridge, MA: 1983. [Google Scholar]
- Andrienko G, Andrienko N. Exploring spatial data with dominant attribute map and parallel coordinates. Computers, Environment and Urban Systems. 2001;25:5–15. [Google Scholar]
- Andrienko G, Andrienko N, Dykes J, Gahegan M, Mountain D, Noy P, Roberts J, Rodgers P, Theus M. Creating instruments for ideation: Software approaches to geovisualization. In: Dykes J, MacEachren AM, Kraak M-J, editors. Exploring geovisualization. Elsevier: Amsterdam; 2005. pp. 103–125. [Google Scholar]
- Anselin L. Exploratory spatial data analysis and geographic information systems. In: Painho H, editor. New Tools for Spatial Analysis. Eurostat: Luxembourg; 1994. pp. 45–54. [Google Scholar]
- Anselin L, Kim YW, Syabri I. GeoDa: An Introduction to Spatial Data Analysis. Geographical Analysis. 2006;38:5–22. [Google Scholar]
- AvRuskin GA, Jacquez GM, Meliker JR, Slotnick MJ, Kaufmann AM, Nriagu JO. Visualization and exploratory analysis of epidemiologic data using a novel space time information system. International Journal of Health Geographics. 2004;3 doi: 10.1186/1476-072X-3-26. [DOI] [PMC free article] [PubMed] [Google Scholar]
- Bhowmick T, Gruver A, Robinson AC, MacEachren AM, Lengerich EJ. Using e-Delphi to evaluate the Pennsylvania Cancer Atlas. AutoCarto 2006: Proceedings of the AutoCarto 2006 conference, CAGIS; June 26–28; Vancouver, WA, ESRI, Redlands, CA. 2006. p. 13. [Google Scholar]
- Brunsdon C, Fotheringham S, Charlton M. Geographically weighted regression. Journal of the Royal Statistical Society: Series D (The Statistician) 1998;47:431–43. [Google Scholar]
- Carr D, White D, MacEachren AM, MacPherson D. Conditioned choropleth maps and hypothesis generation. Annals of the Association of American Geographers. 2005;95:32–53. [Google Scholar]
- Carr DB, Wallin J, Carr DA. Two new templates for epidemiology applications: Linked micromap plots and conditioned choropleth maps. Statistics in Medicine. 2000;19:2521–2538. doi: 10.1002/1097-0258(20000915/30)19:17/18<2521::aid-sim585>3.0.co;2-k. [DOI] [PubMed] [Google Scholar]
- Carroll JM. Five reasons for scenario-based design. Interacting with Computers. 2000;13:43–60. [Google Scholar]
- Clayton D, Kaldor J. Empirical Bayes estimates of age-standardized relative risks for use in disease mapping. Biometrics. 1987;43:671–681. [PubMed] [Google Scholar]
- Cliff A, Haggett P. Atlas of disease distributions: Analytic approaches to epidemiologic data. Oxford University Press; Oxford, UK: 1988. [Google Scholar]
- Cliff A, Haggett P, Smallman-Raynor M. Measles: An historical geography of a major human viral disease from global expansion to local retreat, 1840–1990. Oxford University Press; Oxford, UK: 1993. [Google Scholar]
- Cliff A, Haggett P, Smallman-Raynor M. Island epidemics. Oxford University Press; Oxford, UK: 2000. [Google Scholar]
- Cooke N. Varieties of knowledge elicitation techniques. International Journal of Human-Computer Studies. 1994;41:801–849. [Google Scholar]
- Cressie N. Smoothing regional maps using empirical Bayes predictors. Geographical Analysis. 1992;24:75–95. [Google Scholar]
- Cromley EK, McLafferty SL. GIS and public health. Guilford Press; New York: 2002. [Google Scholar]
- Croner C, Sperling J, Broome FR. Geographic information systems (GIS): New perspectives in understanding human health and environmental relationships. Statistics in Medicine. 1996;15:1961–1977. doi: 10.1002/(sici)1097-0258(19960930)15:18<1961::aid-sim408>3.0.co;2-l. [DOI] [PubMed] [Google Scholar]
- Davies C. Analyzing work in complex systems task: An exploratory study with GIS. Behaviour and Information Technology. 1998;17:218–230. [Google Scholar]
- Davies C, Medyckyj-Scott D. GIS users observed. International Journal of Geographical Information Systems. 1996;10:363–384. [Google Scholar]
- Dillman D. Mail and telephone surveys: The total design method. Wiley; New York: 1978. [Google Scholar]
- Edsall RM. Design and usability of an enhanced geographic information system for exploration of multivariate health statistics. Professional Geographer. 2003a;55:146–160. [Google Scholar]
- Edsall RM. The parallel coordinate plot in action: design and use for geographic visualization. Computational Statistics & Data Analysis. 2003b;43:605–619. [Google Scholar]
- Exeter D. An evaluation of cartographic visualization techniques for epidemiology. Department of Geography, University of Auckland; Auckland, NZ: 1999. Unpublished MA thesis. [Google Scholar]
- Fischer G, Sullivan JF. Human-centered public transportation systems for persons with cognitive disabilities - Challenges and insights for participatory design. Proceedings of the 7th Participatory Design Conference; June 23–25, Malmö; Sweden. 2002. pp. 194–8. [Google Scholar]
- Gatrell AC, Loytonen M. GIS and health research: An introduction. In: Gatrell AC, Loytonen M, editors. GIS and Health. Taylor and Francis; London: 1998. pp. 3–16. [Google Scholar]
- Geiwitz J, Klatsky RL, MacCloskey B. Knowledge acquisition for expert systems: Conceptual and empirical comparisons. Anacapa Sciences; Santa Barbara, CA: 1988. [Google Scholar]
- GeoVISTA Center. [last accessed 29 August 2007];2007 Geovisualization and spatial analysis of cancer data http://www.geovista.psu.edu/grants/nci-esda/
- Getis A, Ord JK. The analysis of spatial association by use of distance statistics. Geographical Analysis. 1992;24:189–206. [Google Scholar]
- Gordon A, Womersley J. The use of mapping in public health and planning health services. Journal of Public Health Medicine. 1997;19:139–147. doi: 10.1093/oxfordjournals.pubmed.a024601. [DOI] [PubMed] [Google Scholar]
- Griffin AL. Understanding how scientists use data-display devices for interactive visual computing with geographical models. Department of Geography, The Pennsylvania State University; 2004. Unpublished Ph.D. thesis. [Google Scholar]
- Guo D, Gahegan M, MacEachren AM, Zhou B. Multivariate analysis and geovisualization with an integrated geographic knowledge discovery approach. Cartography and Geographic Information Science. 2005;32:113–132. doi: 10.1559/1523040053722150. [DOI] [PMC free article] [PubMed] [Google Scholar]
- Hemingway CJ, Gough TG. [Last accessed 29 August 2007];A dialectical approach to information systems research. University of Leeds, School of Computing Research Report Series. 2000 Report 2000.23. http://citeseer.ist.psu.edu/cache/papers/cs/25784/ftp:zSzzSzftp.comp.leeds.ac.ukzSzscszSzdoczSzreportszSz2000zSz2000_23.pdf/hemingway00dialectical.pdf.
- Jacquez GM, Greiling DA, Kaufmann AM. Design and implementation of a space-time intelligence system for disease surveillance. Journal of Geographical Systems. 2005;7:7–23. doi: 10.1007/s10109-005-0150-y. [DOI] [PMC free article] [PubMed] [Google Scholar]
- Jankowski P, Nyerges T. GIS-supported collaborative decision-making: Results of an experiment. Annals of the Association of American Geographers. 2001;91:48–70. [Google Scholar]
- Jarup L, Best N, Toledano MB, Wakefield J, Elliott P. Geographical epidemiology of prostate cancer in Great Britain. International Journal of Cancer. 2002;97:695–699. doi: 10.1002/ijc.10113. [DOI] [PubMed] [Google Scholar]
- Krisp JM, Špatenková O, Ahola T. Visual error detection in geocoded point data. Working paper from the ICA commission on Visualization and Virtual Environments workshop. [Last accessed 29 August 2007];2007 “From Geovisualization toward Geovisual Analytics”, August 2nd & 3rd, Helsinki, Finland. http://kartoweb.itc.nl/icavis/2007/Krisp_Ahola_Spatenkova%20-%20Visual%20error%20detection.pdf.
- Kulldorff M. A spatial scan statistic. Communications in Statistics-Theory and Methods. 1997;26:1481–1496. doi: 10.1080/03610927708831932. [DOI] [PMC free article] [PubMed] [Google Scholar]
- Kulldorff M. Statistical methods for spatial epidemiology: Tests for randomness. In: Gatrell AC, Loytonen M, editors. GIS and Health. Taylor and Francis; London: 1998. pp. 49–62. [Google Scholar]
- Kulldorff M, Nagarwalla N. Spatial disease clusters - detection and inference. Statistics in Medicine. 1995;14:799–810. doi: 10.1002/sim.4780140809. [DOI] [PubMed] [Google Scholar]
- Langford IH. Using empirical Bayes estimates in the geographical analysis of disease risk. Area. 1994;26:142–149. [Google Scholar]
- Langford IH, Leyland AH, Rasbash J, Goldstein H. Multilevel modeling of the geographical distributions of diseases. Journal of Royal Statistical Society Series C. 1999;48:253–268. doi: 10.1111/1467-9876.00153. [DOI] [PubMed] [Google Scholar]
- Lawson AB, Williams FLR. An Introductory Guide to Disease Mapping. John Wiley & Sons; New York: 2001. [Google Scholar]
- Lovasi GS, Weiss JC, Hoskins R, Whitsel EA, Rice K, Erickson CF, Psaty BM. Comparing a single-stage geocoding method to a multistage geocoding method: how much and where do they disagree? International Journal of Health Geographics. 2007;6 doi: 10.1186/1476-072X-6-12. [DOI] [PMC free article] [PubMed] [Google Scholar]
- MacNab YC. Hierarchical Bayesian spatial modelling of small-area rates of non-rare disease. Statistics in Medicine. 2003;22:1761–1773. doi: 10.1002/sim.1463. [DOI] [PubMed] [Google Scholar]
- Maguire M. Methods to support human centered design. International Journal of Human-Computer Studies. 2001;55:587–634. [Google Scholar]
- Marshall RJ. A review of methods for the statistical analysis of spatial patterns of diseases. Journal of the Royal Statistical Society. 1991;154:421–441. [Google Scholar]
- Martínez-Piedra R, Loyola-Elizondo E, Vidaurre-Arenas M, Aguilar PN. Software programs for mapping and spatial analysis in epidemiology and public health. Epidemiological Bulletin. 2004;25:1–9. [PubMed] [Google Scholar]
- NCI. [Last accessed 29 August 2007];Geographic-based research & applications at the National Cancer Institute. 2007 http://gis.cancer.gov/nci/research.html.
- Nisbett R, Wilson T. Telling more than we can know: Verbal reports on mental processes. Psychological Review. 1977;84:231–259. [Google Scholar]
- NRC. Learning to think spatially: GIS as a support system in the K-12 curriculum. National Academies Press; Washington, DC: 2006. [Google Scholar]
- Openshaw S. Developing automated and smart spatial pattern exploration tools for geographical information systems applications. Statistician. 1995;44:3–16. [Google Scholar]
- Openshaw S, Charlton M, Craft A. Searching for leukemia clusters using a geographical analysis machine. Papers of the Regional Science Association. 1988a;64:95–106. [Google Scholar]
- Openshaw S, Charlton M, Craft AW, Birch JM. Investigation of leukemia clusters by use of a geographical analysis machine. Lancet. 1988b;1:272–273. doi: 10.1016/s0140-6736(88)90352-2. [DOI] [PubMed] [Google Scholar]
- Patton MQ. Qualitative research and evaluation methods. 3. Sage Publications; Thousand Oaks, CA: 2002. [Google Scholar]
- Pickle LW, Mungiole M, Jones GK, White AA. Exploring spatial patterns of mortality: The new Atlas of United States Mortality. Statistics in Medicine. 1999;18:3211–3220. doi: 10.1002/(sici)1097-0258(19991215)18:23<3211::aid-sim311>3.0.co;2-q. [DOI] [PubMed] [Google Scholar]
- Robinson AC. Assessing geovisualization in epidemiology: A design framework for an exploratory toolkit. Department of Geography, The Pennsylvania State University; 2005. Unpublished Master’s Thesis. [Google Scholar]
- Robinson AC. A design framework for exploratory geovisualization in epidemiology. Information Visualization. doi: 10.1057/palgrave.ivs.9500155. in press. [DOI] [PMC free article] [PubMed] [Google Scholar]
- Robinson AC, Chen J, Lengerich EJ, Meyer HG, MacEachren AM. Combining usability techniques to design geovisualization tools for epidemiology. Cartography and Geographic Information Science. 2005;32:243–255. doi: 10.1559/152304005775194700. [DOI] [PMC free article] [PubMed] [Google Scholar]
- Robinson AC, Weaver C. Re-Visualization: Interactive Visualization of the Process of Visual Analysis. Proceedings of the Workshop on Visual Analytics and Spatial Decision Support at GIScience 2006; Muenster, Germany. September 20–23; 2006. [Last accessed 29 August 2007]. http://www.ais.fraunhofer.de/and/VisA-SDS-2006/paper19.pdf. [Google Scholar]
- Rushton G. Public health, GIS, and spatial analytic tools. Annual Review of Public Health. 2003;24:43–56. doi: 10.1146/annurev.publhealth.24.012902.140843. [DOI] [PubMed] [Google Scholar]
- Rushton G, Armstrong MP, Gittler J, Greene BR, Pavlik CE, West MW, Zimmerman DL. Geocoding in cancer research. A review. American Journal of Preventive Medicine. 2006;30:S16–S24. doi: 10.1016/j.amepre.2005.09.011. [DOI] [PubMed] [Google Scholar]
- Rushton G, Lolonis P. Exploratory spatial analysis of birth defect rates in an urban population. Statistics in Medicine. 1996;7:717–726. doi: 10.1002/(sici)1097-0258(19960415)15:7/9<717::aid-sim243>3.0.co;2-0. [DOI] [PubMed] [Google Scholar]
- Schootman M, Sterling DA, Struthers J, Yan Y, Laboube T, Emo B, Higgs G. Positional accuracy and geographic bias of four methods of geocoding in epidemiologic research. Annals of Epidemiology. 2007;17:464–70. doi: 10.1016/j.annepidem.2006.10.015. [DOI] [PubMed] [Google Scholar]
- Seo J, Shneiderman B. Knowledge discovery in high dimensional data: Case studies and a user survey for an information visualization tool. IEEE Transactions on Visualization and Computer Graphics. 2006;12:311–322. doi: 10.1109/TVCG.2006.50. [DOI] [PubMed] [Google Scholar]
- Shadbolt N, O’Hara K, Crow L. The experimental evaluation of knowledge acquisition techniques and methods: History, problems and new directions. International Journal of Human-Computer Studies. 1999;51:729–755. [Google Scholar]
- Snow J. On the mode of communication of cholera. The Commonwealth Fund; New York: 1855. [Google Scholar]
- Stemler SE. A comparison of consensus, consistency and measurement approaches to estimating interrater reliability. [last accessed 29 August 2007];Practical Assessment, Research & Evaluation. 2004 9 http://PAREonline.net/getvn.asp?v=9&n=4.
- Swayne D, Cook D, Buja A. XGobi: Interactive dynamic data visualization in the X window system. Journal of Computational and Graphical Statistics. 1997;7:113–130. [Google Scholar]
- Thomas AJ, Carlin BP. Late detection of breast and colorectal cancer in Minnesota counties: An application of spatial smoothing and clustering. Statistics in Medicine. 2003;22:113–127. doi: 10.1002/sim.1215. [DOI] [PubMed] [Google Scholar]