

Abstract
Methionine adenosyltransferase (MAT) is an essential enzyme that catalyzes the biosynthesis of S-adenosylmethionine. Hepatic MAT activity falls in chronic liver diseases, and mice lacking Mat1a are predisposed to liver injury and develop hepatocellular carcinoma (HCC) spontaneously by 18 months. The current work examined the hypothesis that liver cancer stem cells contribute to HCC in this model. Livers from 6- and 18-month-old Mat1a-knockout (KO) mice and their wild-type (WT) littermates were fractionated and isolated by flow cytometry. CD45− nonparenchymal (NP) cells were cultured using liver stem cell conditions. Cells were analyzed by real-time PCR and fluorescent immunohistochemistry (FIHC). Tumor formation was assessed by injecting 1 × 10⁶ CD133+CD49f+ cells intraperitoneally into immune-deficient mice. The proportion of CD49f+ and CD133+ cells in the CD45-NP fraction increased 4.5- to 5.5-fold from 6 to 18 months in KO mice but not in their WT littermates. Compared to CD49f− cells from old KO mice, CD49f+ cells from the same animals had a markedly increased expression of several oncogenes. CD133+ cells with CD49f coexpression were selected in vitro and exhibited rapid growth, with the expression of biliary cytokeratins, α-fetoprotein, and c-Met by FIHC. Clonal expansion of single CD133+CD49f+ cells revealed maintenance of bipotency. After CD133+CD49f+ cells were injected into immune-deficient mice, 3 of the 8 mice developed tumors of liver epithelial cells after 6–8 weeks.
Conclusion
Matla−/− mice have expansion of liver stem cells as they age. These cells have increased expression of several oncogenes and are tumorigenic in vivo. This is the first demonstration of adult liver stem cells possessing tumorigenic potential without the use of a carcinogen or manipulation of tumor-suppressor or oncogene expression.
Sadenosylmethionine (SAMe) is the principal biological methyl donor and a key metabolite that regulates hepatocyte growth, differentiation, and death.1 The biosynthesis of SAMe occurs as the first step in methionine catabolism in a reaction catalyzed by methionine adenosyltransferase (MAT).2 Three distinct enzymes synthesize SAMe: MATI, MATII, and MATIII. MATI and MATIII are the gene products of MAT1A, whereas MATII is the gene product of MAT2A.3 In adult mammals, MAT1A is expressed predominantly in the liver, and MAT2A is expressed in all tissues.3
The liver plays a central role in the homeostasis of SAMe as the major site of its biosynthesis and degradation.1 SAMe is the link to 3 key metabolic pathways: polyamine synthesis, transmethylation, and transsulfuration, which converts homocysteine to cysteine, the rate-limiting precursor of GSH.1 Patients with cirrhosis have decreased SAMe biosynthesis because of lower hepatic MAT activity.4 This may contribute to a decreased hepatic GSH level in these patients as SAMe administration normalizes GSH levels.5
The Mat1a−/− mouse model allows us to study the consequences of chronic hepatic SAMe deficiency. Mat1a−/− mice have markedly increased serum methionine levels and reduced hepatic SAMe and GSH levels.6 Mat1a−/− mice are more prone to develop choline-deficient diet-induced fatty liver and develop spontaneous nonalcoholic steatohepatitis by 8 months and hepatocellular carcinoma (HCC) by 18 to 20 months.1,6 Because mice fed a diet deficient in methionine also develop steatohepatitis and are more susceptible to developing HCC, it raises the possibility that SAMe deficiency may have been responsible for these pathological changes.7 The mechanism for HCC formation in Mat1a−/− mice is unknown.
Methyl-deficient diets have been used to induce oval cell proliferation and HCC formation in susceptible models such as p53−/− mice.8 Oval cells (OCs) are liver stem cells found in the nonparenchymal (NP) fraction of the liver and reside near the terminal bile ducts, at the hepatocyte–cholangiocyte interface.9 In normal adult liver, OCs are quiescent and few in number and proliferate only during severe, prolonged liver injury and in various models of experimental carcinogenesis.10 OCs isolated from p53-null mice treated with a choline-deficient ethionine-supplemented diet induced tumors in athymic mice.8 There are no reports of tumorigenic progenitor cells isolated from adult mouse liver not involving the use of a carcinogen or manipulation of tumor-suppressor/oncogene expression.
Various markers have been used to characterize murine OCs. In this work, we focused on CD49f and CD133 as cell surface markers of OCs. CD49f has been used as a cell surface marker of fetal hepatoblasts.11 CD49f represents α-6 integrin on epithelial cells, binding to laminins in the basement membrane.12 CD133, or Prominin1, is a membrane protein found on several types of adult stem cells13 and cancer stem cells.14 Single-cell analysis confirmed the bilineage potential of CD133+CD45− OCs isolated from the 3,5-diethoxycarbonyl-1,4-dihydro-collidine (DDC)–induced chronic liver damage model.15
Our hypothesis is that liver cancer stem cells contribute to carcinoma formation in the Mat1a−/− mouse, a model of chronic liver injury. We used cell surface markers and flow cytometry to identify and isolate a novel population in an OC-enriched fraction. These populations were characterized by gene expression and fluorescent immunohistochemistry. In vitro analysis confirmed an OC phenotype, and an in vivo tumorigenic assay demonstrated that these cells are capable of forming epithelial tumors.
Materials and Methods
Mat1a−/− and NOD/SCID/Gamma-Chain-Null Mice
Mice were fed ad libitum a standard diet (Harlan Teklad irradiated mouse diet 7912, Madison, WI) and housed in a temperature-controlled animal facility with a 12-hour light/12-hour dark cycle. Animals were treated humanely, and all procedures were in compliance with our institution’s guidelines for the use of laboratory animals and were approved by the Institutional Animal Care and Use Committee. Six- month-old and 18-month-old Mat1a−/− mice and their wild-type (WT) littermates were used for all experiments as described.6 Six-week-old NOD/SCID/ Gamma-chain-null mice (The Jackson Laboratory, Bar Harbor, ME) were used for tumor formation analysis.
Parenchymal and Nonparenchymal Cell Separation
The protocol for the digestion and centrifugation of the liver cells was modified from Shimano,16 as described.17 Liver was minced and digested with collagenase, pronase, and DNAse (Sigma, St. Louis, MO) and filtered using a 70-μm pore filter (BD Biosciences, Franklin Lakes, NJ). After suspension in 10% fetal bovine serum (Omega Scientific, Tarzana, CA) in phosphate-buffered saline (PBS; Mediatech, Herdon, VA), cells were centrifuged using a BD GS-6R centrifuge.17 The final NP cell pellet was resuspended in a 1× ammonium chloride red blood cell (RBC) lysis buffer (PharMLyse, BD Pharmingen, San Diego, CA) and washed, and the NP cells were counted and subjected to CD45 depletion using Miltenyi magnetic bead depletion per the manufacturer’s protocol (Miltenyi Biotech, Auburn, CA).
FACS Analysis of the Oval Cell–Enriched NP Fraction
Freshly isolated liver NP cells (1 × 10⁶) that were RBC and CD45 depleted were resuspended in PBS. Alternatively, cells in culture were trypsinized for 3 minutes and then washed once in culture medium and a second time in PBS. Following Fc blocking, combinations of the following flow cytometry (FACS) antibodies were added: CD45 fluorescein isothiocyanate (FITC), phycoerythrin (PE), and allophycocyanin (APC); CD34 FITC and PE; Thy 1.2 FITC and PE; c-Kit FITC; Sca-1 FITC and PE; CD49f PE (BD Pharmingen); and CD133 FITC and PE (eBioscience, San Diego, CA), incubated at 4°C for 30 minutes. Cells were washed with PBS prior to analysis using a FACSCalibur (BD Bioscience). Cells isolation was conducted on a FACS Vantage (BD Bioscience). Compensation for FITC, PE, and APC was performed using compensation beads (BD Pharmingen). Analysis was done using the Flow-Jo program (Tree Star, Ashland, OR). Positive and negative gates were determined using IgG stained and unstained controls.
Real-Time Polymerase Chain Reaction of FACS Isolated Cells
CD49f+CD45− and CD49f−CD45−NP liver cells were isolated on a BD FACS-Vantage. Cells were pelleted at 200g for 5 minutes, and total RNA was extracted using an RNA Easy Kit (Qiagen, Valencia, CA) per the manufacturer’s protocol. RNA was quantified using an ND-1000 spectrophotometer (Nanodrop Technologies, Wilmington, DE). Then 200 ng of purified mRNA per 20-μL reaction volume was used to construct first-strand cDNA using an oligo (dT) reverse-transcriptase kit at 37°C for 60 minutes (Invitrogen, Carlsbad, CA). Real-time experiments were conducted using an ABI-Prism 7700 Thermal Cycler and TaqMan Universal PCR Master Mix (Applied Biosystems, Foster City, CA). Housekeeping genes included β-actin, hypoxanthine phosphoribosyl-transferase 1, and ubiquitin C; and a geometric mean of housekeeping Ct values was used for all ΔΔCt calculations.18 Relative expression was calculated for the genes albumin, Ck19, Hnf4α, c-Met, epidermal growth factor receptor (Egfr), cyclin D1, Kras, Nras, Survivin, c-Myc, Mat2a, and Abcg2, which were assessed using real-time PCR primer/probe sets (Applied Biosystems). Amplification efficiency of the amplification plots was determined by the ΔΔCt method.19
Cell Culture
CD45− cells were isolated from the NP fraction using magnetic bead separation as described in the Parenchymal and Nonparenchymal Cell Separation section. This CD45− NP cell fraction was labeled with CD133 magnetic bead antibodies (Miltenyi), and CD133+CD45− cells were isolated using positive cell selection per the manufacturer’s protocol. This enriched population of CD133+CD45− cells was plated in Bio-Coat 6-well laminin-coated culture plates (BD Bioscience) at a density of 1 × 10⁴ cells/cm2. The culture medium was modified from Suzuki.12 The medium contained DMEM:F12 at 1:1 (Sigma) with 10% fetal bovine serum, was heat inactivated (Omega Scientific, Tarzana, CA), and had the following additives: insulin (1 mg/mL), dexamethasone (1 × 10⁻⁷ mol/L), nicotinamide (10 mmol/L), Hepes (5 mmol/L), and penicillin/streptomycin (1% [vol/vol]), all from Sigma. Recombinant hepatocyte growth factor (HGF; 50 ng/mL) and epidermal growth factor (EGF; 20 ng/mL), both from Sigma, were added on day 1. The medium was changed every 3 days. For alkaline phosphatase analysis, cells were fixed in 90% methanol/10% formalin (Sigma) for 1 minute and stained using an Alkaline Phosphatase Detection Kit (Chemicon International, Temecula, CA).
Gene Expression of CD133+CD49f+CD45−Cells
RNA was extracted directly from the culture well using an RNA Easy Kit (Qiagen). Two hundred nanograms of purified RNA per 20-μL reaction volume was used in the synthesis of first-strand cDNA as described previously. PCR was conducted using the primers listed in Table 1. All primers were selected in 2 separate exons to distinguish cDNA from possible contaminating genomic DNA, and PCR conditions were used as described.17
Table 1.
Primers Used for Real-Time PCR
| Gene | Forward primer | Reverse primer |
|---|---|---|
| β-Actin | 5′-TGTTACCAACTGGGACGACA-3′ | 5′-GGGGTGTTGAAGGTCTCAAA-3′ |
| Albumin | 5′-CATGCCAAATTAGTGCAGGA-3′ | 5′-GCTGGGGTTGTCATCTTTGT-3′ |
| Tyrosine aminotransferase | 5′-CCCTACTGTGTTTGGGAACC-3′ | 5′-GGAGCCTCAGGACAGTGGTA-3′ |
| α1-Antitrypsin | 5′-GGGTGCTGCTGATGGATTAC-3′ | 5′-GGACAGTCTGGGGATATGGA-3′ |
| Cytokeratin 19 | 5′-TGCTGGATGAGCTGACTCTG-3′ | 5′-AATCCACCTCCACACTGACC-3′ |
| Biliary glycoprotein | 5′-CACAAGGAGGCCTCTCAGAT-3′ | 5′-GCTGAGGGTTTGTGCTCTGT-3′ |
| Abcg2 transmembrane pump | 5′-AGCAGCAAGGAAAGATCCAA-3′ | 5′-GGAAGTCGAAGAGCTGCGA-3′ |
| Cyclin D1 | 5′-TTGACTGCCGAGAAGTTGTG-3′ | 5′-CTGGCATTTTGGAGAGGAAG-3′ |
| Hnf4αα | 5′-ACTACGGAGCCTCGAGCTGT-3′ | 5′-AGCCCGGAAGCACTTCTTA-3′ |
| Survivin | 5′-CTGATTTGGCCCAGTGTTTT-3′ | 5′-CTTGGCTCTTGTCTGTCCA-3′ |
| c-Met | 5′-TCTCGAACAGCACACCTCAC-3′ | 5′-AGAGGCACTGACTGCAGGAT-3′ |
| Alpha fetoprotein | 5′-TCAAGAACTCACCCCAACCT-3′ | 5′-GGCTCTCCTCGATGTGTTTC-3′ |
| α-Smooth muscle actin | 5′-GCCGAGATCTCACCGACTAC-3′ | 5′-CTTCTCCAGGGAGGAAGAGG-3′ |
| Desmin | 5′-TCGCGGCTAAGAACATCTCT-3′ | 5′-GCATCAATCTCGCAGGTGTA-3′ |
| CD45 | 5′-TCACAAGCATGCATCCATCC-3′ | 5′-TTCCAAGAGATTGAACAAGGCA-3′ |
Single-Cell Analysis
For single-cell experiments, DAPI was used as a marker of cell viability. Single CD133+CD49f+CD45−DAPI− OCs (n = 192) were isolated using a FACS Vantage set for Single Cell Purity, and single cells were each robotically plated directly in a 96-well flat-bottomed, laminin-coated plate (BD Bioscience) with 100 μL of medium/well as described.20 After 24 hours, an additional 100 μL of medium was added to each well. Approximately half the medium was replaced after 1 week. After 3 week in culture, single-cell-derived colonies that filled more than 50% of the well area had RNA extracted for RT-PCR analysis (n = 4 for PCR analysis).
Tumor Formation Assay
CD133+CD49f+CD45− cells and CD133-CD49f+CD45− cells were isolated from bulk culture as already described and counted with trypan blue exclusion to determine numbers of live cells. Cells were resuspended in PBS for transplant at a concentration of 1 × 10⁶ live cells/50 μL. Six-week-old immune-deficient NOD/SCID/Gama-chain-null mice were injected intraperitoneally as described.14 Mice were sacrificed after 6 to 8 weeks, and liver, spleen, and tumors were isolated for immunohistochemistry.
Immunohistochemistry
Fluorescent immunohistochemistry (FIHC) was performed on perpendicular wedges of liver, spleen, and tumor after injection with CD133+CD49f+CD45− and CD133-CD49f+CD45− cells. Tissues were fixed and paraffin embedded as described.21 After antigen retrieval (Vector Unmasking Solution, Vector Labs, Burlingame, CA), the slides were incubated with Tris-buffered saline (TBS;pH 7.5, 100 mM Tris, 150 mM NaCl) + 0.1% Triton X solution. Slides were blocked for nonspecific binding using TBS + 0.1% Tween 20 (TBST;Sigma) with 1% bovine albumin (Sigma) and 5% normal donkey serum (Jackson ImmunoResearch, West Grove, PA). Slides were incubated with primary antibody overnight at 4°C (concentration in TBST 1% BSA): rabbit anti-cow pancytokeratin (pan-CK; 1:400; DAKO, Carpintera, www.dako.com),22 rabbit antimouse albumin (1:200; Accurate Chemical and Scientific, Westburry, NY), rat antimouse A6 (1:10; generous gift of Dr. V. Factor), mouse antimouse alpha-fetoprotein (AFP; 1:100; R&D Systems, Minneapolis, MN), and rat antimouse CD45 (1:100; AbCam, Cambridge, MA). Slides were washed twice and incubated with secondary antibodies at room temperature for 2 hours. Secondary antibodies (concentration in TBST 1% BSA) included: donkey antirabbit FITC or Cy3, donkey antirat Cy3, and donkey antimouse Cy3 (all 1:200; AbCam). The slides were washed and mounted with coverslips using Vectashield with DAPI (Vector). All FIHC experiments were conducted with negative and positive controls.
Microscopy
Images were viewed with a Leica DMRA microscope using a Plan Apo 40×/1.25 NA phase 3 DIC or Plan Apo 63 X/1.32 oil immersion objective lens (Leica Microsystems, Wetzlar, Germany). The microscope was equipped with a Shutter LS175W ozone-free xenon arc lamp (Shutter Instrument, Novato, CA). Images were acquired with an Applied Spectral Imaging Sky Vision-2/ VDS camera from EasyFISH software (Applied Spectral Imaging, Vista, CA) and printed using Adobe Photoshop (Adobe Systems, San Jose, CA).
Statistical Analyses
The paired 2-tailed Student t test was used when comparing 2 groups. A P value less than 0.05 was considered significant. ANOVA analysis was used for comparison of multiple groups, followed by pairwise multiple comparison procedures (Systat Software, Richmond, CA).
Results
Expansion of Oval Cells with Age in Mat1a−/− Mice
Six- and 18-month-old Mat1a−/− mice were analyzed for degree of injury and OC proliferation using hematoxyin and eosin (H&E) staining and pan-CK FIHC as an OC marker.10 In 6- and 18-month-old WT animals, H&E staining revealed no injury, steatosis, or OC proliferation (Fig. 1A). In the Mat1a−/− mice, H&E staining revealed significant injury and steatosis, with OCs expanding from portal zones in the 18-month-old mice (Fig. 1B). This injury and morphological OCs in old Mat1a−/− mice correlated with increased panCK staining in the same animals (Fig. 1E). This degree of OC proliferation was consistent with DDC-induced injury, a common method of inducing OC proliferation (Fig. 1C,F).23 There was no evidence of gross or microscopic tumor in any of the animals assessed.
Fig. 1.
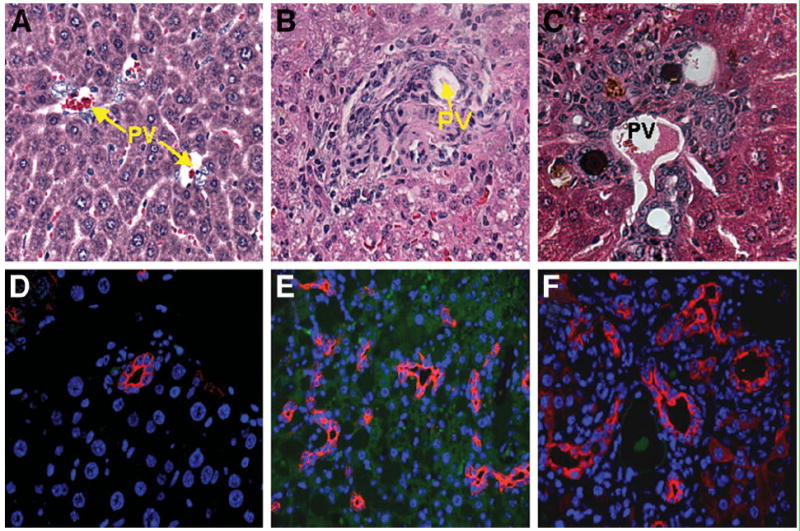
Increase in oval cells in old Mat1a−/− mice. H&E staining in (A) undamaged control, (B) 18 month-old Mat1a−/−, and (C) DDC injury model (8 weeks) demonstrating oval cell expansion during chronic injury. Cytokeratin staining in (D) undamaged control, (E) 18-month-old Mat1a−/−, and (F) DDC injury model (8 weeks) highlighting areas of oval cell expansion in the chronic injury models. Cytokeratin stain did not stain for hepatocytes (20× objective; PV, portal vein).
For FACS analysis, CD45 depletion removed all CD45+ hematopoietic cells prior to analysis. FACS analysis of the NP OC-enriched fraction has been previously described in isolating CD133+CD45− OCs.15 Using FACS analysis, a comparison of 6- and 18-month-old mice demonstrated a significant increase in CD133+CD45− and CD49f+CD45− NP cells (6-month WT CD133+, 4% ± 2%, and CD49f+, 3.5% ± 2%; 6-month knockout [KO] CD133+, 6.5% ± 3%, and CD49f+, 6% ± 3%; 18-month WT CD133+, 5.5% ± 2%, and CD49f+, 5% ± 3%; and 18-month KO CD133+, 26% ± 7%, and CD49f+, 23% ± 5%; P < 0.05 for 18-month KO group compared with other groups using ANOVA, n = 4 mice/group; Fig. 2A–E). When CD133 and CD49f were analyzed simultaneously, 9% ± 4% cells coexpressed both CD133 and CD49f in old KO mice.
Fig. 2.
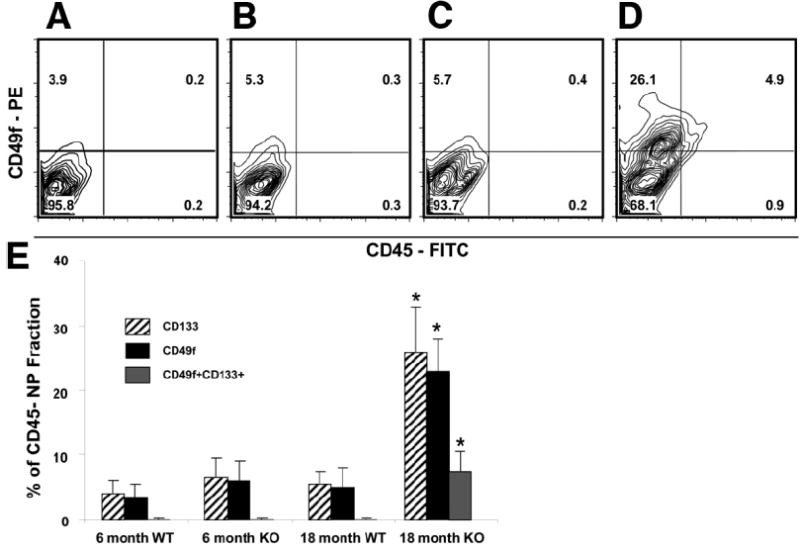
Significant increase in CD49f and CD133 expression in old Mat1a−/− mice. Representative FACS analysis plots of CD49f-PE and CD45-FITC staining from the liver NP CD45-depleted fraction: (A) 6-month-old WT, (B) 6-month-old KO, (C) 18-month-old WT, and (D) 18-month-old Mat1a−/−. (E) Summary table of CD133 and CD49f expression in the liver NP CD45-depleted fraction (n = 4/group, *P < 0.05 for CD133 and CD49f from 18-month-old Mat1a−/− compared with every other group using ANOVA; PE, phycoerythrin; FITC, fluorescein isothiocyanate; NP, nonparenchymal).
Increase in Oncogene Expression in CD49f+CD45−Cells Isolated from Old Mat1a−/− Mice
CD49f+CD45− and CD49f−CD45− cells were FACS isolated from young and old WT and Mat1a−/−mice (n = 3/group). CD49f+CD45− NP cells from 18 month-old Mat1a−/− mice demonstrated the highest relative levels of Kras, Nras, Survivin, and Egfr compared with any other group. When isolated from the same old Mat1a−/− mouse, CD49f+CD45− NP cells demonstrated a marked increase in the expression of Kras (8-fold) and Survivin (8-fold) mRNA compared with CD49f−CD45− NP cells (Fig. 3B). The same population of CD49f+CD45− NP cells from 18-month-old Mat1a−/− mice demonstrated increased expression of oncogenes and cyclin D (5.4-fold) when compared with CD49f+CD45− NP cells isolated from 6-month-old Mat1a−/− mice (Fig. 3C), indicating a mechanism of proliferation during the aging process. CD49f+CD45− cells from 18-month-old Mat1a−/− mice demonstrated an increase in Mat2a expression (4.5-fold) compared with that in the same population isolated from WT animals (Fig. 3D).
Fig. 3.
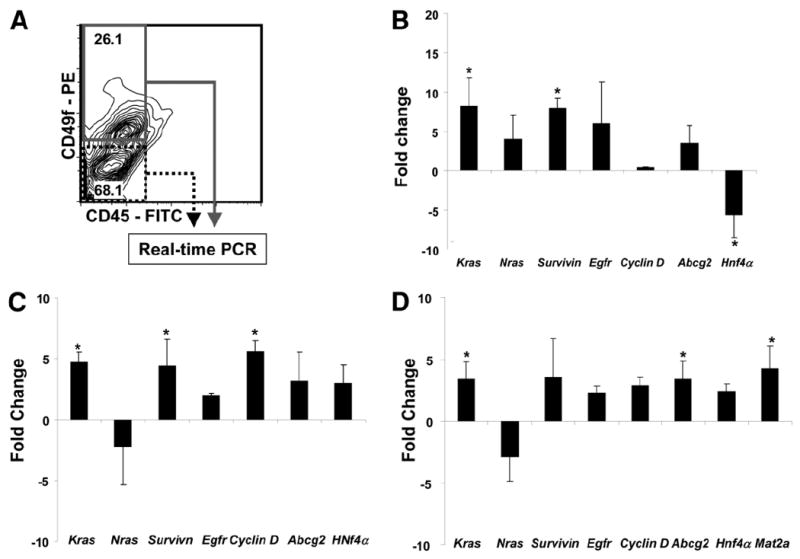
Increased oncogene- and OC-associated genes in CD49f+CD45− cells isolated from 18-month-old Mat1a−/− mice. (A) Representative FACS plot showing isolation gates used for gene expression analysis. (B) Magnitude of change in gene expression in CD49f+CD45− cells compared with that in CD49f−CD45− cells from 18-month-old Mat1a−/− mice. (C) Magnitude of change in gene expression in CD49f+CD45− cells from 18-month-old Mat1a−/− compared with that in CD49f+CD45− cells from 6-month-old Mat1a−/− mice. (D) Magnitude of change in gene expression in CD49f+CD45− cells from 18-month-old Mat1a−/− mice compared with that in 18-month-old WT mice. Real-time PCR experiments were conducted in triplicate and with 3 housekeeping genes for expression calculations, and significance was calculated using ANOVA as described18 (n = 3, each test in triplicate; *P < 0.05 using ANOVA analysis).
Enrichment of CD133+CD49f+ Oval Cells
To further characterize lineage potential, CD133+CD45− OCs were isolated from 18-month-old Mat1a−/− mice using a 2-step enrichment process of magnetic filtration. After enrichment, CD133+CD45− OCs (85% with CD49f coexpression) were plated in 6-well, laminin-coated tissue culture plates using a fetal hepatoblast-derived medium.12 Laminin-coated plates allow for further selection of CD49f+ cells. On day 1, small, round cells were observed adhering to the plate (Fig. 4A). After 1 week in culture, clusters of cells were observed growing, with most cells having a morphology that ranged from flat, cuboidal cells in sheets to more elongated cells with projections (Fig. 4D). After 1 week in culture, the cells were 90% confluent, and were trypsinized and replated 1:3. Early-passage cells (passages 1–4) cultured in identical conditions without HGF and EGF failed to form colonies.
Fig. 4.
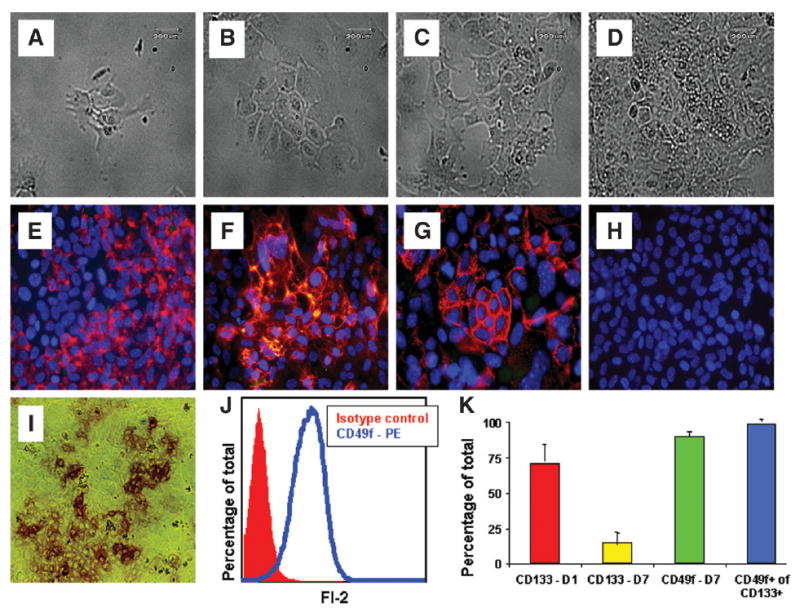
Functional analysis of CD133+CD45− cells. Phase images show CD133+CD49f+CD45− cells on (A) day 1, (B) day 3, (C) day 5, and (D) day 7. FIHC of CD133+CD49f+CD45− cells 1 week postplating with (E) AFP, (F) pan-cytokeratin (pan-CK), (G) A6, and (H) CD45. (I) Alkaline phosphatase (Alk-phos) activity demonstrated in clusters of CD133+CD49f+CD45− cells 1 week postplating (20× objective). (J) FACS analysis histogram demonstrating 90% of all OCs plated on laminin-coated culture dishes were CD49f+, compared with isotype (IgG-PE)–stained cells. (K) Summary data of FACS analysis showing gradual loss of CD133 from 71% ± 12% to 15% ± 7%, maintenance of CD49f expression at 90%, and the relative percentage of CD49f+ expression in CD133+ cells was 99.0% ± 0.4%; PE, phycoerythrin; D1, day 1; D7, day 7.
Characteristics of Plated CD133+CD49f+ Cells
After 6 months of replating, the basic morphology of the cells was maintained. In terms of CD49f, 90.3% ± 2.8% of cells expressed CD49f+ in passages 20–24, indicating stable expression from early to late passage (Fig. 4J,K). In contrast, C133 expression was not stable in vitro. In early-passage cells (passages 1–4), the expression of CD133 decreased after positive selection, to a stable baseline of 15% after 1 week. Using a process of positive selection to isolate CD133+ cells from later-passage (passages 20–24) cultures revealed a similar loss of CD133 expression over time, with a starting population of 71% ± 12% CD133+ cells immediately postisolation and a gradual decline in CD133 expression to 15% after 7–10 days (Fig. 4K). Of the CD133+ cells in these later-passage cultures, 99.0% ± 0.4% coexpressed CD49f+ (Fig. 4K).
In terms of functional analysis of later-passage cells, alkaline phosphatase staining demonstrated single cells and clusters of cells with alkaline phosphatase activity (Fig. 4I). Alkaline phosphatase staining has been used to identify primitive embryonic stem cells as well as biliary epithelium.24,25 These same cells also demonstrated AFP and A6 staining, both markers of OCs (Fig. 4E,G).
Costaining of hepatocyte (AFP) and cholangiocyte (CK) markers was conducted to confirm the oval cell phenotype in vitro. Of the 1000 cells counted, 74% ± 8% were positive for CK, 49% ± 10% were positive for AFP, and 33% ± 4% were double positive for both markers (Fig. 5). This analysis confirms maintenance of a bipotent population of oval cells in later-passage cells. Because later-passage cultures had selected for CD49f and 99% of the CD133+ cells coexpresssed CD49f, we elected to further analyze the specific fraction of CD133+CD49f+ cells from later-passage cultures (passages 20–24).
Fig. 5.
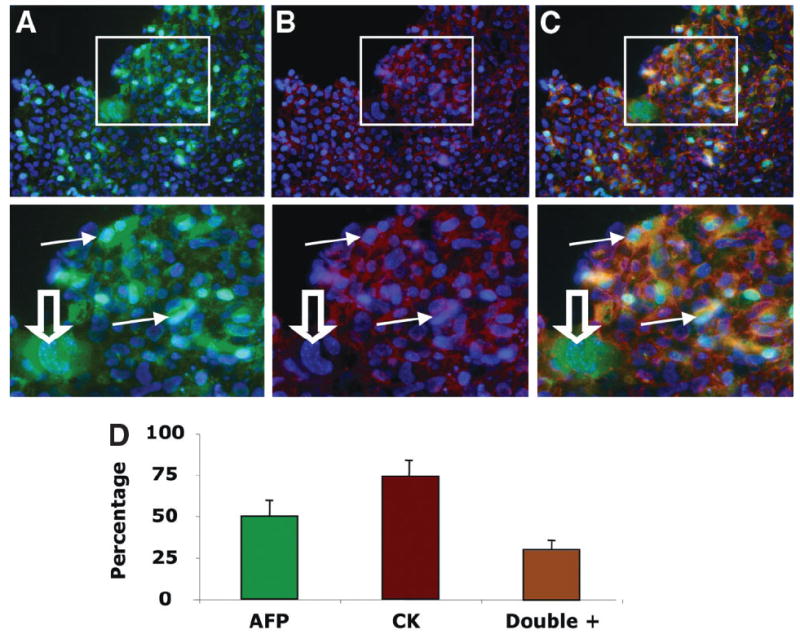
Costaining of CD133+CD45− cells with hepatocyte and cholangiocyte markers. Staining for (A) AFP (green, magnified below) and (B) panCK (red, magnified below) with nuclei (blue). (C) Merged image demonstrates multiple cells with staining for both AFP and pan-CK (orange, magnified below) highlighted with solid arrows; open arrow, AFP+ hepatocyte-like cell without pan-CK staining (20× objective). (D) Summary graph with percentage of each marker and costaining frequency (n = 1,000 cells counted in 5 slides).
Single-Cell Isolation Defines Bipotency in CD133+CD49f+CD45− Ocs
Single cells were isolated by FACS using automated plating robotics. CD133+CD49f+CD45−DAPI− cells were selected from late-passage cultures (passages 20–24, Fig. 6A). Of 192 individual cells plated, 28 (14.5%) demonstrated colonies growing over more than 50% of the well bottom after 2 weeks. These colonies were replated into 6-well plates, and the basic cell morphology matched that of the original culture, with flat, cuboidal cells (Fig. 6B,C). After 2 weeks, 100% of analyzed colonies demonstrated expression of both hepatocyte (Albumin and α1-Antitrypsin) and cholangiocyte (Ck19, γGt, and aquaporin 1) markers, as well as strong expression of oval cell–associated genes (Hnf4α, Hnf1β, and Abcg2).26 All CD133+CD49f+CD45− clones demonstrated strong expression of both c-Met and Egfr. Last, no expression of hematopoietic (Cd45) or stellate cell (α-smooth muscle actin and desmin) markers were demonstrated in CD133+CD49f+CD45− clones (n = 4 clones analyzed, Fig. 6D).
Fig. 6.
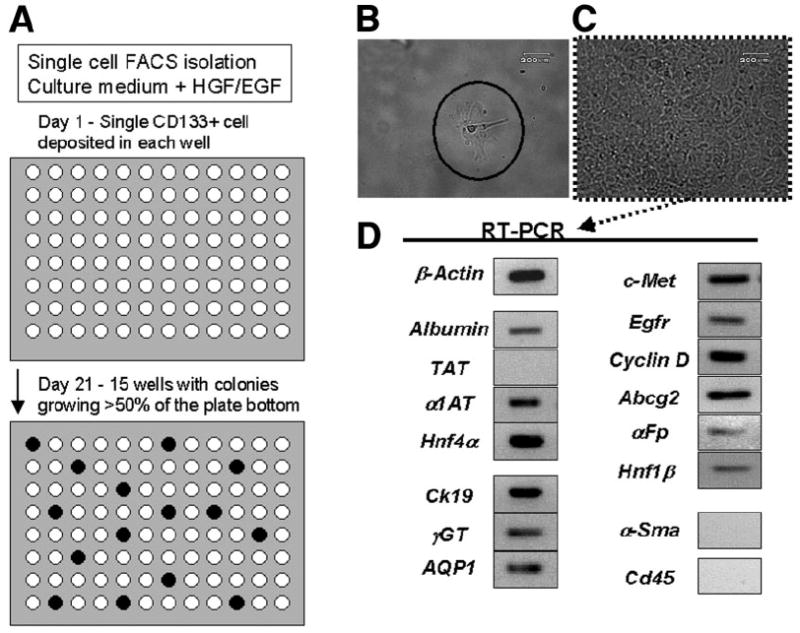
Single-cell clonal expansion of CD133+CD49f+CD45− oval cells. (A) Flow diagram showing FACS isolation and robotic plating of single CD133+CD49f+CD45−DAPI– oval cells onto 96-well laminin-coated plates. After 3 weeks, 15 of 96 wells demonstrated robust colonies growing in more than 50% of the well. (B) Phase image (20× objective) of single cells on day 1. (C) Phase image (20× objective) of single cells on day 21. (D) Gene expression profile on day 21 indicating bilineage potential with expression of both hepatocyte and cholangiocyte markers, oval cell–associated genes, and absence of stellate cell and hematopoietic cell markers in progeny from single cell. (Gene primer pairs for PCR: β-actin, albumin; TAT, tyrosine aminotransferase; α1AT, α1-antitrypsin; Hnf4α, hepatocyte nuclear factor 4α; CK19, cytokeratin 19; γGT, γ-glutamyl transpeptidase; AQP1, aquaporin 1; c-Met, hepatocyte growth factor receptor; Egfr, epidermal growth factor receptor; cyclin D1, Abcg2, αFp, alpha-fetoprotein; Hnf1β, hepatocyte nuclear factor 1β; α-Sma, α-smooth muscle actin; CD45).
Tumor Formation from CD133+CD49f+CD45− Cells
To assess the tumor-forming ability of CD133+CD49f+CD45− versus CD133−CD49f+CD45− cells isolated from late-passage cultures, a tumor model with immune-deficient mice was used.14 One million CD133+CD49f+CD45− or CD133−CD49f+CD45− cells isolated from late-passage cultures were injected intraperitoneally into immune-deficient mice (n = 8/group). No CD133−CD49f+CD45− cells formed tumors after 6–8 weeks. Three (37.5%) of the CD133+CD49f+CD45− cell injections resulted in tumor formation. Two of the tumors detected after 6 weeks were single 4-mm tan, round nodules growing on the mesentery, and the third tumor was a 15-mm tan growth on the liver detected 8 weeks after injection (Fig. 7A). Histology and FIHC of the mesenteric tumors demonstrated immature, small, round cells with cytokeratin staining (Fig. 7D,E). Very little CD45 was demonstrated in these tumors (Fig. 7F). The larger liver tumor consisted of poorly organized hepatocyte-like cells with albumin staining (Fig. 7B,C). Positive control staining included normal liver for cytokeratin and spleen for CD45. FACS analysis of the largest tumor demonstrated that most cells were both CD133+ (60.4%) and CD49f+ (77.2%). No gross lung tumors or nodules were observed in any animals.
Fig. 7.
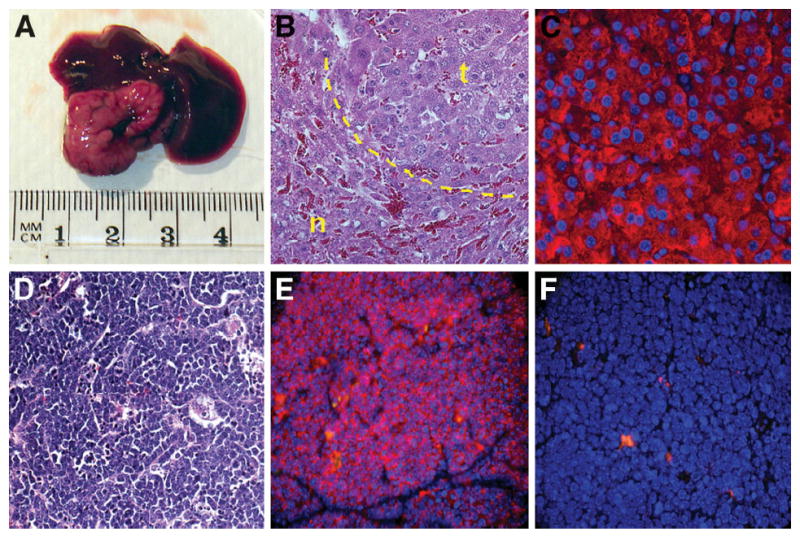
Tumor potential of CD133+CD49f+CD45− oval cells. (A) A 1.5-cm tumor growing 8 weeks after IP injection of 1 × 10⁶ CD133+CD49f+CD45− OCs. (B) H&E staining of this large liver tumor with normal tissue (n) and tumor tissue (t). Tumor cells appear as disorganized hepatocytes adjacent to normal hepatocytes. (C) Tumor cells demonstrating strong albumin staining consistent with a hepatocyte-like phenotype. (D) H&E staining of smaller mesenteric tumors from separate injections of the same cells demonstrating small, compact primitive cells. (E) pan-Cytokeratin FIHC demonstrating these small mesenteric tumors to be epithelial (F) without CD45 staining.
Discussion
The relationship between OCs and liver cancer stem cells is poorly understood. In his review, Sell proposed 2 main cellular origins of hepatocellular carcinomas: the mature hepatocyte causing HCC and the bipotent cancer stem cell causing HCCor mixed tumors.27 Progenitor or OC-derived carcinomas tend to have a more aggressive phenotype, with as many as 50% of HCCs defined as having a progenitor cell phenotype, expressing makers of both hepatocytes and cholangiocytes.28 Although this model of aggressive HCC with a stem cell phenotype has been validated in murine models and human patients, a defined population of liver cancer stem cells remains elusive.29
The ability to identify and isolate adult liver stem cells is an essential first step in studying their potential for cancer formation.30 In the past, investigators identified OCs based on their histological location, risking the inclusion of hematopoietic cells in the analysis. In models of liver damage, such as Mat1a−/− mice, which have hepatic infiltration of inflammatory cells, separation of hematopoietic cells from liver cells is critical prior to analysis.17 In defining a reliable OC immunophenotype, the surface markers previously attributed to OCs, such as c-kit and CD34, are traditionally assigned to hematopoietic stem cells.31 Single-cell gene expression analysis has recently confirmed the bilineage potential of CD133+CD45− OCs isolated from the DDC toxic injury model.15 Single-cell clonal studies in fetal liver have identified fetal hepatoblasts with CD49f expression that are capable of both cholangiocyte and hepatocyte differentiation in vivo.11 Our current work is the first to use single-cell FACS isolation and clonal expansion to demonstrate bilineage potential in liver cells isolated from adult animals. CD133+CD49f+CD45− cells consistently demonstrated both hepatocyte and cholangiocyte markers, and 100% of CD133+CD49f+CD45− single-cell clones demonstrated bilineage potential.
The cell surface marker CD133 has been associated with both multipotent stem cells and cancer stem cells of epithelial origin.32 CD133, or Prominin 1, was originally described in 1997 as being localized to the apical membrane protrusions of murine neuroepithelial cells.33 A marker with similar homology was described later on the surface of human hematopoietic stem cells.13 Both human and mouse CD133 have 5 membrane-spanning domains and share 60% homology at the protein level.34 CD133 mRNA was detected in rat OCs, isolated by size, as part of a microarray screen.35
In our in vitro analysis, we initially plated CD133+CD45− OCs on laminin-coated culture dishes to further select for CD49f+ cells. Freshly isolated CD49f+CD45− cells from old Mat1a−/− mice demonstrated the highest levels of HCC-associated oncogenes such as Kras and Survivin. We also demonstrate that CD133 identifies a subpopulation of CD49f+ NP cells isolated from adult liver, with the traditionally accepted morphology and size of OCs. CD133+CD49f+CD45− OCs proliferated and significantly expanded in number in vitro. Furthermore, these cells have tumorigenic potential when injected into immunodeficient mice. The histology of tumors that formed was mixed; the smaller mesenteric tumors were undifferentiated epithelial carcinomas, whereas the largest tumor was more consistent with a hepatocellular carcinoma. FACS analysis of the largest tumor showed that most cells were both CD133+ and CD49f+, confirming the origin of the tumor from CD133+/CD49f+ cells. This is the first report of tumorgenic OCs without manipulation of oncogenes or use of a carcinogenic regimen.8
Expansion of OCs with age in Mat1a−/− mice is consistent with the known effects of a methyl-deficient diet’s ability to induce OC proliferation.10,36 These diets would be expected to also lower hepatic SAMe level. Whether expansion of the OCs occurred because of increased oxidative stress or liver injury or because of chronic SAMe deficiency is unknown. The possibility that SAMe can directly influence the growth of OCs is real, as SAMe is an important regulator of hepatocyte growth.1 In hepatocytes, SAMe level is related to differentiation status, being high in quiescent and low in proliferating hepatocytes. A fall in SAMe level occurs early after partial hepatectomy,37 and if prevented, liver regeneration is impaired.38 We have shown recently that SAMe inhibits hepatocyte growth by blocking the effect of HGF.39 Thus, in chronic hepatic SAMe deficiency such as that in Mat1a−/− mice, there is increased baseline cyclin D expression and other growth markers.38 The exact molecular mechanisms and signaling pathways responsible for the expansion of OCs in this mouse model will require further investigations.
In summary, we have demonstrated expansion of liver progenitor cells in the Mat1a−/− mice during aging. These cells have been singly isolated, analyzed, and clonally expanded. The CD133+ fraction of CD49f+ cells exhibited in vivo tumorigenic potential. These findings are highly relevant to patients with cirrhosis in whom MAT1A expression is often low or absent and the risk of HCC is high. Our results suggest that expansion of liver cancer stem cells can occur in the setting of chronic hepatic SAMe deficiency, and this can contribute to HCC formation.
Acknowledgments
Supported by AGA/AstraZeneca Fellow/Faculty Transition Award (to C.B.R.); NICHD Fellow of the Pediatric Scientist Development Program (NICHD Grant Award K12-HD00850 (to C.B.R.); USC Research Center for Liver Diseases Pilot Feasibility grant DK48522 (to C.B.R. and G.M.C.); NIH grants DK51719 (to S.C.L.), AA12677, AA13847, and AT1576 (to S.C.L. and J.M.M.); Plan Nacional of I+D SAF 2005-00855 and HEPADIP-EULSHM-CT-205 (to J.M.M.)
Abbreviations
- AFP
alpha-fetoprotein
- FACS
flow cytometry
- FIHC
fluorescent immunohistochemistry
- FITC
fluorescein isothiocyanate
- HCC
hepatocellular carcinoma
- KO
knockout
- MAT
methionine adenosyltransferase
- NP
nonparenchymal
- OC
oval cell
- PBS
phosphate-buffered saline
- PE
phycoerythrin
- SAMe
S-adenosylmethionine
- WT
wild type
Footnotes
Published online in Wiley InterScience (www.interscience.wiley.com).
Potential conflict of interest: Nothing to report.
References
- 1.Mato JM, Lu SC. Role of S-adenosyl-L-methionine in liver health and injury. Hepatology. 2007;45:1306–1312. doi: 10.1002/hep.21650. [DOI] [PubMed] [Google Scholar]
- 2.Cantoni GL. Biological methylation: selected aspects. Annu Rev Biochem. 1975;44:435–451. doi: 10.1146/annurev.bi.44.070175.002251. [DOI] [PubMed] [Google Scholar]
- 3.Mato JM, Corrales FJ, Lu SC, Avila MA. S-Adenosylmethionine: a control switch that regulates liver function. FASEB J. 2002;16:15–26. doi: 10.1096/fj.01-0401rev. [DOI] [PubMed] [Google Scholar]
- 4.Mato JM, Camara J, Fernandez de Paz J, Caballeria L, Coll S, Caballero A, et al. S-adenosylmethionine in alcoholic liver cirrhosis: a randomized, placebo-controlled, double-blind, multicenter clinical trial. J Hepatol. 1999;30:1081–1089. doi: 10.1016/s0168-8278(99)80263-3. [DOI] [PubMed] [Google Scholar]
- 5.Vendemiale G, Altomare E, Trizio T, Le Grazie C, Di Padova C, Salerno MT, et al. Effects of oral S-adenosyl-L-methionine on hepatic glutathione in patients with liver disease. Scand J Gastroenterol. 1989;24:407–415. doi: 10.3109/00365528909093067. [DOI] [PubMed] [Google Scholar]
- 6.Lu SC, Alvarez L, Huang ZZ, Chen L, An W, Corrales FJ, et al. Methionine adenosyltransferase 1A knockout mice are predisposed to liver injury and exhibit increased expression of genes involved in proliferation. Proc Natl Acad Sci U S A. 2001;98:5560–5565. doi: 10.1073/pnas.091016398. [DOI] [PMC free article] [PubMed] [Google Scholar]
- 7.Shivapurkar N, Poirier LA. Tissue levels of S-adenosylmethionine and S-adenosylhomocysteine in rats fed methyl-deficient, amino acid-defined diets for one to five weeks. Carcinogenesis. 1983;4:1051–1057. doi: 10.1093/carcin/4.8.1051. [DOI] [PubMed] [Google Scholar]
- 8.Dumble ML, Croager EJ, Yeoh GC, Quail EA. Generation and characterization of p53 null transformed hepatic progenitor cells: oval cells give rise to hepatocellular carcinoma. Carcinogenesis. 2002;23:435–445. doi: 10.1093/carcin/23.3.435. [DOI] [PubMed] [Google Scholar]
- 9.Theise ND. Gastrointestinal stem cells. III. Emergent themes of liver stem cell biology: niche, quiescence, self-renewal, and plasticity. Am J Physiol Gastrointest Liver Physiol. 2006;290:G189–G193. doi: 10.1152/ajpgi.00041.2005. [DOI] [PubMed] [Google Scholar]
- 10.Jelnes P, Santoni-Rugiu E, Rasmussen M, Friis SL, Nielsen JH, Tygstrup N, et al. Remarkable heterogeneity displayed by oval cells in rat and mouse models of stem cell-mediated liver regeneration. Hepatology. 2007;45:1462–1470. doi: 10.1002/hep.21569. [DOI] [PubMed] [Google Scholar]
- 11.Suzuki A, Zheng Yw YW, Kaneko S, Onodera M, Fukao K, Nakauchi H, et al. Clonal identification and characterization of self-renewing pluripotent stem cells in the developing liver. J Cell Biol. 2002;156:173–184. doi: 10.1083/jcb.200108066. [DOI] [PMC free article] [PubMed] [Google Scholar]
- 12.Suzuki A, Zheng Y, Kondo R, Kusakabe M, Takada Y, Fukao K, et al. Flow-cytometric separation and enrichment of hepatic progenitor cells in the developing mouse liver. Hepatology. 2000;32:1230–1239. doi: 10.1053/jhep.2000.20349. [DOI] [PubMed] [Google Scholar]
- 13.Corbeil D, Roper K, Hellwig A, Tavian M, Miraglia S, Watt SM, et al. The human AC133 hematopoietic stem cell antigen is also expressed in epithelial cells and targeted to plasma membrane protrusions. J Biol Chem. 2000;275:5512–5520. doi: 10.1074/jbc.275.8.5512. [DOI] [PubMed] [Google Scholar]
- 14.Yin S, Li J, Hu C, Chen X, Yao M, Yan M, et al. CD133 positive hepatocellular carcinoma cells possess high capacity for tumorigenicity. Int J Cancer. 2007;120:1444–1450. doi: 10.1002/ijc.22476. [DOI] [PubMed] [Google Scholar]
- 15.Rountree CB, Barsky L, Ge S, Zhu J, Senadheera S, Crooks GM. ACD133 Expressing murine liver oval cell population with bi-lineage potential. Stem Cells. 2007;25:2419–2429. doi: 10.1634/stemcells.2007-0176. [DOI] [PubMed] [Google Scholar]
- 16.Shimano K, Satake M, Okaya A, Kitanaka J, Kitanaka N, Takemura M, et al. Hepatic oval cells have the side population phenotype defined by expression of ATP-binding cassette transporter ABCG2/BCRP1. Am J Pathol. 2003;163:3–9. doi: 10.1016/S0002-9440(10)63624-3. [DOI] [PMC free article] [PubMed] [Google Scholar]
- 17.Rountree CB, Wang X, Ge S, Barsky L, Zhu J, Gonzales I, et al. Bone marrow fails to differentiate into liver epithelium during murine development and regeneration. Hepatology. 2007;45:1250–1260. doi: 10.1002/hep.21600. [DOI] [PubMed] [Google Scholar]
- 18.Vandesompele J, De Preter K, Pattyn F, Poppe B, Van Roy N, De Paepe A, et al. Accurate normalization of real-time quantitative RT-PCR data by geometric averaging of multiple internal control genes. Genome Biol. 2002;3:RESEARCH0034. doi: 10.1186/gb-2002-3-7-research0034. [DOI] [PMC free article] [PubMed] [Google Scholar]
- 19.Cimica V, Batusic D, Chen Y, Hollemann T, Pieler T, Ramadori G. Transcriptome analysis of rat liver regeneration in a model of oval hepatic stem cells. Genomics. 2005;86:352–364. doi: 10.1016/j.ygeno.2005.05.001. [DOI] [PubMed] [Google Scholar]
- 20.Ema H, Takano H, Sudo K, Nakauchi H. In vitro self-renewal division of hematopoietic stem cells. J Exp Med. 2000;192:1281–1288. doi: 10.1084/jem.192.9.1281. [DOI] [PMC free article] [PubMed] [Google Scholar]
- 21.Wang X, Ge S, Gonzalez I, McNamara G, Rountree CB, Xi KK, et al. Formation of pancreatic duct epithelium from bone marrow during neonatal development. Stem Cells. 2006;24:307–314. doi: 10.1634/stemcells.2005-0052. [DOI] [PubMed] [Google Scholar]
- 22.Kofman AV, Morgan G, Kirschenbaum A, Osbeck J, Hussain M, Swenson S, et al. Dose- and time-dependent oval cell reaction in acetaminophen-induced murine liver injury. Hepatology. 2005;41:1252–1261. doi: 10.1002/hep.20696. [DOI] [PubMed] [Google Scholar]
- 23.Wang X, Foster M, Al-Dhalimy M, Lagasse E, Finegold M, Grompe M. The origin and liver repopulating capacity of murine oval cells. Proc Natl Acad Sci U S A. 2003;100(Suppl 1):11881–11888. doi: 10.1073/pnas.1734199100. [DOI] [PMC free article] [PubMed] [Google Scholar]
- 24.Resnick JL, Bixler LS, Cheng L, Donovan PJ. Long-term proliferation of mouse primordial germ cells in culture. Nature. 1992;359:550–551. doi: 10.1038/359550a0. [DOI] [PubMed] [Google Scholar]
- 25.Kanno N, LeSage G, Glaser S, Alpini G. Regulation of cholangiocyte bicarbonate secretion. Am J Physiol Gastrointest Liver Physiol. 2001;281:G612–G625. doi: 10.1152/ajpgi.2001.281.3.G612. [DOI] [PubMed] [Google Scholar]
- 26.Nagy P, Bisgaard HC, Thorgeirsson SS. Expression of hepatic transcription factors during liver development and oval cell differentiation. J Cell Biol. 1994;126:223–233. doi: 10.1083/jcb.126.1.223. [DOI] [PMC free article] [PubMed] [Google Scholar]
- 27.Sell S. Cellular origin of hepatocellular carcinomas. Semin Cell Dev Biol. 2002;13:419–424. doi: 10.1016/s1084952102001295. [DOI] [PubMed] [Google Scholar]
- 28.Roskams T. Liver stem cells and their implication in hepatocellular and cholangiocarcinoma. Oncogene. 2006;25:3818–3822. doi: 10.1038/sj.onc.1209558. [DOI] [PubMed] [Google Scholar]
- 29.Lee JS, Heo J, Libbrecht L, Chu IS, Kaposi-Novak P, Calvisi DF, et al. A novel prognostic subtype of human hepatocellular carcinoma derived from hepatic progenitor cells. Nat Med. 2006;12:410–416. doi: 10.1038/nm1377. [DOI] [PubMed] [Google Scholar]
- 30.Walkup MH, Gerber DA. Hepatic stem cells: in search of. Stem Cells. 2006;24:1833–1840. doi: 10.1634/stemcells.2006-0063. [DOI] [PubMed] [Google Scholar]
- 31.Crosby HA, Kelly DA, Strain AJ. Human hepatic stem-like cells isolated using c-kit or CD34 can differentiate into biliary epithelium. Gastroenterology. 2001;120:534–544. doi: 10.1053/gast.2001.21175. [DOI] [PubMed] [Google Scholar]
- 32.Uchida N, Buck DW, He D, Reitsma MJ, Masek M, Phan TV, et al. Direct isolation of human central nervous system stem cells. Proc Natl Acad Sci U S A. 2000;97:14720–14725. doi: 10.1073/pnas.97.26.14720. [DOI] [PMC free article] [PubMed] [Google Scholar]
- 33.Weigmann A, Corbeil D, Hellwig A, Huttner WB. Prominin, a novel microvilli-specific polytopic membrane protein of the apical surface of epithelial cells, is targeted to plasmalemmal protrusions of non-epithelial cells. Proc Natl Acad Sci U S A. 1997;94:12425–12430. doi: 10.1073/pnas.94.23.12425. [DOI] [PMC free article] [PubMed] [Google Scholar]
- 34.Shmelkov SV, St Clair R, Lyden D, Rafii S. AC133/CD133/Prominin-1. Int J Biochem Cell Biol. 2005;37:715–719. doi: 10.1016/j.biocel.2004.08.010. [DOI] [PubMed] [Google Scholar]
- 35.Yovchev MI, Grozdanov PN, Joseph B, Gupta S, Dabeva MD. Novel hepatic progenitor cell surface markers in the adult rat liver. Hepatology. 2007;45:139–149. doi: 10.1002/hep.21448. [DOI] [PubMed] [Google Scholar]
- 36.Akhurst B, Croager EJ, Farley-Roche CA, Ong JK, Dumble ML, Knight B, et al. A modified choline-deficient, ethionine-supplemented diet protocol effectively induces oval cells in mouse liver. Hepatology. 2001;34:519–522. doi: 10.1053/jhep.2001.26751. [DOI] [PubMed] [Google Scholar]
- 37.Huang ZZ, Mao Z, Cai J, Lu SC. Changes in methionine adenosyltransferase during liver regeneration in the rat. Am J Physiol. 1998;275:G14–G21. doi: 10.1152/ajpgi.1998.275.1.G14. [DOI] [PubMed] [Google Scholar]
- 38.Chen L, Zeng Y, Yang H, Lee TD, French SW, Corrales FJ, et al. Impaired liver regeneration in mice lacking methionine adenosyltransferase 1A. FASEB J. 2004;18:914–916. doi: 10.1096/fj.03-1204fje. [DOI] [PubMed] [Google Scholar]
- 39.Martinez-Chantar ML, Vazquez-Chantada M, Garnacho M, Latasa MU, Varela-Rey M, Dotor J, et al. S-adenosylmethionine regulates cytoplasmic HuR via AMP-activated kinase. Gastroenterology. 2006;131:223–232. doi: 10.1053/j.gastro.2006.04.019. [DOI] [PubMed] [Google Scholar]