

INTRODUCTION AND BACKGROUND
In multispectral brain morphometry studies using magnetic resonance imaging (MRI), exact alignment of the multiple images with different contrasts is critical. In particular, accurately segmenting structures based on multispectral data is greatly facilitated by datasets in which the images have no differential distortion. That is, any distortions that exist in an image are identical across the different image contrasts. With appropriately chosen parameters, MPRAGE [1,2] (MPR) provides good contrast between gray matter (GM), white matter (WM) and cerebrospinal fluid (CSF) and this contrast derives predominantly from tissue T1 differences. In multispectral protocols, sequences such as T2-SPACE [3] and multiecho FLASH (MEF) [4] provide additional contrast types, which can be critical for accurately segmenting the boundaries of structures such as the thalamus or the globus pallidum. However, the images resulting from these sequences are differentially distorted because they typically have different bandwidths. The MEF and T2-SPACE bandwidths are both relatively high and can be matched so that the resulting B0 distortions are the same, without sacrificing signal to noise ratio (SNR). However, the MPR typically has a much lower bandwidth so that the SNR is higher. A multiecho version of the MPR (MEMPR) was therefore developed that allows bandwidth and hence distortion matching with MEF and T2-SPACE, with no SNR penalty because the SNR can be recovered by combining the multiple echoes. The MEMPR parameters can be chosen to produce GM-WM-CSF contrast similar to the more standard single echo MPR, while providing dramatically reduced B0 distortions that precisely match the other scans. Furthermore, the T2* information inherent in the multiple echoes of the MEMPR can be used to segment tissues such as dura that frequently confound cortical thickness estimates in regions where dura and cortex are adjacent.
In this study, MEMPR and MPR are compared in the context of brain morphometry, and specifically evaluated for the purpose of accurately estimating intracranial volume, cortical thickness and volumes of subcortical structures. Numerous studies that rely on accurate and undistorted MR images have been published. In particular, studies on aging and Alzheimer’s disease concern regions of the brain subject to susceptibility induced B0 field offsets. For example, Raz et al. [5] demonstrate changes in prefrontal GM volume with aging (4.9% per decade) and a smaller effect with aging on the inferior temporal cortex and the hippocampal formation volumes (2% per decade). Accurate undistorted images are especially important when subtle longitudinal changes must be detected. Rodrigue et al. [6] observed that increased age-related shrinkage of the entorhinal cortex is a sensitive predictor of memory decline. They report an annualized percent change in entorhinal cortex volume of 0.37%. Inferior prefrontal cortex is situated in a region that is affected by susceptibility-induced distortions, while the entorhinal cortex lies adjacent to dura that has the same signal intensity in MPR images. Tisserand et al. [7] observed age-related longitudinal changes in prefrontal and medial temporal areas and longitudinal cognitive decline associated with GM density changes in these areas. Also between children and adolescents, dramatic changes were observed in cortical thickness measurements in parietal cortices [8]. They attribute these changes to regions on the border between GM and WM changing from GM signal to WM signal in older subjects. They also observed significant contrast changes in 0.014% of frontal lobe voxels, including especially orbitofrontal cortex which lies in a region of susceptibility change [9]. These authors used both manual tracing and automatic segmentation methods. Regardless of the method of analysis, consistent imaging across subjects and sessions is critical in measuring these subtle changes.
METHODS
Using higher bandwidth multiecho sequences instead of single echo lower bandwidth sequences reduces B0-related distortions and improves the reliability of morphometric measures. Signal lost due to higher bandwidth can be recovered by averaging the multiple echoes, or the individual echoes can be used in their native multidimensional space to increase the separation of different structures such as the pallidum and the putamen of the basal ganglia. In order to evaluate the possible advantages of MEMPR for brain morphometry, MEMPR and single echo MPR scans were collected on twelve subjects in each of two distinct Siemens (Erlangen, Germany) TIM Trio 3 T systems using the standard 12-channel head matrix coil. Two distinct scanners were selected to better assess the test-retest performance of the sequences across scanning environments. The protocols were exactly matched geometrically (including resolution, matrix size and slab positioning) and matched as closely as possible with respect to sequence timing so as to conserve contrast between sequence types. Morphometric parameters were estimated using two methods viz. SIENA [10] for overall brain volume and FreeSurfer [11] for volumes of segmented structures and cortical thickness. The differences between sequence types and test-retest reliability of these measurements were assessed. The potential of MEMPR for use with an automatic algorithm that distinguishes between GM and dura was also assessed. These tissue types are difficult to disambiguate in regions such as the medial temporal lobe, where they are adjacent and nearly isointense on typical MPR images.
Protocol
The MPR parameters chosen for this study were selected to maximize contrast between GM, WM and CSF at 3 T. A simple Bloch simulation was used to estimate the smallest difference in expected signal intensity (detected transverse magnetization) between WM and GM across the spatial frequency range in the innermost phase encoding direction (the direction that is encoded over the period during which the magnetization recovers after the inversion pulse) for a set of test parameters and for approximate values of proton density (PD) and T1 for human GM and WM found in the literature [12,13] (Table 1). The test parameters included inversion time (TI), repetition time (TR), delay time (TD), flip angle and the number of innermost phase encoding steps. Similarly the smallest difference in expected signal intensity was found for GM and CSF. The contrast to noise ratio (CNR) per unit time for two tissue classes, denoted by a and b, varies with spatial frequency n as follows:
where TRO is the readout time.The set of parameters P maximizing the minimum WM-GM and GM-CSF contrast per unit time differences (CNRPopt) across the spatial frequency range was found:
where the vector P contained the following sequence parameters:
Table 1.
Approximate values for tissue physical parameters used in Bloch simulation for sequence optimization (PD = proton density) at 3 T.
| T1 (ms) | T2 (ms) | PD [%] | |
|---|---|---|---|
| Gray matter | 1120 | 100 | 100 |
| White matter | 980 | 90 | 90 |
| Cerebrospinal fluid | 3500 | 200 | 110 |
A discrete subset of the space P was searched exhaustively to obtain the optimal parameters:3D MPR, TR 2530 ms, TI 1100 ms, TE 3.37 ms, flip angle (α) 7°, 176 sagittal partitions, 2562 matrix, 1 mm isotropic resolution, bandwidth 195 Hz/px, total acquisition time 10 min 49 s. All parameters not included in P were kept fixed or are irrelevant to the optimization. The optimum is approximate primarily because T1 and T2 values vary across the brain and change with age. The search did not explicitly include the total acquisition time, but this is implied in the contrast per unit time optimality criterion. The resolution was fixed to 1 mm isotropic because the segmentation algorithms used are known to perform well with this type of data [10,11]. Sophisticated techniques such as point spread function modeling [14] were not implemented in the optimization procedure. To avoid potential complications in the analysis related to parallel acceleration, this feature was not used. However it is recognized that acceleration may result in a shorter, more practical protocol for routine use. The ordering of the inner phase encoding (partition) loop was linear, in the left-right direction. The direction of the outer phase encoding loop was anterior-posterior, and the readout direction was superior-inferior. All excitation pulses were non-selective. Peak gradient amplitudes were 20 mT/m, 20 mT/m and 28 mT/m and peak slew rates were 87 mT/m/ms, 87 mT/m/ms and 122 mT/m/ms in the x, y and z directions respectively. Images were reconstructed with prescan normalization to correct for B1 inhomogeneities. Although its use may reduce motion artifacts [15], fat suppression was not applied.
Similar parameters were used by Han et al. [16] who demonstrated that MPR performed better on cortical segmentation than MEF, while MEF outperformed MPR on subcortical segmentation. MEF bandwidth is typically around 650 Hz/px with 8 echoes, resulting in 3.3 times less distortion due to B0 inhomogeneities than MPR. To achieve the same distortion reduction with MEMPR, the bandwidth was increased to 650 Hz/px, echoes were added, and the SNR was recovered by combining the echoes to form one root mean squared (RMS) volume. With 4 echoes, the TR, TI and partition encoding time for the MEMPR was marginally longer than for the MPR, resulting in similar WM-GM-CSF contrast. TI was increased slightly to prevent inverted contrast at the first few encoding steps: 3D MEMPR, TI 1200 ms, TE 1.64 + n.Δ TE ms (n=0,..,3) where ΔTE=1.86 ms or 2.95 ms (for bipolar or monopolar echoes, respectively). Four variations on the MEMPR protocol were used, in which the readout direction for all four echoes was the same (MEMPR↑↑), all reversed (MEMPR↓↓) and alternating (MEMPR↑↓ and MEMPR↓↑). The other parameters, including total acquisition time (10 min 49 s), were the same as for MPR. The acquisition time for a comparable MEF is 15 min 6 s (the SNR would be higher due to the longer acquisition time). For the chosen parameters of the MEMPR and the gradient system used, the ramps and gaps between the readout gradients occupy approximately 13.6% of the readout time for alternating direction and 41.5% for fixed readout direction. The MEMPR did not employ ramp sampling. The compromise between bandwidth, number of echoes and echo spacing for these variations resulted in total readout times (readout per k-space line multiplied by number of echoes) of 5.13 ms and 6.14 ms for MPR and MEMPR respectively, slightly favoring MEMPR in terms of image SNR. The echo spacing was 7.5 ms, 9.5 ms and 12.8 ms for MPR, bipolar MEMPR and monopolar MEMPR respectively, resulting in slightly different contrasts for these three protocols.
To demonstrate potential improvement in morphometry with MEMPR 6 scans were collected on each of 12 healthy volunteers (mean age 31 (23–41), 4/8 female/male) on each of two Siemens TIM Trio scanners (mean time between sessions 24 (0–81) days). The six scans included two single echo MPRs with positive and negative readout directions (MPR↑ and MPR↓) and the four variations on the MEMPR (↑↑, ↓↓, ↑↓ and ↓↑).
AutoAlign [17,18] was used for all sessions, ensuring that the brain was centered in the volume and oriented the same way for every scan of every subject. As a consequence of this, part of the neck could easily and consistently be eliminated by masking the same inferior part of each volume for each subject. This preprocessing step ensured more consistent and successful brain extraction by BET [19], a subset of the SIENA processing.
Brain Volume Change Analysis
For every pair of volumes that were compared, FLIRT [20,21] was used to register the two volumes to the halfway point between them, thus ensuring that both volumes were affected equally by resampling. For each scan session, every pair of a particular sequence type with opposite readout directions (MPR↑/MPR↓, MEMPR↑↓/MEMPR↓↑, MEMPR↑↑/MEMPR↓↓) was compared. In addition, all matching sequence types were compared across the two scanners. SIENA was employed to calculate the percent brain volume change (PBVC) across each scan pair. Briefly, SIENA utilizes brain extraction and alignment by segmenting the volumes to find brain/non-brain edge points, then estimates the perpendicular edge displacement between corresponding points for the two volumes [22]. In all cases, since no true anatomical change is expected in the short interval between scans, the correct PBVC is zero. Non-zero results are due to errors in the PBVC estimate, attributable either to the scans themselves or the algorithm used to calculate the PBVC. Since the expected error due to the algorithm is around 0.2% [10], errors in excess of 0.2% may be assumed to be due at least in part to differences in the images. Two ANOVA’s were performed using the R statistical environment (version 2.1.0) to assess the effects of subject, sequence type and scanner on the PBVC between sequences with opposite readout directions (to assess the extent of B0-related distortion on the PBVC) and between scanners (to assess test-retest reliability of the various sequence types).
Cortical Displacement
A complete FreeSurfer (dev 2007/04/09, dev 2007/11/28) [11] analysis of every halfway-resampled (using SIENA) single MPR and MEMPR scan was also carried out. This analysis included reconstructing models of the cortical surfaces, labeling subcortical structures and estimating cortical thickness and the volumes of subcortical structures. The cortical analyses for the MEMPRs were also repeated after identification of dura from the cortical model using the T2* information in the multiple echoes, as explained below.
For each pair of scans with opposite readout direction, FreeSurfer (dev 2007/04/09) was used to calculate the distance between the cortical surfaces (pial surfaces) at all points on the surfaces (i.e. the displacement of the surface assuming that points that are closest in the Euclidean sense correspond to one another). As was the case for the PBVC, the surface displacements should also be zero and non-zero results are attributable either to inaccuracies in the FreeSurfer cortical modeling or differences in the surface positions as represented in the images. Han et al. [16] report that for a sample size of seven subjects per group, a cortical difference of 0.2 mm between groups can be detected. They report a point-wise standard deviation of the measurement error of approximately 0.12 mm. The pial surface displacements were averaged across subjects by mapping to a common spherical coordinate system [23].
Cortical Thickness Correction for Included Dura
The T2* information encoded in the echoes can be exploited for segmentation purposes. For example, a linear combination of echoes can be calculated to optimize contrast between certain structures for MEMPR in the manner of Han for MEF [16]. A particular problem with conventional MPR is that there is little contrast between cortex and dura, and automatic cortical segmentation algorithms may include dura in their estimates of the cortical ribbon in certain regions (Figure 1). Dura has substantially shorter T2* than cortex, which can be used to identify it if data can be acquired at longer echo times (e.g. TE > 5ms). These echo times unfortunately reduce typical T1 contrast between GM and WM, and shorter TEs are typically used in standard MPR imaging.
Figure 1.
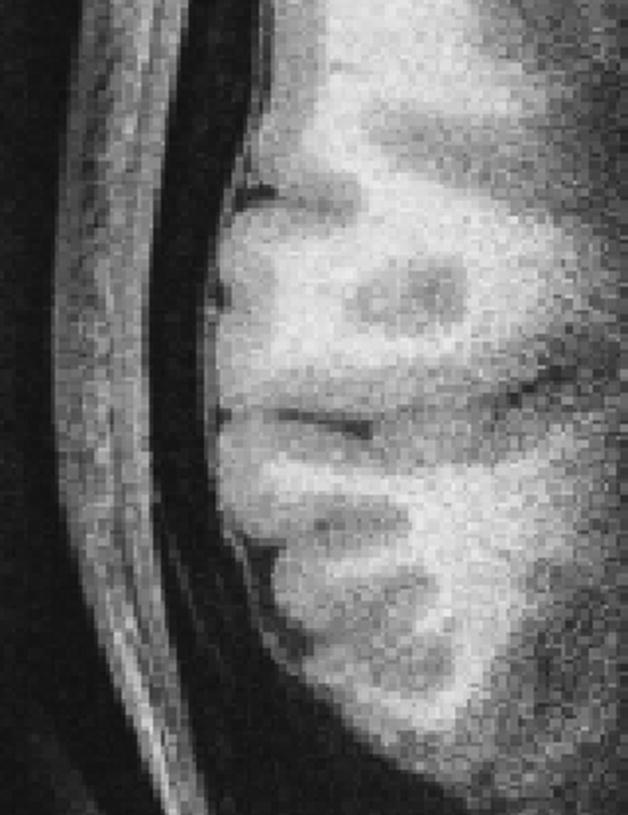
Partial axial slice through right side of brain showing cortex and adjacent isotense dura (0.35 mm isotropic MPRAGE).
The surface deformations used to model the pial surface in FreeSurfer are carried out by the minimization of a constrained energy functional with the typical data fidelity and smoothness terms, as described by Dale et al. and Fischl et al. [24,25]. In order to avoid contaminating the pial surface representation with meningeal tissue, the appearance of which is extremely similar to GM on a typical T1-weighted image, an additional data term is added to the functional. Specifically, a term is included to prohibit the pial surface from entering image regions in which the ratio of the image intensities in the first echo to the last echo is large. This ratio is a simple way to enhance T2* weighting, as the change between these echoes will be large only in regions with short T2*, such as dura (at 3 T, T2* of dura was found by direct measurement for a few examples to be below 20 ms while for GM it was found to be between 40 ms and 60 ms). Using the initial GM/WM surface estimate, the mean and variance of the GM contained within the cortical ribbon are computed by sampling the ratio image 0.5 mm to 1 mm out from the GM/WM border. The distribution of ratio values in the putative GM for a typical subject is shown in Figure 2. This distribution is modeled as Gaussian, and a threshold is computed as two standard deviations above the mean, which captures more than 97% of the ratio values found in the gray matter. The term to prohibit the inclusion of dura then shifts surface locations away from image regions in which this ratio is above the threshold, by moving vertices in the negative of the gradient direction of the ratio image until they fall below threshold. In this way the vast majority of the surface, which is not close to dura, is unaffected by the surface correction.
Figure 2.

Histogram of ratio image values sampled 0.5 mm to 1 mm out from the gray/white junction. The blue line indicates the μ+2σ threshold. Note the Gaussian shape of the distribution.
The cortical surface models were constructed using FreeSurfer with and without correction for dura interference, and the change in cortical thickness between the models was calculated for each subject. The cortical thickness differences were averaged on the inflated spherical surface in the same manner as for the cortical displacements in the previous section.
Structure Volumes and Structure Discriminability
dev 2007/11/28) cerebral white matter, cerebral cortex, lateral ventricle, inferior lateral ventricle, thalamus proper, caudate, putamen, pallidum, hippocampus and amygdala in each hemisphere. An ANOVA was performed using the R statistical environment (version 2.1.0) to assess the effects of subject, structure, sequence type and scanner on the estimated structure volumes.
Matlab 7.4 (The MathWorks, Natick, MA) was used to calculate the SNR for the linear discriminant between chosen adjacent pairs of subcortical structures using individual scans. Structures were located using the automatic FreeSurfer labeling and masked from the original volumes to obtain the intensity values for all voxels. The automatic labeling from the same scan was used i.e. the segmented MPR was used to identify structures in the MPR and the segmented MEMPR was used to identify structures in the matching MEMPR. Since mislabeled voxels at the edges of regions could bias the SNR results, the labeled regions were eroded by a single voxel layer using the SPM5 (UCL, London) 3D erode function in Matlab. Let v1 and v2 represent the vectors (N1 × 1 and N2 × 1 for the MPR and N1 × 4 and N2 × 4 for the MEMPR) of intensity values for the voxels in the two structures of interest (where N1 and N2 represent the number of voxels in each of the two structures). Then σ1 and σ2 are the covariance matrices for the two distributions (1 × 1 for the MPR and 4 × 4 for the MEMPR) and μ1 and μ2 are the means (1 × 1 for the MPR and 1 × 4 for the MEMPR). The SNR for the optimal linear (Hotelling) observer is then defined as follows [26]:
This reflects the performance of the best linear discriminant that separates the two distributions.
RESULTS
Brain Volume Change Analysis
SIENA was used to calculate the PBVC between the pairs MPR↑/MPR↓, MEMPR↑↑/MEMPR↓↓ and MEMPR↑↓/MEMPR↓↑. Figure 3 shows the PBVC between the scans of a particular type with opposite readout directions, pooled across subjects and scanners, and the PBVC change across scanners for each sequence type, pooled across subjects. Ideally the PBVC should be zero in both cases, as the comparison is for the same brain. The ANOVA revealed that the effect of sequence type on the PBVC between readout directions was significant (p<0.001) and the effect of subject on this difference was also significant (p<0.05), while which scanner was used did not have a significant influence. A second ANOVA revealed that the subject had a significant influence on the PBVC between scanners (p<0.01), while sequence type did not. This may be because the different sequences provide a differently biased but consistent representation of the brain volume across scanners, and subjects perform differently from day to day with respect to their ability to remain motionless in the scanner.
Figure 3.

a. Comparison of percent brain volume change (PBVC) calculated by SIENA for 12 subjects on 2 scanners for MPR↑ vs. MPR↓, MEMPR↑↓ vs. MEMPR↓↑ and MEMPR↑↑ vs. MEMPR↓↓. b. Comparison of percent brain volume change (PBVC) calculated for 12 subjects using 6 sequence types for one Siemens 3 T TIM Trio vs. another. Note the scaling difference on the y axes.
Cortical Displacement
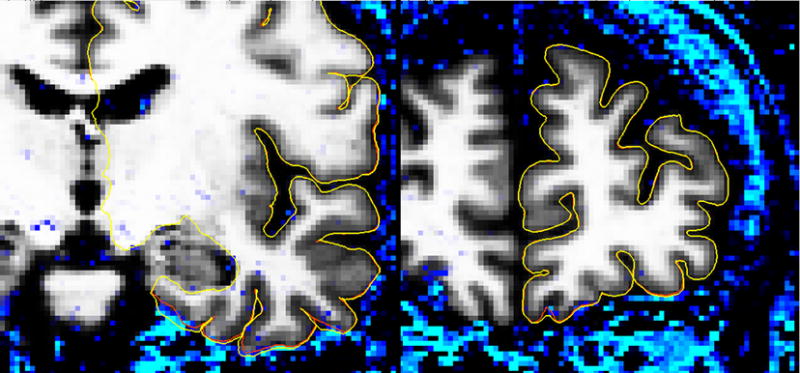
Figure 4 shows the 3 pairs of sequence types, with the calculated pial and WM surfaces for the scans with opposite readout directions superimposed on both images. In the coronal view, the edges of structures in the MPR image move by up to 3 mm whereas in the MEMPR they move by less than 1 mm, as expected based on the relative bandwidths (195 Hz/px vs. 650 Hz/px). The average displacement of the surfaces across subjects is mapped to the cortical surface and shown in Figure 5.
Figure 4.
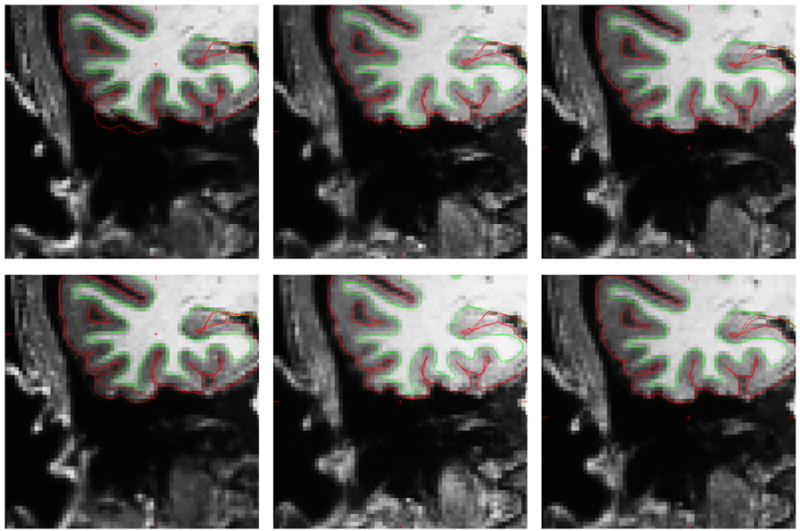
MPR↑ (top left), MPR↓ (bottom left), MEMPR↑↑ (top middle), MEMPR↓↓ (bottom middle), MEMPR↑↓ (top right) and MEMPR↓↑ (bottom right). All images show white matter surfaces (green) and the two pial surfaces (red) calculated from both the images with opposite readout directions (top vs. bottom rows).
Figure 5.

Average displacement in mm between pial surfaces calculated from scans with opposite readout directions, displayed on right hemisphere rotated to show cortex where B0 offsets are greatest. MPR↑/↓ (left), MEMPR↑↑/↓↓ (middle) and MEMPR↑↓/↓↑ (right).
Cortical Thickness Correction for Included Dura
Figure 6 shows the first and fourth echoes for an area where dura and cortex are adjacent and hard to disambiguate in a typical subject. The cortical surface corrected after excluding dura is shown in red. Figure 7 shows the average shift in pial surface position across the surface that results from the dura correction. Since the WM surface is unaffected by the presence of dura, and cortical thickness is the distance between the WM and pial surfaces, cortical thickness is directly influenced by changes in the location of the pial surface.
Figure 6.
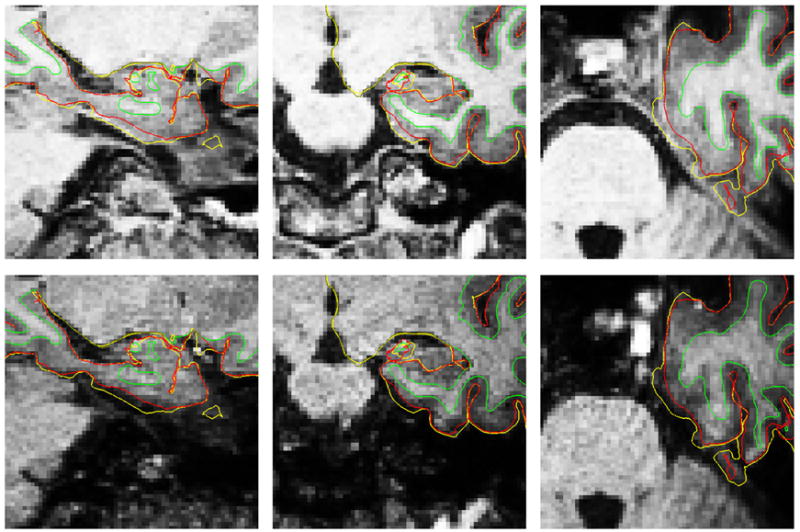
First (top) and fourth (bottom) echo of MEMPR showing difference in T2* contrast between dura and gray matter. In the first echo, as with single echo MPR, gray matter and dura are approximately isointense. All images show white matter surfaces (green) and the pial surface calculated without dura avoidance (yellow) and with dura avoidance (red).
Figure 7.
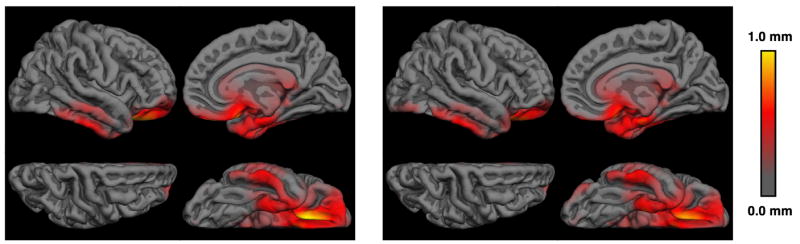
Average cortical thickness differences in mm due to dura correction for MEMPR↑↑ (left) and MEMPR↑↓ (right).
The dura correction method relies on T2* differences between dura and GM, and T2* is reduced in susceptibility regions. While the overlap in Figure 5 and Figure 7 may be partly due to this bias, visual inspection of the corrected surfaces (see Figure 6) reveals that dura lies proximal to the cortex in the corrected regions and also in other regions where the field is homogeneous but dura is thinner (e.g. superior medial). Figure 8 shows the regions where the ratio image of the first to the fourth echo of the MPRAGE exceeds the threshold for detecting dura (blue), together with the uncorrected and corrected surfaces. In regions where susceptibility changes are prominent and dura is present, such as the medial temporal area, dura is eliminated from the surface, whereas in susceptibility regions where dura does not interfere with cortex, such as in the medial frontal region, the surface is unaffected.
Figure 8.
Coronal slices through medial temporal susceptibility region (left) and medial frontal susceptibility region (right) showing regions where the first to fourth echo ratio image of the MEMPR exceeds the threshold for dura/non-cortex detection. The pial surface without dura avoidance is shown in yellow and the pial surface with dura avoidance is shown in red. Dura is avoided in the medial temporal susceptibility region, whereas the surface is largely unaffected in the medial frontal susceptibility area where dura does not interfere with cortex.
Structure Volumes and Structure Discriminability
Figure 9 shows the volumes of ten selected brain structures estimated using FreeSurfer and averaged across all subjects and both scanners, and separated by sequence type (but averaged across readout polarities). Figure 10 shows the differences in the volume estimated on one scanner compared to the other, averaged across subjects and readout polarities. The ANOVA showed that neither the effect of scanner nor sequence type on the estimated volumes reached significance.
Figure 9.

Volumes of brain structures averaged across subjects and scanners for three sequence types. 1=cerebral white matter, 2=cerebral cortex, 3=lateral ventricle, 4=inferior lateral ventricle, 5=thalamus proper, 6=caudate, 7=putamen, 8=pallidum, 9=hippocampus, 10=amygdala. Volumes are shown for left hemisphere – right hemisphere was similar.
Figure 10.

Volume differences between brain structures scanned between the two scanners, averaged across subjects, for three sequence types. Structure numbers follow Figure 9 and are for the left hemisphere. Left and right hemisphere results were similar.
Figure 11 shows the SNR for the linear discriminant for various pairs of adjacent structures for the three sequence types, MPR and MEMPR (alternating and same readout direction pooled across readout polarities).
Figure 11.

MPR and MEMPR (same, opposite direction readout) SNR values for linear discriminant between adjacent structure pairs. 1=white/gray, 2=white/thal., 3=white/caudate, 4=white/putamen, 5=white/pallidum, 6=white/hippo., 7=white/amygdala, 8=gray/hippo., 9=gray/amygdala, 10=putamen/pallidum, 11=hippo./gray, 12=hippo./amygdala, 13=hippo./lat. ventr., 14=hippo./inf. lat. ventr., 15=amygdala/white, 16=amygdala/gray, 17=amygdala/lat. ventr., 18=amygdala/inf.=lat. ventr., 19=thalamus/caudate, 20=thalamus/lat. ventr., 21=thalamus/pallidum.
DISCUSSION
Brain Volume Change Analysis
The sequence type effect on PBVC is most likely due to the fact that the lower bandwidth of the MPR results in larger distortions and these distortions switch with readout direction. Therefore the calculated PBVC is larger for MPR than for the higher bandwidth (and hence less distorted) MEMPR. In addition, the remaining B0-related distortions appear to be mitigated by averaging alternate echoes, resulting in lower PBVC for MEMPR with alternating readout direction as compared to MEMPR with all readouts in the same direction. The subject effect may be caused by some of the subjects moving during certain scans as can be inferred by visually inspecting the images, and by individual anatomical differences differentially affecting the extent of B0 inhomogeneity related distortions and shimming differences. These scans were not removed from the statistical analysis as their inclusion did not substantially alter the significance of the effects, but the implication is that varying amounts of subject movement during scanning may have a variably significant influence on morphometry results for individual subjects.
The fact that sequence type significantly affected the PBVC between scans with opposite direction while it did not significantly affect the PBVC between scans with the same direction acquired across scanners suggests that the estimate of brain volume varies little across scanners (of exactly the same model) if the same sequence type is used, and that a bias is introduced by sequence type. The bias is smallest for MEMPR↑↓ where it becomes comparable to the variation across scanners – note the difference in the scale of the two y-axes of Figure 3.
Cortical Displacement
The areas of cortex most affected by the change in readout direction, as demonstrated by the displacement of the cortical surfaces, are the areas of greatest expected susceptibility change. The effect is more pronounced with the MPR scan than with the MEMPR scan. The displacements were smallest for the averaged MEMPR with alternating readout direction. Cortical thickness estimates were less affected than the absolute position of the surfaces. This is because inhomogeneities in the B0 field vary smoothly over the thickness of the cortex, causing the inner and outer surfaces of the cortex to shift in the same direction, thus leaving the distance between them relatively unaffected even though the absolute shift of both surfaces may be on the order of millimeters (Figure 4).
Structure Discriminability
The discriminant results suggest that the power of FreeSurfer to differentiate between adjacent structures using the multiple echoes with additional implicit T2* information in the MEMPR is similar and not substantially better than with MPR. While this relates to the accurate definition of adjacent structures based on contrast as well as the differential distortion properties of the sequence types, the results of Figure 10 comparing brain volumes ostensibly relate only to the distortion properties of the sequences. However, because the volume estimates are calculated by FreeSurfer using the RMS of the echoes in the MEMPR case, there is a slight difference in contrast between the sequence types. MEMPR↑↓/↓↑ has longer average TE than MPR, and MEMPR↑↑/↓↓ has longer average TE still, due to the larger echo spacing necessitated by the readout rewinder. Therefore the T2* weighting in the RMS increases progressively across these sequence types. Also, slight differences in TI and the total time allocated to phase encoding between inversions results in subtly different T1 weighting. Nevertheless, the preceding results combined suggest that the subcortical segmentation accuracy based on MEMPR using FreeSurfer is similar to that based on MPR.
General
The results show substantially reduced B0-related distortions for MEMPR compared to MPR, resulting in more reliable PBVC estimates using SIENA, especially if the readout directions for the four echoes alternate. The displacement of the cortical surface due to B0 distortions estimated using FreeSurfer was also the smallest with MEMPR with alternating readout direction. Presumably alternating the readout direction improves PBVC and cortical position estimates because the true position of the cortex lies somewhere between the positions represented by the images with opposite readouts and therefore the blurred average better represents the true cortical position. As expected, the regions most affected are the temporal and inferior prefrontal areas where the largest susceptibility changes occur. Coincidentally, dura lies close to cortex in these same regions, and dura correction with FreeSurfer resulted in the largest changes in cortical thickness in a similar distribution of regions on the cortex. Contrary to the case for cortical position, the effects on cortical thickness were slightly greater when MEMPR with the same readout direction was used. This is likely due to the fact that dura is thin and even the small amount of remaining distortion with the high bandwidth MEMPR results in incomplete overlap of dura in the images with alternating readout direction and therefore a less accurate T2* estimate and incomplete identification of dura.
Subcortical labeling using FreeSurfer was comparable for all sequence types. Whether MPR or MEMPR performed better at discriminating between adjacent brain structures, or consistently estimating structure volumes between scanners, varied with structure and subject. Since FreeSurfer and the optimal contrast MPR protocol evolved synergistically, there is a bias in favor of the MPR. Also, the two MPR scans were collected before the four MEMPR scans for all subjects and this may bias the results in favor of the MPR, since subjects may move more during later scans in a session (all subjects had participated in previous MR studies). Nevertheless, if the input to FreeSurfer is the MEMPR, the resulting performance on subcortical segmentation is at least comparable. Based on the results of Han et al. [16], in which multiecho FLASH (MEF) was shown to provide a better basis for segmentation than MPR for all structures other than cortex, it might be expected that MEMPR would substantially outperform MPR. However, it should be noted that in this study only four echoes were collected with the MEMPR whereas eight echoes were collected with the MEF, while the bandwidth ratios were the same. Therefore the MEF had a square root of two advantage in SNR over the MEMPR. Also, apart from the discriminability analysis, all other comparisons were carried out using the RMS average and not an optimal linear weighting of echoes. Ideally, the segmentation algorithm would operate directly on the multiecho data directly, as any lower dimensional projection can only increase the theoretically optimal error rate for the classifier, but this is not yet the case. The MEMPR was developed partly with the aim of providing exactly registered multispectral data for segmentation purposes, where the definition of the edges of small structures is important and must coincide across scans. Since the bandwidth of the MEMPR can be matched with those of the MEF and the T2-SPACE sequences, and PD, T1 and T2* can be estimated from MEF collected with multiple flip angles [27,28], this combination of sequences provides exactly geometrically matched multispectral data (quantitative PD, T1 and T2*, and optimal GM/WM/CSF and T2-weighted contrast).
Possible drawbacks of MEMPR include sensitivity to eddy currents, heating induced by rapid gradient switching, a high data rate and the need for greater storage capacity. The effects of eddy currents were not evaluated. Since gradient switching and data acquisition are slower than for a typical EPI protocol, gradient heating and data rate are not expected to be problematic at moderate resolutions. The 3D multiecho reconstruction as implemented requires that all volumes be held in memory simultaneously. Therefore the amount of memory could be limiting for high resolution MEMPR acquisitions with large array coils.
CONCLUSION
The acquisition times for MEMPR and MPR are equal. MEMPR achieves the same “optimal” GM-WM-CSF contrast with reduced distortion and comparable SNR and CNR. The MEMPR also provides additional T2* information, that may be used to segment dura from cortex. The MEMPR bandwidth can be matched to other scans in multispectral morphometry protocols so that the fine edges of structures register precisely across contrasts. MEMPR provides considerable benefits over MPR in morphometry studies, with few apparent drawbacks.
Acknowledgments
Thanks to Anders Dale for assistance with contrast optimization. Thanks also to Douglas Greve, Anastasia Yendiki, Jenni Pacheco and Evelina Busa for valuable insights and assistance in various aspects of this project. Support for this research was provided in part by the National Center for Research Resources (P41-RR14075, R01-RR16594-01A1 and the NCRR BIRN Morphometric Project BIRN002, U24-RR021382), the National Institute for Biomedical Imaging and Bioengineering (R01-EB001550, R21-EB02530, R01-EB006758), the National Institute for Neurological Disorders and Stroke (R01-NS052585-01) as well as the Mental Illness and Neuroscience Discovery (MIND) Institute, and is part of the National Alliance for Medical Image Computing (NAMIC), funded by the National Institutes of Health through the NIH Roadmap for Medical Research, Grant U54-EB005149. Information on the National Centers for Biomedical Computing can be obtained from http://nihroadmap.nih.gov/bioinformatics.
Footnotes
Publisher's Disclaimer: This is a PDF file of an unedited manuscript that has been accepted for publication. As a service to our customers we are providing this early version of the manuscript. The manuscript will undergo copyediting, typesetting, and review of the resulting proof before it is published in its final citable form. Please note that during the production process errors may be discovered which could affect the content, and all legal disclaimers that apply to the journal pertain.
References
- 1.Mugler JP, 3rd, Brookeman JR. Three-dimensional magnetization-prepared rapid gradient-echo imaging (3D MP RAGE) Magn Reson Med. 1990;15:152–157. doi: 10.1002/mrm.1910150117. [DOI] [PubMed] [Google Scholar]
- 2.Mugler JP, 3rd, Brookeman JR. Rapid three-dimensional T1-weighted MR imaging with the MP-RAGE sequence. J Magn Reson Imaging. 1991;1:561–567. doi: 10.1002/jmri.1880010509. [DOI] [PubMed] [Google Scholar]
- 3.Lichy MP, Wietek BM, Mugler JP, 3rd, Horger W, Menzel MI, Anastasiadis A, Siegmann K, Niemeyer T, Konigsrainer A, Kiefer B, Schick F, Claussen CD, Schlemmer HP. Magnetic resonance imaging of the body trunk using a single-slab, 3-dimensional, T2-weighted turbo-spin-echo sequence with high sampling efficiency (SPACE) for high spatial resolution imaging: initial clinical experiences. Invest Radiol. 2005;40:754–760. doi: 10.1097/01.rli.0000185880.92346.9e. [DOI] [PubMed] [Google Scholar]
- 4.Fischl B, Salat DH, van der Kouwe AJ, Makris N, Segonne F, Quinn BT, Dale AM. Sequence-independent segmentation of magnetic resonance images. Neuroimage. 2004;23(Suppl 1):S69–84. doi: 10.1016/j.neuroimage.2004.07.016. [DOI] [PubMed] [Google Scholar]
- 5.Raz N, Gunning FM, Head D, Dupuis JH, McQuain J, Briggs SD, Loken WJ, Thornton AE, Acker JD. Selective aging of the human cerebral cortex observed in vivo: differential vulnerability of the prefrontal gray matter. Cereb Cortex. 1997;7:268–282. doi: 10.1093/cercor/7.3.268. [DOI] [PubMed] [Google Scholar]
- 6.Rodrigue KM, Raz N. Shrinkage of the entorhinal cortex over five years predicts memory performance in healthy adults. J Neurosci. 2004;24:956–963. doi: 10.1523/JNEUROSCI.4166-03.2004. [DOI] [PMC free article] [PubMed] [Google Scholar]
- 7.Tisserand DJ, van Boxtel MP, Pruessner JC, Hofman P, Evans AC, Jolles J. A voxel-based morphometric study to determine individual differences in gray matter density associated with age and cognitive change over time. Cereb Cortex. 2004;14:966–973. doi: 10.1093/cercor/bhh057. [DOI] [PubMed] [Google Scholar]
- 8.Sowell ER, Thompson PM, Holmes CJ, Batth R, Jernigan TL, Toga AW. Localizing age-related changes in brain structure between childhood and adolescence using statistical parametric mapping. Neuroimage. 1999;9:587–597. doi: 10.1006/nimg.1999.0436. [DOI] [PubMed] [Google Scholar]
- 9.Sowell ER, Thompson PM, Holmes CJ, Jernigan TL, Toga AW. In vivo evidence for post-adolescent brain maturation in frontal and striatal regions. Nat Neurosci. 1999;2:859–861. doi: 10.1038/13154. [DOI] [PubMed] [Google Scholar]
- 10.Smith SM, Zhang Y, Jenkinson M, Chen J, Matthews PM, Federico A, De Stefano N. Accurate, robust, and automated longitudinal and cross-sectional brain change analysis. Neuroimage. 2002;17:479–489. doi: 10.1006/nimg.2002.1040. [DOI] [PubMed] [Google Scholar]
- 11.Fischl B, Salat DH, Busa E, Albert M, Dieterich M, Haselgrove C, van der Kouwe A, Killiany R, Kennedy D, Klaveness S, Montillo A, Makris N, Rosen B, Dale AM. Whole brain segmentation: automated labeling of neuroanatomical structures in the human brain. Neuron. 2002;33:341–355. doi: 10.1016/s0896-6273(02)00569-x. [DOI] [PubMed] [Google Scholar]
- 12.Peters AM, Brookes MJ, Hoogenraad FG, Gowland PA, Francis ST, Morris PG, Bowtell R. T(2)* measurements in human brain at 1.5, 3 and 7 T. Magn Reson Imaging. 2007 doi: 10.1016/j.mri.2007.02.014. [DOI] [PubMed] [Google Scholar]
- 13.Wansapura JP, Holland SK, Dunn RS, Ball WS., Jr NMR relaxation times in the human brain at 3.0 tesla. J Magn Reson Imaging. 1999;9:531–538. doi: 10.1002/(sici)1522-2586(199904)9:4<531::aid-jmri4>3.0.co;2-l. [DOI] [PubMed] [Google Scholar]
- 14.Deichmann R, Schwarzbauer C, Turner R. Optimisation of the 3D MDEFT sequence for anatomical brain imaging: technical implications at 1.5 and 3 T. Neuroimage. 2004;21:757–767. doi: 10.1016/j.neuroimage.2003.09.062. [DOI] [PubMed] [Google Scholar]
- 15.Howarth C, Hutton C, Deichmann R. Improvement of the image quality of T1-weighted anatomical brain scans. Neuroimage. 2006;29:930–937. doi: 10.1016/j.neuroimage.2005.08.004. [DOI] [PubMed] [Google Scholar]
- 16.Han X, Jovicich J, Salat D, van der Kouwe A, Quinn B, Czanner S, Busa E, Pacheco J, Albert M, Killiany R, Maguire P, Rosas D, Makris N, Dale A, Dickerson B, Fischl B. Reliability of MRI-derived measurements of human cerebral cortical thickness: the effects of field strength, scanner upgrade and manufacturer. Neuroimage. 2006;32:180–194. doi: 10.1016/j.neuroimage.2006.02.051. [DOI] [PubMed] [Google Scholar]
- 17.Benner T, Wisco JJ, van der Kouwe AJ, Fischl B, Vangel MG, Hochberg FH, Sorensen AG. Comparison of manual and automatic section positioning of brain MR images. Radiology. 2006;239:246–254. doi: 10.1148/radiol.2391050221. [DOI] [PubMed] [Google Scholar]
- 18.Van der Kouwe AJ, Benner T, Fischl B, Schmitt F, Salat DH, Harder M, Sorensen AG, Dale AM. On-line automatic slice positioning for brain MR imaging. Neuroimage. 2005;27:222–230. doi: 10.1016/j.neuroimage.2005.03.035. [DOI] [PubMed] [Google Scholar]
- 19.Smith SM. Fast robust automated brain extraction. Hum Brain Mapp. 2002;17:143–155. doi: 10.1002/hbm.10062. [DOI] [PMC free article] [PubMed] [Google Scholar]
- 20.Jenkinson M, Bannister P, Brady M, Smith S. Improved optimization for the robust and accurate linear registration and motion correction of brain images. Neuroimage. 2002;17:825–841. doi: 10.1016/s1053-8119(02)91132-8. [DOI] [PubMed] [Google Scholar]
- 21.Jenkinson M, Smith S. A global optimisation method for robust affine registration of brain images. Med Image Anal. 2001;5:143–156. doi: 10.1016/s1361-8415(01)00036-6. [DOI] [PubMed] [Google Scholar]
- 22.Zhang Y, Brady M, Smith S. Segmentation of brain MR images through a hidden Markov random field model and the expectation-maximization algorithm. IEEE Trans Med Imaging. 2001;20:45–57. doi: 10.1109/42.906424. [DOI] [PubMed] [Google Scholar]
- 23.Fischl B, Sereno MI, Tootell RB, Dale AM. High-resolution intersubject averaging and a coordinate system for the cortical surface. Hum Brain Mapp. 1999;8:272–284. doi: 10.1002/(SICI)1097-0193(1999)8:4<272::AID-HBM10>3.0.CO;2-4. [DOI] [PMC free article] [PubMed] [Google Scholar]
- 24.Dale AM, Fischl B, Sereno MI. Cortical surface-based analysis. I Segmentation and surface reconstruction. Neuroimage. 1999;9:179–194. doi: 10.1006/nimg.1998.0395. [DOI] [PubMed] [Google Scholar]
- 25.Fischl B, Dale AM. Measuring the thickness of the human cerebral cortex from magnetic resonance images. Proc Natl Acad Sci U S A. 2000;97:11050–11055. doi: 10.1073/pnas.200033797. [DOI] [PMC free article] [PubMed] [Google Scholar]
- 26.Duda RO, Hart PE, Stork DH. Pattern Classification. New York, NY: Wiley Interscience; 2000. [Google Scholar]
- 27.Deoni SC, Peters TM, Rutt BK. High-resolution T1 and T2 mapping of the brain in a clinically acceptable time with DESPOT1 and DESPOT2. Magn Reson Med. 2005;53:237–241. doi: 10.1002/mrm.20314. [DOI] [PubMed] [Google Scholar]
- 28.Deoni SC, Rutt BK, Peters TM. Rapid combined T1 and T2 mapping using gradient recalled acquisition in the steady state. Magn Reson Med. 2003;49:515–526. doi: 10.1002/mrm.10407. [DOI] [PubMed] [Google Scholar]