Abstract
Objective: To determine fatty acid synthase (FAS) expression in human multiple myeloma and verify its potential as a therapeutic target in multiple myeloma. Methods: FAS expression was determined by immunohistochemistry, reverse-transcription polymerase chain reaction (RT-PCR) and immunoblot analysis in bone marrow samples obtained from 27 patients with multiple myeloma (MM patients) and peripheral blood mononuclear cells (PBMCs) obtained from 12 healthy donors. In parallel, additional analyses were performed on 2 human multiple myeloma cell lines, U266 and RPMI8226. U266 cells were treated with cerulenin at various concentrations (5 to 320 µg/ml) for 24 h, and metabolic activity was measured by 3-(4,5-dimethylthiazol-2-yl)-2,5-diphenyltetrazolium bromide (MTT) assays. Apoptosis was evaluated by dual Annexin V/PI (propidium iodide) labeling and flow cytometry (FCM) in U266 cells treated with 20 μg/ml cerulenin for 12 h or 24 h. Results: By immunohistochemistry, we found that 19 of 27 bone marrow samples obtained from MM patients expressed significantly high levels of FAS. Similarly, by RT-PCR, 22 of 27 bone marrow samples obtained from MM patients, U266 and RPMI8226 showed FAS expression, whereas PBMC samples from 12 healthy donors did not express detectable level of FAS. FAS protein expression was confirmed by immunoblot analysis in 16 of 27 bone marrow samples obtained from MM patients, U266 and RPMI8226 cell lines, and no FAS protein expression was detected in PBMC samples from 12 healthy donors. U266 cells were highly sensitive to cerulenin treatment, with a dosage-related effect on metabolic activity, as a measure for cell proliferation. U266 cells treated with 20 µg/ml cerulenin for 12 and 24 h also showed early sign of apoptosis with 56.9% and 69.3% Annexin V+/PI− cells, and late apoptotic and necrotic cells with 3.2% and 17.6% Annexin V+/PI+ cells. Conclusion: Increased FAS expression existed in multiple myeloma samples and human myeloma cell lines. Cerulenin greatly inhibited metabolic activity/cell proliferation of U266 cells and induced apoptosis, suggesting that FAS is an effective target for pharmacological therapy in human multiple myeloma.
Keywords: Fatty acid synthase (FAS), Cerulenin, Apoptosis, Multiple myeloma
INTRODUCTION
Multiple myeloma is an incurable malignancy arising from postgerminal mature B cells. The estimated incidence of multiple myeloma accounts for 10% of hematological malignancies and 1% of all malignancies (Kuehl and Bergsagel, 2002). The current standard treatment with high-dose chemotherapy followed by autologous stem cell transplant prolongs survival to a median of 4~5 years compared to 3 years in conventional chemotherapy (Child et al., 2002). Thus, there is a need for novel therapeutic approaches to improve treatment of this cancer.
One therapeutic target that has not been previously considered for multiple myeloma treatment is the pathway of endogenous synthesis of fatty acid. Fatty acid synthase (FAS), the primary enzyme of this pathway, is highly expressed in many human cancers including carcinomas of the colon, prostate, ovary, endometrium and breast (Rashid et al., 1997; Swinnen et al., 2002; Wang et al., 2001). In normal human tissues with well-nourishing, FAS is down-regulated due to ingestion of sufficient level of dietary fatty acids (Kersten, 2001). The differential expression of FAS between normal and cancer tissues has led to the consideration of FAS as a target for anticancer therapy (Gabrielson et al., 2001; Pizer et al., 2001). For this purpose, we first evaluated FAS expression in a series of bone marrow samples obtained from 27 patients with multiple myeloma (MM patients) by immunohistochemistry, then established FAS mRNA and protein expression levels by reverse-transcription polymerase chain reaction (RT-PCR) and immunoblot analysis in the same samples, and compared them to peripheral blood mononuclear cell (PBMC) samples obtained from 12 healthy donors. In parallel, additional analyses were performed on two human multiple myeloma cell lines, U266 and RPMI8226. Encouraged by the findings that human bone marrow samples from MM patients and cell lines expressed high levels of FAS, we then further treated U266 cells in vitro with cerulenin, a native inhibitor of FAS. We found that FAS inhibition attenuated metabolic activity/cell proliferation and activated apoptosis, suggesting that FAS inhibition may be an effective novel target for human multiple myeloma therapy.
MATERIALS AND METHODS
Patients
A total of 27 patients were enrolled in the study during the period from November 2003 to November 2005 in the Second Affiliated Hospital, School of Medicine, Zhejiang University, China, including 15 men and 12 women, with age ranging from 43 to 78 years (average 59.96 years), and with marrow plasmacytosis from 30% to 98%. All patients had a confirmed diagnosis of multiple myeloma by the National Cancer Institute (NCI) working group definition. Also recruited were 12 healthy subjects, 7 men and 5 women, aged from 41~60 years (average 51.6 years). Written concern was obtained from all the participants, and the study was approved by the local ethics committee.
Cells and culture
Bone marrow samples were obtained from 27 untreated MM patients and peripheral blood samples were collected from 12 healthy volunteers. PBMCs were separated from healthy donor’s venous blood by density gradient centrifugation. Normal human skin fibroblasts were isolated from adult skin obtained from surgical biopsies. Human myeloma cell lines, U266 and RPMI8226, were purchased from the American Type Culture Collection. Cells were cultured in RPMI1640 media, supplemented with 15% (v/v) fetal bovine serum and kept at 37 °C in an atmosphere containing 5% (v/v) CO2. Cell culture reagents were purchased from Gibco Life Technologies (Grand Island, NY, USA). Cerulenin was purchased from Sigma (USA), dissolved in dimethyl sulfoxide (DMSO) and stocked in 5 mg/ml concentration. The final concentration of DMSO in cultures was ≤0.2% (v/v) (Heiligtag et al., 2002).
Immuohistochemistry for FAS
Immunohistochemistry for FAS was performed on bone marrow smears using a mouse anti-human FAS antibody (Pharmingen, San Diego, CA, USA) at 1:250 on a Dako Immunostainer and a labelled streptavidin-biotin 2 (LSAB2) detection kit obtained from Dako-Denmark (USA) (Gansler et al., 1997). FAS expression was evaluated for both intensity and percentage of stained malignant plasma cells. Cases were considered to be positive when ≥20% of malignant plasma cells showed the typical pattern of FAS expression, which was evidenced by diffuse cytoplasmic brown staining of variable intensity among individual samples (Gabrielson et al., 2001).
RT-PCR for FAS mRNA
RNA was isolated from U266 and RPMI8226 cells, bone marrow plasma cells obtained from MM patients and PBMCs obtained from healthy donors using Trizol Reagent (Invitrogen, USA) according to established procedures. Cells were incubated at 37 °C for 1 h. RNA (5 µg) was resuspended in 4 µl 5× buffer, 10 µl diethyl pyrocarbonate (DEPC)-treated water and 1 U DNase (Worthington, USA). Following denaturation at 95 °C for 5 min, 0.2 µl oligo(dT) (0.2 µg/µl), 2 µl dNTP (10 mmol/L), 1 µl DEPC-treated water and 1 µl reverse transcriptase (1 U) were added into the mixture, and then the mixture was incubated at 42 °C for 1.5 h. Aliquot of the mixture (1 µl) was then supplemented with hot-start mix reagent containing 1× PCR (polymerase chain reaction) buffer (5 µl), 1.5 mmol/L MgCl2 (4 µl), 10 mmol/L dNTP (1 µl) and 1.5 U Taq polymerase (0.3 µl). Finally, 1.0 µl of each primer (20 µmol/L, forward and reverse primers) and 11.7 µl water were added. All PCR reagents were purchased from Promega (USA). After an initial incubation at 94 °C for 15 min, the PCR was done for 35 cycles with denaturation at 94 °C for 45 s, annealing at 57 °C for 45 s, and extension at 72 °C for 1 min, on a Perkin Elmer 9600 thermocycler. A final extension at 72 °C for 10 min was conducted after 35 cycles. After amplification, samples were subjected to electrophoresis on 2% (w/w) agarose gel containing ethidium bromide, visualized under ultraviolet (UV) light and photographed using an Alpha-Imager 3400 (Bio-rad). PCR controls included amplification of the house-keeping gene β-actin for all runs, and the following primers were used: β-actin: 5′-TTC CAG CCT TCC TTC CTG G-3′ (forward), 5′-TTG CGC TCA GGA GGA GCA AT-3′ (reverse), 224-bp product; FAS: 5′-GTG AGG CTG AGG CTG AGA C-3′ (forward), 5′-GGC ACG CAG CTT GTA GTA GA-3′ (reverse), 212-bp product.
Immunoblot analysis for FAS
For detection of FAS protein in myeloma cell lines (U266 and RPMI8226), bone marrow plasma cells obtained from MM patients and PBMCs from healthy donors, cells were lysed with 20 mmol/L Tris-HCl, 5 mmol/L ethylenediaminotetraacetic acid (EDTA), 1% (v/v) Triton-X-100, 1% (v/v) complete TM (pH 8.3), centrifuged and subsequently analyzed for total protein concentrations by BCA (2,2′-bicinchonic acid) assay (Laemmli, 1970). Equal amounts of protein (100 µg) were separated on 7% (w/v) SDS-PAGE (sodium dodecyl sulfate polyacrylamide gel electrophoresis) and electroblotted onto a PVDF (polyvinylidene fluoride) membrane. After blocking with 5% (w/v) non-fat dry milk in washing buffer (50 mmol/L Tris-HCl, 150 mmol/L NaCl, 0.3% (v/v) Tween 20, pH 7.5), immunodetection was done using primary mouse anti-FAS antibody (Pharmingen, San Diego, CA, USA) and secondary goat anti-mouse IgG (Sigma, USA) conjugated with horseradish peroxidase (Camassei et al., 2003). Visualization of the protein was performed by enhanced chemiluminescence (ECL) reaction.
Cell proliferation and viability assay
To assess the effect of cerulenin treatment on cell metabolic activity, MTT assays were performed on U266 cells and human skin fibroblasts, which were plated in 96-well plates at a density of 1×10⁵ cells per well and exposed to 5, 10, 20, 40, 60, 80, 160 and 320 µg/ml cerulenin for 24 h (Heiligtag et al., 2002). Each concentration was tested in triplicate. The optical absorbance was read on a plate reader (BIO-RAD Co., USA) at a wavelength of 570 nm. Analysis of cells exposed to DMSO was performed as controls in all experiments. The inhibitory rate (RI) of cell metabolic activity, a measure for cell proliferation, was calculated using the formula:
| RI (%)=[(Acontrol−Atreatment)/Acontrol]×100%, |
where A treatment and A control are the absorbances for treatment with various concentrations of cerulenin and controls, respectively.
Cytofluorometric determination of apoptotic cells by Annexin V/PI (propidium iodide)-staining
U266 cells were exposed to 20 µg/ml cerulenin for 12 and 24 h and then labeled with Annexin V/PI. Briefly, cerulenin-treated and -untreated U266 cells (5×10⁵) were washed in PBS and then incubated with 5 µl of 0.2 µg/ml Annexin V-FITC (fluorescein isothiocyanate) (Transduction Laboratories) and 20 µl of 50 µg/ml propidium iodide (Transduction Laboratories) for 15 min at room temperature, prior to flowcytometry analysis. Annexin V+/PI− cells were identified as early apoptotic, whereas Annexin V+/PI+ cells were classified as late apoptotic cells.
Statistical analysis
Results were expressed as mean±SD. All experiments were repeated 3 times. The data were analyzed by one-way analysis of variance (ANOVA) followed by Dunnett’s post-hoc analysis using SPSS. Differences were considered significant at P<0.01.
RESULTS
Expression of FAS by immunohistochemistry
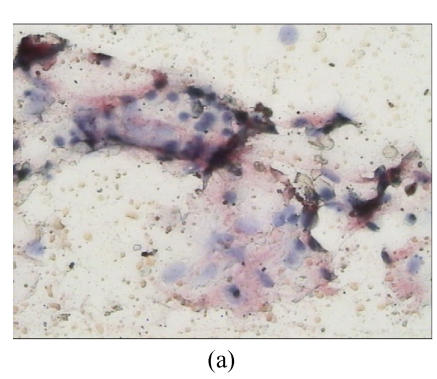
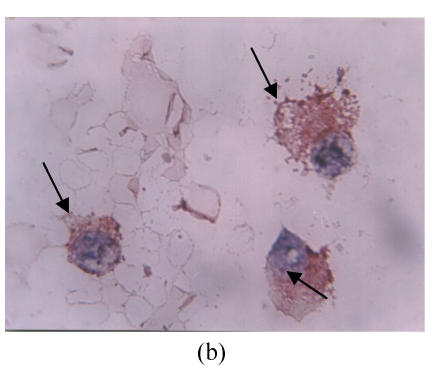
Nineteen of the 27 (70.4%) MM patients were scored as FAS positive, whereas 8 (29.6%) were scored as FAS negative. Figs.1a and 1b illustrate immunohistochemical location of FAS in bone marrow smears (Note: the intensive brown staining of FAS was located in the cytoplasm of MM plasma cells).
Fig. 1.
Immunohistochemical expression of FAS in bone marrow samples from multiple myeloma patients. (a) Low magnification micrograph (200×) showing FAS expression in a bone marrow smear of a sample obtained from one MM patient; (b) Higher magnification (1000×) of the same sample illustrating the cytoplasmic localization of FAS in the myeloma plasma cells. Cells with arrows are the FAS positive; (c) Low magnification micrograph (200×) of FAS expression in one negative sample obtained from one MM patient
Expression of FAS mRNA
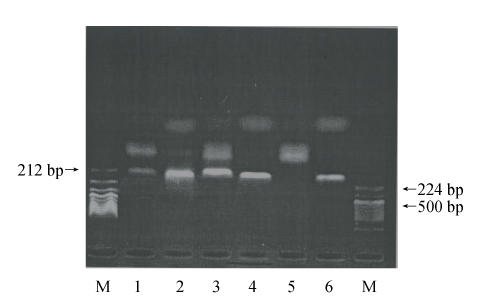
We assessed the presence of FAS mRNA in 2 human myeloma cell lines (U266 and RPMI8226), 27 bone marrow samples obtained from MM patients and 12 PBMCs obtained from healthy donors by RT-PCR. FAS and β-actin RT-PCR amplification products were visualized at their expected length of 212 bp and 224 bp, respectively. The results show that FAS mRNA was highly expressed in U266 and RPMI8226 cells, but was not detected in PBMCs from healthy donors (Fig.2). Twenty-two (81.5%) of the 27 samples obtained from MM patients highly expressed FAS mRNA. Data from 5 cases are shown in Fig.3.
Fig. 2.
FAS mRNA expression by RT-PCR in U266, RPMI8226 and PBMCs from healthy donors. β-actin is shown as internal control
M: DNA marker; 1: RPMI8226/FAS expression; 2: RPMI8226/β-actin expression; 3: U266/FAS expression; 4: U266/β-actin expression; 5: PBMCs from healthy donor/FAS expression; 6: PBMCs from healthy donor/β-actin expression
Fig. 3.
FAS mRNA expression by RT-PCR in bone marrow samples obtained from 5 MM patients
1~5: Cases 1~5
Immunoblot analysis
FAS protein expression was also determined in all samples by immunoblot analysis (Fig.4). FAS protein was detected in 16 (59.3%) of the 27 MM patients and in 2 human myeloma cell lines, but not in PBMCs from 12 healthy donors. As shown in Fig.4, FAS protein is highly expressed in Cases 3 and 4, U266 and RPMI8226 cells.
Fig. 4.
FAS expression by immunoblot analysis in bone marrow samples of MM patients, U266 and RPMI8226 cells and PBMCs from healthy donors
100 μg of proteins per sample were loaded per lane and subjected to SDS-PAGE and Western bloting. β-actin is shown as internal loading control. 1~5: Cases 1~5; 6: U266; 7: RPMI8226; 8: PBMCs from healthy donors
Proliferative inhibition of U266 cells by cerulenin
U266 cells and human skin fibroblasts obtained from a surgical biopsy were cultured in the presence or absence of cerulenin at various concentrations from 5 to 320 μg/ml for 24 h prior to MTT assays. Cerulenin induced dose-dependent decline in metabolic activity/cell proliferation of U266 myeloma cells with over 85% inhibition at 20 μg/ml (Table 1). Importantly, at the same concentration, cerulenin had no significant effect on metabolic activity/cell proliferation of human skin fibroblasts (Table 1). These data reveal that cerulenin specifically inhibits the proliferation of myeloma cells while having no significant effect on normal cells.
Table 1.
Inhibitory rate of metabolic activity/cell proliferation of U266 and human skin fibroblasts assessed by MTT*
| Group | Inhibitory rate (%) |
|
| U266 cells | Normal fibroblasts | |
| DMSO | 22.8±21.6 | 3.6±3.4 |
| Cerulenin (µg/ml) | ||
| 5 | 57.9±6.9 | 7.3±2.2 |
| 10 | 71.3±4.0 | 8.7±4.9 |
| 20 | 85.3±5.1 | 9.2±12.6 |
| 40 | 82.9±2.0 | 12.7±7.5 |
| 80 | 78.9±2.3 | 15.8±3.3 |
| 160 | 76.7±1.7 | 17.3±5.6 |
| 320 | 85.6±4.7 | 20.2±14.5 |
Data are expressed as mean±SD
Cytofluorometric determination of apoptotic cells by Annexin V
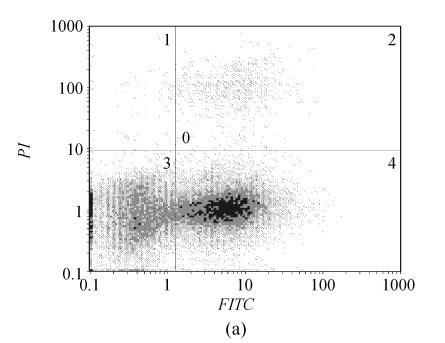
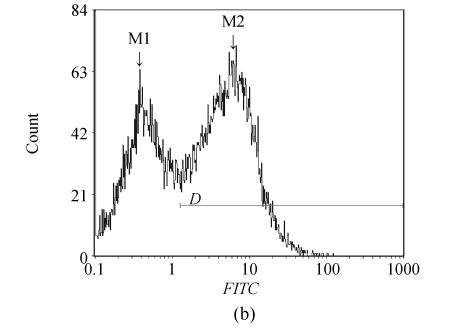
The apoptotic cells were determined by Annexin V/PI staining and flow cytometry 12 and 24 h after cerulenin treatment (20 μg/ml). Cerulenin caused massive apoptosis in U226 cells as illustrated in Fig.5. U266 cells were highly sensitive to cerulenin treatment and exhibited early apoptotic (56.9%, 12 h; 69.3%, 24 h) and late apoptotic and/or necrotic (3.2%, 12h; 17.6%, 24 h) cells. Untreated controls show only 4.3% (12 h) and 1.8% (24 h) positive cells. These data indicate that the FAS inhibitor, cerulenin, induced U266 cells apoptosis.
Fig. 5.
Cerulenin (20 µg/ml, for 12 h) induces apoptosis in the U266 cells. (a) Flow cytometry pictographs: viable cell population (Annexin V−/PI−) in Section 3; early apoptotic cell population (Annexin V+/PI−) in Section 4; late apoptotic and necrotic cell populations in Section 2 (Annexin V+/PI+) and necrotic cell population in Section 1 (Annexin V−/PI+); (b) Cells were treated with 20 µg/ml cerulenin for 12 h and examined by Annexin V staining assay. The M1 and M2 gates indicate Annexin V negative and positive stained populations, respectively
PI: Propidium iodide; FITC: Fluorescein isothiocyanate; M1: Without apoptotic cell; M2: With apoptotic cell; D: Distance
DISCUSSION
The revival in cancer bioenergetics began in the mid-1990s when radiologists showed that positron emission tomography (PET) imaging could detect and map various tumors (Garber, 2006). In PET an injected glucose analog highlights tumors that are hungrier for glucose than normal cells. Tumor cells need an unusual amount of energy to survive and grow (Garber, 2006), so their overall metabolic demand is significantly higher than normal tissues. FAS, a key enzyme in the de novo biosynthesis of fatty acids, is markedly overexpressed in a variety of common human cancers including breast, prostate, colon, endometrial and ovarian cancers (Takahiro et al., 2003). FAS is implicated in tumorigenesis through its role in cell proliferation and membrane lipid incorporation of neoplastic cells (Wang et al., 2001). Carcinoma cells are dependent on endogenous fatty acid synthesis for growth in vitro.
While the biological advantage of endogenous fatty acid synthesis by cancers has not yet been elucidated, the inhibition of fatty acid synthesis at the FAS step ultimately leads to cancer cell death through inhibition of macromolecular synthesis and apoptosis (Menendez and Lupu, 2004).
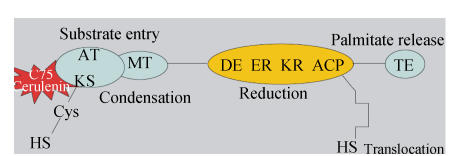
FAS enzymatic complex contains seven separate enzymatic pockets situated as a head-to-tail dimer with the β-ketoacyl synthase (β-KS) and malonyl/acetyl transferase (MT/AT) domains of one monomer working together with the dehydratase (DE), enoyl reductase (ER), ketoacyl reductase (KR), acyl carrier protein (ACP) and thioesterase (TE) domains on the adjacent monomer. These enzymatic domains act sequentially to condense acetyl-CoA with malonyl-CoA to form a four-carbon intermediate. Six additional turns of the enzyme’s cycle convert this intermediate to palmitate, which is then liberated from FAS by the action of the TE domain. Because FAS functions as head-to-tail dimer, targeted inhibition of one of the enzymatic domains of FAS can ablate the activity of one or both FAS subunits. Cerulenin, a natural mycotoxin, is an antagonist of the β-KS domain (the condensing enzyme) of FAS and functions by covalently modifying the active site cysteine, resulting in dead-end inhibition. C75, a synthetic analog of cerulenin, also targets the condensing enzyme and inhibits fatty acid synthesis (Fig.6).
Fig. 6.
Schematic representation of FAS enzymatic complex and target sites of chemical FAS blockers cerulenin and C75 (Menendez and Lupu, 2004)
KS: Ketoacyl synthase; MT: Malonyl transferase; AT: Acetyl transferase (AT); DE: Dehydratase; ER: Enoyl reductase; KR: Ketoacyl reductase; ACP: Acyl carrier protein; TE: Thioesterase; HS: Sulfhydryl
To investigate the potential of targeting FAS for the treatment of multiple myeloma, we determined whether FAS is overexpressed in human multiple myeloma. We found that human multiple myeloma bone marrow samples expressed significantly increased levels of FAS by immunohistochemistry and assessed the presence of mRNA encoding for FAS in human myeloma cell lines (U266 and RPMI8226) and multiple myeloma patients bone marrow plasma cells, compared with PBMCs from healthy donor by RT-PCR. By immunoblot analysis we determined the level of FAS protein expression, which was detected in most MM patients and myeloma cell lines but not in PBMCs from healthy donor. Our findings parallel observations in a variety of common human cancers (Takahiro et al., 2003) and suggest a possible role of FAS inhibition as a new therapeutic target for myeloma.
The inhibition of the fatty acid synthetic pathway with FAS inhibitor, cerulenin, leads to cell death by induction of apoptosis (Gabrielson et al., 2001; Pizer et al., 2001). In our study, cerulenin treatment was shown to inhibit the growth of human myeloma cell line (U266) that overexpressed FAS, and low effects were observed in normal human fibroblasts without FAS expression. When treated with cerulenin, U266 cells exhibited high apoptosis, but no apoptotic effects were observed in the untreated. The results suggest that FAS may be an effective target for pharmacological therapy in human multiple myeloma.
To identify the molecular mechanisms of cerulenin-induced apoptosis, several researches have analyzed change in gene expression profile of cancer cells following exposure to different concentrations of cerulenin. Menendez et al.(2004)’s research demonstrated that pharmacological FAS inhibitors, cerulenin and C75, were found to suppress p185(HER2) oncoprotein expression and similarly, p185(HER2) expression was dramatically down-regulated when FAS gene expression was silenced by using the highly sequence-specific mechanism of RNA interference (RNAi). p185(HER2) is a marker for poor prognosis that is overexpressed in 30% of breast and ovarian cancers. Our research group analyzed the expression changes of apoptosis-related genes by super-Array cDNA on U266 cells after cerulenin treatment. The results showed that after treated with cerulenin for 12 h, 44 apoptosis-related genes expressions in the U266 cells changed, among which 41 were over 2-fold increase and another 3 over 2-fold decrease. The expression of caspase-9 was increased markedly, indicating that mitochondria pathway played a key role in cerulenin-induced apoptosis, and ARAF2 expression changed, suggesting that nuclear factor (NF) participates in cerulenin-induced apoptosis on U266 cells (Wang et al., 2007).
In conclusion, we found that an increased expression of FAS exhibited in MM patients and human myeloma cell lines, and that cerulenin greatly inhibited metabolic activity/cell proliferation of U266 cells and induced apoptosis. Our results suggest that FAS is an effective target for pharmacological therapy in human multiple myeloma.
Footnotes
Project supported by the Medicine and Health Research Fund of Zhejiang Province (No. 2007B091) and the Office of Education of Zhejiang Province, China (No. 20070104)
References
- 1.Camassei FD, Cozza R, Acquaviva A, Jenkner A, Ravà L, Gareri R, Donfrancesco A, Bosman C, Vadalà P, Hadjistilianou T, Boldrini R. Expression of the lipogenic enzyme fatty acid synthase (FAS) in retinoblastoma and its correlation with tumor aggressiveness. Invest Ophthalmol Vis Sci. 2003;44(6):2399–2403. doi: 10.1167/iovs.02-0934. [DOI] [PubMed] [Google Scholar]
- 2.Child JA, Morgan GJ, Davies FE, Owen RG, Bell SE, Hawkins K, Brown J, Drayson MT, Selby PJ. High-dose chemotherapy with haematopoietic stem-cell rescue for multiple myeloma. N Engl J Med. 2002;348(19):1175–1183. doi: 10.1056/NEJMoa022340. [DOI] [PubMed] [Google Scholar]
- 3.Gabrielson EW, Pinn ML, Testa JR, Kuhajda FP. Increased fatty acid synthase is a therapeutic target in mesothelioma. Clin Cancer Res. 2001;7(1):153–157. [PubMed] [Google Scholar]
- 4.Gansler TS, Hardman W, Hunt DA, Schaffel S, Hennigar RA. Increased expression of fatty acid synthase (OA-519) in ovarian neoplasms predicts shorter survival. Hum Pathol. 1997;28(6):686–692. doi: 10.1016/S0046-8177(97)90177-5. [DOI] [PubMed] [Google Scholar]
- 5.Garber K. Energy deregulation: licensing tumors to grow. Science. 2006;312(5777):1158–1159. doi: 10.1126/science.312.5777.1158. [DOI] [PubMed] [Google Scholar]
- 6.Heiligtag SJ, Bredehorst R, David KA. Key role of mitochondria in cerulenin mediated apoptosis. Cell Death Differ. 2002;9(9):1019–1025. doi: 10.1038/sj.cdd.4401055. [DOI] [PubMed] [Google Scholar]
- 7.Kersten S. Mechanisms of nutritional and hormonal regulation of lipogenesis. EMBO Rep. 2001;2(4):282–286. doi: 10.1093/embo-reports/kve071. [DOI] [PMC free article] [PubMed] [Google Scholar]
- 8.Kuehl WM, Bergsagel PL. Multiple myeloma: evolving genetic events and host interactions. Nat Rev Cancer. 2002;2(3):175–187. doi: 10.1038/nrc746. [DOI] [PubMed] [Google Scholar]
- 9.Laemmli UK. Cleavage of structural proteins during the assembly of the head of bacteriophage T4. Nature. 1970;227(5259):680–685. doi: 10.1038/227680a0. [DOI] [PubMed] [Google Scholar]
- 10.Menendez JA, Lupu R. Fatty acid synthase-catalyzed de novo fatty acid biosynthesis: from anabolic-energy-storage pathway in normal tissues to jack-of-all-trades in cancer cells. Arch Immunol Ther Exp. 2004;52(6):414–426. [PubMed] [Google Scholar]
- 11.Menendez JA, Vellon L, Mehmi I, Oza BP, Ropero S, Colomer R, Lupu R. Inhibition of fatty acid synthase (FAS) suppresses HER2/neu (erbB-2) oncogene overexpression in cancer cells. Proc Natl Acad Sci USA. 2004;101(29):10715–10720. doi: 10.1073/pnas.0403390101. [DOI] [PMC free article] [PubMed] [Google Scholar]
- 12.Pizer ES, Pflug BR, Bova GS, Han WF, Udan MS, Nelson JB. Increased fatty acid synthase as a therapeutic target in androgen independent prostate cancer progression. Prostate. 2001;47(2):102–110. doi: 10.1002/pros.1052. [DOI] [PubMed] [Google Scholar]
- 13.Rashid A, Pizer ES, Moga M, Milgraum LZ, Zahurak M, Pasternack GR, Kuhajda FP, Hamilton SR. Elevated expression of fatty acid synthase and fatty acid synthetic activity in colorectal neoplasia. Am J Pathol. 1997;150(1):201–208. [PMC free article] [PubMed] [Google Scholar]
- 14.Swinnen JV, Roskams T, Joniau S, van Poppel H, Oyen R, Baert L, Heyns W, Verhoeven G. Overexpression of fatty acid synthase is an early and common event in the development of prostate cancer. Int J Cancer. 2002;98(1):19–22. doi: 10.1002/ijc.10127. [DOI] [PubMed] [Google Scholar]
- 15.Takahiro T, Shinichi K, Toshimitsu S. Expression of fatty acid synthase as a prognostic indicator in soft tissue sarcomas. Clin Cancer Res. 2003;9(6):2204–2212. [PubMed] [Google Scholar]
- 16.Wang WQ, Zhao XY, Zhang XH, Gong XB. Cerulenin changes apotosis related genes expression in multiple myeloma cell line U266. Zhonghua Xue Ye Xue Za Zhi. 2007;28:239–242. (in Chinese) [PubMed] [Google Scholar]
- 17.Wang Y, Kuhajda FP, Li JN, Pizer ES, Han WF, Sokoll LJ, Chan DW. Fatty acid synthase (FAS) expression in human breast cancer cell culture supernatants and in breast cancer patients. Cancer Lett. 2001;167(1):99–104. doi: 10.1016/S0304-3835(01)00464-5. [DOI] [PubMed] [Google Scholar]


