

Abstract
We describe here different types of horizontal cells in the zebrafish retina and how they connect to photoreceptors. To label horizontal cells, crystals of DiI were placed onto the tips of pulled glass pipettes and inserted into the inner nuclear layer of fixed whole-mount retinas. The DiI-labeled horizontal cells were imaged by confocal microscopy and analyzed according to dendritic arborization, cell depth, dendritic terminal morphology, and connectivity with photoreceptors. Three types of horizontal cells were unequivocally identified: two cone-connecting (H1/2 and H3) and one rod-related cell. H1/2 cells have dendritic terminals that are arranged in “rosette” clusters and that connect to cone photoreceptors without any apparent specificity. H3 cells are larger and have dendritic terminal doublets arranged in a rectilinear pattern. This pattern corresponds to the mosaic of the single cones in the zebrafish photoreceptor mosaic and indicates that H3 cells connect specifically to either the blue-sensitive (long-single) or ultraviolet-sensitive (short-single) cones. Thus, H3 cells are likely to be chromaticity-type cells that process specific color information, whereas H1/2 cells are probably luminosity-type cells that process luminance information. Rod horizontal cells were identified by their shape and dendritic pattern, and they connect with numerous rod photo-receptors via small spherical terminals.
Keywords: DiI, horizontal cells, zebrafish, retina, morphology
Zebrafish (Danio rerio) are especially useful for the study of the vertebrate retina because they are amenable for genetic and developmental investigations. To characterize retinal mutations and understand retinal development, it is essential to know the normal structure and connectivity of the retinal neurons. Although previous studies have focused on the photoreceptors (Branchek and Bremiller, 1984) or ganglion cells (Mangrum et al., 2002), horizontal cells have received relatively little attention. Horizontal cells are second-order, mainly inhibitory neurons that form the antagonistic surrounds of bipolar cell receptive fields and thus aid in detecting light contrasts and edges (Dowling, 1987). Certain horizontal cells, especially in nonmammalian species, also appear to play a role in color vision in that their responses differ depending on stimulus wavelength. How many types of horizontal cells there are and the ways in which horizontal cells connect to photoreceptors in the zebrafish retina are unclear.
Horizontal cells are located in the distal portion of the inner nuclear layer and extend dendritic processes into the outer plexiform layer, where they make synaptic contacts with photoreceptor, bipolar, and interplexiform cells. In zebrafish, cones and rods are arranged in a highly organized mosaic. Five types of photoreceptor exist in the zebrafish retina; double cones, consisting of a red-sensitive principal member and a green-sensitive accessory member, blue-sensitive long-single cones, ultraviolet-sensitive short-single cones, and rods. The cones are arranged in regularly alternating rows of single and double cones (Robinson et al., 1993). In vertebrates, cone and rod terminals contain invaginations into which horizontal and bipolar cell dendrites extend to make ribbon and flat/basal synaptic contacts (Parthe, 1982; Hidaka et al., 1986; Sakai and Naka, 1986; Dowling, 1987). Horizontal cell dendrites typically lie laterally to the synaptic ribbons, whereas bipolar cell terminals lie centrally to the synaptic ribbons, forming a triad arrangement (Allwardt et al., 2001). Other bipolar cell dendrites make flat/basal contacts with the photoreceptor terminals between the ribbon synaptic contacts (Allwardt et al., 2001). In mammalian cone terminals, there is an invagination for every ribbon, but in fish cone terminals, a single invagination encompasses numerous horizontal and bipolar cell dendrites that form triads with the several ribbons found around the invagination (Dowling, 1987).
A previous study by Connaughton and colleagues (2004) identified three horizontal cell types in the zebrafish retina (HA-1, HA-2, and HB) using the DiOlistics method. In the current study, crystals of DiI were inserted into adult zebrafish retinas to label horizontal cells through retrograde diffusion via their axons to determine the kinds of horizontal cells present in the wild-type zebrafish retina and how these horizontal cells connect with photoreceptors. Labeled horizontal cells were reconstructed by confocal microscopy and classified according to morphological criteria such as the spread and shape of the dendritic tree, the pattern of the dendritic synaptic terminals, and the depth of the cell in the inner nuclear layer. Three types of horizontal cell could be unequivocally distinguished: two cone-connected cell types (H1/2 and H3) and one rod-connected cell type. By using a different cell-labeling method and by examining a greater number of cells than previous reports (Connaughton and Dowling, 1998; Connaughton et al., 2004), we present a more comprehensive picture of horizontal cell morphological types and their connectivity with photoreceptors.
MATERIALS AND METHODS
Wild-type, AB-strain adult zebrafish were maintained in the Harvard University Zebrafish Facility. Fish were killed using 4% tricaine (Sigma, St. Louis, MO) in Tris buffer (pH 7.4) for 10 minutes and their spinal cords transected behind the head with a razor blade. Throughout all of the following steps, retinas were kept constantly hydrated with phosphate-buffered solution (PBS; pH 7.4; Sigma) to avoid shrinkage of retinal tissue through desiccation. Eyes were dissected out from the fish and the cornea and lens removed. Retinas were fixed in fresh 4% paraformaldehyde (Fisher Scientific, Fair Lawn, NJ) at 4°C overnight. After a 3 × 10 minute wash in PBS, the sclera and the pigment epithelium were removed from the back of the eyecups. Retinas were flattened into whole-mounts with four or five radial cuts, with the largest cut dorsally. All protocols were approved by the Harvard University Institutional Animal Care and Use Committee and conform to National Institutes of Health animal care guidelines.
Tiny crystals of Celltracker CM-DiI (Invitrogen, Carlsbad, CA) were loaded onto the pulled tips of 1.5-mm-diameter borosilicate glass pipettes, and the pipette was gently inserted into retinal tissue. In most experiments, the DiI was inserted into the retina through the ganglion cell layer side of the retina. Occasionally, the DiI was inserted through the photoreceptor side of the retina to avoid excessive ganglion cell axonal labeling. The best labeling of horizontal cells was achieved when a crystal of DiI was deposited into the retinal tissue rather than left lying on the surface of the retina. Retinas were stored in PBS at 4°C. Labeled horizontal cells could be seen as early as 3 or 4 days after DiI application with a Microphot-FXA epifluorescence microscope equipped with a Cy3 filter (Nikon USA, Melville, NY). Retinas were flat-mounted with the ganglion cell layer up on glass slides and coverslipped in Vectashield medium (Vector Laboratories, Burlingame, CA). Pieces of No. 1 coverslips (VWR Scientific, Media Park, PA) were placed around the retinal tissue on the glass slide to prevent crushing of the retina during microscopy, and slides were coverslipped with No. 0 cover-slips.
Horizontal cells were optically sectioned at 0.3-μm slices and reconstructed using an upright LSM 510 Meta Axioplan 2 Imaging confocal microscope (Carl Zeiss Micro-Imaging, Thornwood, NY). FluoArc argon lasers were used in conjunction with a rhodamine filter to have a longpass configuration of 560 nm for rhodamine. Four objectives were used to collect images at different magnifications: a ×10 Plan-Neofluar objective (0,30), a ×25 Plan-Neofluar oil-immersion corrected objective (0,80), a ×40 Plan-Neofluar oil DIC objective (1,3), and a ×63 Plan-Apochromat oil DIC objective (1,40).
Reconstructed cells were analyzed using the Zeiss LSM Image Browser program (Carl Zeiss MicroImaging) and ImageJ (National Institutes of Health). Horizontal cells were measured according to their major dendritic axis, minor dendritic axis, and cell depth. Major axis length was measured as the longest distance found between two dendritic process terminals of a cell. Minor axis length was measured as the longest distance found between two dendritic process terminals on an axis perpendicular to the major axis. Cell depth was measured from the proximal side of the soma to the distal end of the dendritic terminals. This was done by scrolling through the slices of a reconstructed cell and noting where the cell's fluorescence began and ended, then comparing this measurement against a vertical projection of the cell. Cluster analyses were performed in SPSS 11 for Mac OS X (SPSS Inc., Chicago, IL). Statistical analysis for comparing major dendritic axis, minor dendritic axis, and number of rosette clusters was performed using an unpaired two-sample t-test assuming unequal variances (Microsoft Excel 2004 for Mac; Microsoft, Redmond, WA).
Reconstructed cells were flattened by projecting the maximum pixel values onto a single plane (Group Zprojector ImageJ plug-in, Holly Mountain Software); this helped in visualizing overall cell morphology. To see the cell body's morphology and the cell's synaptic patterns separately, stacks of image slices were divided into multiple stacks (Slice Remover ImageJ plug-in, Wayne Rasband, National Institutes of Health). Confocal images and figures were edited in Adobe Photoshop 7.0 (Adobe Systems Inc., San Jose, CA). Some figures were adjusted for contrast, and most figures are presented in gray scale, because cell features are more easily distinguished in black and white.
RESULTS
Because most of the DiI crystals were inserted through the inner layers of the retina, usually only ganglion cells were labeled with the DiI. In only about one of 40 insertions was a successful horizontal cell “bloom” observed, in which 20 −30 of horizontal cells were labeled around a DiI crystal. Individual horizontal cells were clearly observed because they took up DiI through their axons and were positioned away from the fluorescent flare of the crystal. The axons in horizontal cell blooms proceeded in all directions from the DiI crystals. An example of an individual horizontal cell away from a DiI bloom is shown in Figure 1A (boxed area is shown at higher magnification in Fig. 1B). The DiI labeling was often patchy, as shown here, but nevertheless the full extent of a labeled cell, including its dendritic terminals, could be discerned. Although adjacent cells often labeled with different intensities, certain cell types did not tend to label more or less than others, and the cell bodies themselves did not overlap.
Fig. 1.

Confocal images of horizontal cells labeled by a DiI crystal. A: Horizontal cells labeled around the DiI insertion site. Cell bodies are labeled up to hundreds of micrometers away from the DiI insertion site. Box indicates the cell shown in B. B: An H3 horizontal cell retrogradely labeled via its axon with DiI. Scale bars = 50 μm in A; 20 μm in B.
Morphology of H1/2 and H3 horizontal cells
We initially classified the horizontal cells into four sub-types based on somal size, dendritic spread, and general appearance (Fig. 2A). Three of the subtypes resembled the H1, H2, and H3 cone horizontal cells described by Stell and Lightfoot (1975) in the goldfish retina, so we adopted Stell and Lightfoot's terminology for these cells. All three types of these cells were found throughout the retina.
Fig. 2.

Horizontal cells have different cell body morphologies and dendritic patterns. Confocal projections of horizontal cells labeled with DiI. A: Projection of the cell bodies of two H1/2 horizontal cells next to one H3 cell. The H3 cell has a larger dendritic spread and a more stellate branching pattern than the H1/2 cells. B: Projection of the dendritic terminals of the cells from A. The dendritic terminals of only two of the cells are shown because of the orientation of the retina during imaging. The H1/2 cell shows a dense dendritic pattern with some “rosette”-like clusters of dendritic terminals (arrowhead), whereas the H3 cell exhibits regularly spaced doublets of dendritic terminals over a wider area (arrow). Scale bars = 10 μm.
As in goldfish, the zebrafish H1 and H2 cells had a distinctly different dendritic branching pattern compared with the H3 cells. H3 cells had more widely branched and stellate dendritic processes than the H1 and H2 cells, whose dendritic processes did not extend far from the cell body (Fig. 2A). H3 cells had a rectilinear pattern of dendritic terminal doublets, whereas the H1 and H2 cells did not have a distinct pattern for their clusters of terminals (Fig. 2B).
Type-specimen H1 horizontal cells had short, finger-like dendrites (Fig. 3A), whereas type-specimen H2 cells had more elongated dendrites that were tendril-like (Fig. 3C). Many of the dendritic terminals on both H1 and H2 cells resembled “rosette” clusters consisting of five or six dendritic terminal boutons arrayed in a circular fashion. When followed through a series of confocal slices, rosettes came from a single dendritic process that branched out, forming the rosette. Partial rosettes and single terminal boutons were also observed on H1 and H2 cells (Fig. 3B,D).
Fig. 3.

Type-specimen H1 and H2 cells. A: H1 cell. Dendrites can be polygonal or short and close to the cell body. B: Dendritic terminals of H1 cells. Terminals appear as clustered “rosettes,” as partial rosettes, or as individual boutons. C: H2 cell. H2 cells have a wider dendritic spread than H1 cells. D: Dendritic terminals of H2 cells. The dendritic terminals of H2 cells also appear as clustered rosettes, partial rosettes, or individual boutons. DiI labeling can create bright spots in cell bodies (A,C) that could be the stems of dendrites. Scale bars = 10 μm in A (applies to A,B); 10 μm in C (applies to C,D).
H1 and H2 cells formed a group of smaller horizontal cells, 122 in number. Stell and Lightfoot (1975) found that goldfish H1 and H2 cells appeared as a “continuum” in flat preparations but could be distinguished by their profiles in vertical sections. With this method, confocal slices of the 122 smaller horizontal cells were examined in vertical projection. Cells that exhibited round and squat body shapes were called H1 cells, whereas cells with wider and more tapered profiles were designated as H2 cells; 40 cells could not be unequivocally classified in this way. Quantitative measurements were then made on the 122 cells using a two-cluster analysis and variables consisting of cell thickness, major dendritic axis, and minor dendritic axis. The analysis revealed that the cells could not be clearly differentiated as distinct types based on these quantitative measurements (see below). Because H1 and H2 cells often had similar morphological characteristics and could not be differentiated by quantitative criteria, we combined them into a single group designated as H1/2 cells.
As noted earlier, H3 cells could be easily distinguished from H1/2 cells by the shape and spread of their dendritic tree. H3 cell dendrites were stellate and elongated and extended away from the soma over several cell body lengths (Fig. 4A). Furthermore, the dendritic terminals of H3 cells were arranged in a “rhomboid,” rectilinear pattern similar to the cells identified by Stell and Lightfoot (1975; Figs. 2B, 4C). This pattern could appear as a square pattern for certain cells. The dendritic terminals were not arranged in rosette clusters, but rather in a series of doublets that were usually aligned along one axis of the rhomboid pattern (Fig. 4C–E).
Fig. 4.
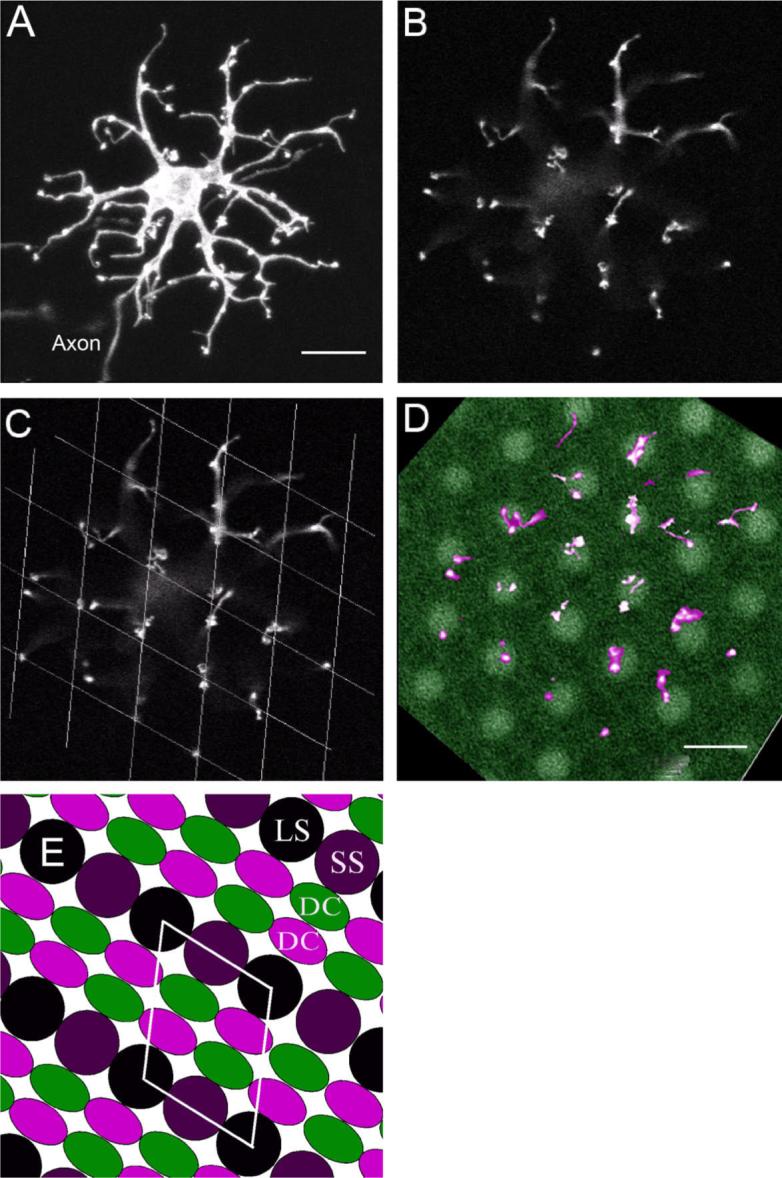
H3 type-specimen cell labeled with DiI. A: Projection of the entire cell. B: Dendritic terminals are arranged in parallel doublets. C: Dendritic terminals with a rhomboid grid overlay. D: Dendritic terminals (magenta) overlaid with the short-single cone mosaic diffusely labeled with DiI (green). E: Diagram of the zebrafish cone photoreceptor mosaic. The dendritic terminals of H3 cells correspond to the photoreceptor mosaic pattern of either short-single (SS) or long-single (LS) cones (yellow rhombus), whereas the double-cone (DC) positions would not match the dendritic pattern of the H3 cell. Scale bars = 10 μm in A (applies to A–C); 10 μm in D.
Finally, axons emerged as an extension from the cell body or from a dendritic process from nearly all H1/2 and H3 cells. Axons were clearly observed on 79 of 82 H1/2 horizontal cells studied (Fig. 3A,C) and 21 of 23 H3 cells examined (Fig. 4A). The two H3 cells without visible axons were partially obscured by neighboring cells.
Quantitative differences between H1/2 and H3 cells
In total, 145 horizontal cells were measured according to their major and minor dendritic axes and cell depth (Table 1). The perikaryal area of the horizontal cells was not measured, because it was difficult to delineate between the cell body area and proximal cell processes. A scatterplot of cell depth vs. major axis length (Fig. 5A) and a graph of minor axis vs. major axis length (Fig. 5B) revealed two clear groupings of cells. One group of horizontal cells clumped around 10 μm in cell depth, 29 μm in major axis, and 20 μm in minor axis, whereas the other group of horizontal cells clumped around 13 μm in cell depth, 50 μm in major axis, and 40 μm in minor axis. Histograms of major and minor axis length (Fig. 5C,D) also showed distinct differences between the two groups of cells, reflecting the distributions of the two groups of cells seen in the scatterplots. The cell depth of all horizontal cells, however, exhibited more of a continuum of measurement than did the major and minor axis measurements (Fig. 5E). The group of larger horizontal cells corresponded to the H3 cells that were always readily identifiable by their shape.
TABLE 1.
Dimensions and Characteristics of H1/2 and H3 Cells1
| H1/2 (n = 82) | H3 (n = 23) | |
|---|---|---|
| Entire cell depth (μm) | 10.1 ± 1.7 | 12.9 ± 2.8* |
| Major dendritic axis (μm) | 29.1 ± 5.3 | 47.9 ± 4.4* |
| Minor dendritic axis (μm) | 20.3 ± 3.8 | 37.8 ± 5.0* |
| Presence of axon | Yes | Yes |
| No. of cones contacted | 17.2 ± 3.7 | 15.9 ± 2.7 |
| Full rosette clusters | 4.4 ± 1.5 | Not applicable |
Major axis length was measured as the longest distance found between two dendritic process terminals of a cell. Minor axis length was measured as the longest distance found between two dendritic process terminals on an axis perpendicular to the major axis. Entire cell depth was measured from the proximal side of the soma to the distal end of the dendritic terminals. The presence of an axon was determined by following axon-like processes of horizontal cells during confocal reconstruction. The number of cones that each cell contacted was measured by counting full rosette clusters, partial clusters, and single boutons as contacts to one cone. Full rosette clusters of H1/2 cells consisted of five or six dendritic terminal boutons arranged within one circular bundle. A two-sample t-test assuming unequal variance was used to compare the H1/2 cells and the H3 cells.
The three parameters compared were significant at P < 0.001.
Fig. 5.

Measurements of horizontal cells across the retina. A: Scatterplot of entire cell-depth vs. major axis length. H1/2 horizontal cells are clumped at about 10 μm in cell depth and 30 μm in major axis, whereas the H3 horizontal cells are clumped at about 13 μm in cell depth and 50 μm in major axis. B: Scatterplot of minor axis vs. major axis. H1/2 cells have dendritic fields of about 20 × 30 μm, and H3 horizontal cells have dendritic fields of about 40 × 50 μm. C: Histogram of major axis length. H1/2 horizontal cells exhibit a peak number of cases at 28 μm, and H3 horizontal cells peak at 48 μm. D: Histogram of minor axis length. H1/2 horizontal cells exhibit a peak number of cases at 20−24 μm, and H3 horizontal cells peak at 36−40 μm. E: Histogram of entire cell depth. The cell depths of all horizontal cells exhibit more of a continuum of measurements than do the major and minor axis measurements. F: Major axis length (horizontal line) was measured as the longest distance found between two dendritic process terminals of a cell. Minor axis length (vertical line) was measured as the longest distance found between two dendritic process terminals on an axis perpendicular to the major axis. G: Vertical projection of the cell looking down the length of the major axis. Entire cell depth (vertical line) was measured from the proximal side of the soma to the distal end of the dendritic terminals.
H1/2 horizontal cells (n = 82) were 10.1 ± 1.7 μm in depth, had a dendritic major axis of 29.1 ± 5.2 μm, and had a dendritic minor axis of 20.3 ± 3.8 μm. We measured 108 fully labeled rosette clusters on 30 different H1/2 cells, and the average diameter of the clusters was 3.28 ± 0.22 μm. As noted earlier, H1/2 cells could also have partial rosettes and single dendritic terminals (Fig. 3B,D). The number of cones that each H1/2 cell contacted was measured by counting full rosette clusters, partial clusters, and single boutons on one cell. Assuming that each cluster, partial cluster, or single terminal bouton contacted a different cone, H1/2 cells contacted 17.2 ± 3.7 cones and had 4.4 ± 1.5 full rosettes.
The H3 horizontal cells (n = 23) were 12.9 ± 2.8 μm in cell depth, had a dendritic major axis of 47.9 ± 4.4 μm, and had a dendritic minor axis of 37.8 ± 5 μm. The number of cones that each H3 cell contacted was counted by attributing each doublet or unpaired doublet component as a contact to one cone. Each H3 cell contacted 15.9 ± 2.7 cones. In total, 98 dendritic doublets were measured on 12 H3 horizontal cells, and the individual boutons that made up the doublets were 2.95 ± 0.76 μm apart from each other.
Rod horizontal cells
Two examples of rod-connecting horizontal cells were found. Both cells appeared to have taken up DiI through an H1/2 cell that lay directly adjacent to the rod horizontal cell, so the rod horizontal cells were very lightly labeled. The dendritic fields of these two horizontal cells were larger than those of the H1/2 cells, and the main rod horizontal cell dendritic processes were longer and thicker (Fig. 6A). The rod horizontal cell's dendritic terminals were small, spherical singlets that were numerous within the dendritic field (Fig. 6B) compared with the cluster terminals typical of H1/2 cells. The total number of rod horizontal cell dendritic terminals could not be counted because of the presence of the adjacent H1/2 cells, but Figure 6C suggests that the number of rod terminals contacted could be in excess of 50. The dendritic terminals of the rod horizontal cell extended farther distally into the outer plexiform layer than the terminals of the H1/2 cell (Fig. 6C). However, the rod horizontal cell perikarya lay more proximally within the inner nuclear layer than did the H1/2 cells (Fig. 6D). Because of the bright labeling and overlap of the H1/2 cells, morphological dimensions of the rod horizontal cells could not be measured accurately.
Fig. 6.

A rod horizontal cell identified below an H1/2 horizontal cell. Black and white are reversed for clarity. A: Projection of cell bodies and dendrites of the H1/2 cell and the rod horizontal cell. A white line demarcates visible parts of the rod horizontal cell. The dendritic field of the rod horizontal cell is larger than that of the H1/2 cell, and the rod horizontal cell's dendritic processes are longer and thinner in shape. B: The H1/2 cell has dendritic terminal clusters, whereas the rod horizontal cell has small spherical terminals. The H1/2 cell's terminals exhibit the bright clusters typical of H1/2 cells, whereas the rod horizontal cell's dendritic terminals are smaller, spherical, and more numerous within the dendritic field. C: The dendritic terminals of the rod horizontal cell extend more distally beyond the outer plexiform layer than the H1/2 cell. D: Vertical projection of both cells. Horizontal lines indicate positions of B and C. Scale bar = 10 μm in A.
A summary diagram (Fig. 7) depicts the different types of horizontal cells found in the adult zebrafish retina. As noted above, although distinct examples of H1 and H2 cells could be observed (Fig. 4), we were unable to find any criterion that unequivocally distinguished the two cell types, so we labeled them as H1/2 cells.
Fig. 7.

Summary diagram of the horizontal cells of the zebrafish retina. Outer plexiform layer (OPL), inner nuclear layer (INL), horizontal cell (HC). The rod horizontal cell drawings are what rod horizontal cells might look like based on the two specimens found. Scale bar = 20 μm.
DISCUSSION
Horizontal cells labeled with DiI
DiI has been used to label individual retinal neurons in several different species (Sandmann et al., 1996; Chan and Grünert 1998; Mangrum et al., 2002; Kao and Sterling, 2003; Connaughton et al., 2004; Reese et al., 2005). An advantage of using DiI to label neurons is that, when individual cells are imaged by confocal microscopy in flat, whole-mount preparations, the entire view of the dendritic arbors and terminals of the cell can be obtained. A benefit of using DiI in the retina is that a properly placed crystal of DiI will give rise to a “bloom” of horizontal cells labeled via their axons. It is likely that the ideal position of the DiI crystal for labeling horizontal cells is in the inner nuclear layer, proximal to the horizontal cells themselves. This is the layer of the retina where horizontal cell axons create a “plexus” or network interspersed among the cell bodies in the inner nuclear layer (Stell, 1975; Parthe, 1982). It is interesting to note that stained horizontal cells were observed all around a DiI crystal (Fig. 1) suggesting that horizontal cell axons radiate in all directions. As shown in Figure 1, the stained cells were typically 200−300 μm away from the crystal and seldom closer. This suggests that the DiI can enter an axon only at specific locations, perhaps only along their fusiform endings, and not all along the axon (Stell, 1975; Marshak and Dowling, 1987)
Inserting the crystal into the zebrafish retina to label horizontal cells poses several challenges. The whole-mounted zebrafish retina is only about 3 mm in diameter, so inserting crystals requires many trials to label large numbers of horizontal cells. Often, the inserted crystals of DiI did not give rise to reconstructable horizontal cells for several reasons, including excessive labeling of the ganglion cells or because the DiI crystal was not placed correctly in the retina. Because horizontal cells lie in the middle of the retina, they were sometimes difficult to image with higher objective lenses (×40 and ×63) because of tissue thickness.
A possible limitation of the crystal insertion method is that there might be axonless horizontal cells that do not stain. Although about 150 horizontal cells were imaged in this study, only two specimens of axonless rod horizontal cells were found, and only five other horizontal cells did not have a clearly observable axon. Another DiOlistics technique, however, has the potential to detect cells without axons. In this method, bead microcarriers coated with DiI or other fluorescent dyes are shot into the retina, where the microcarriers label individual cells. Axonless horizontal cells were observed by this DiOlistics method in the wild-type zebrafish retina (Connaughton et al., 2004). About half of all horizontal cells found in that study were axonless, and no axons were observed on two of the three horizontal cell types (HA-1 and HB). It is possible that axons were not observed on these cells because they were imaged in side view slices. Alternatively, the axons could have been cut during sectioning or oriented along the plan of the retinal slice and missed. Although the three axonless HA-1 cells from the Connaughton study may constitute a class of axonless cone horizontal cell that went unobserved with our crystal insertion method, the dendritic field sizes of the HA-1 cells in the Connaughton et al. study indicate that they are similar to the H1/2 cells of this study.
The HB cells found in Connaughton's study are likely the H3 cells observed in the current study. The flat, laminar morphology of HB cells corresponds to the wide branching H3 cells, although the measured dendritic field size of 39 μm for HB cells is slightly smaller than the dendritic field dimensions of H3 cells (38 × 48 μm). Although H3 cells had axons and HB cells did not, fine extensions were occasionally observed to extend from the HB cell bodies suggestive of initial axonal segments. Thus, we believe the HB and H3 cells are the same type of horizontal cell and suggest that approaching cells from a top-down and whole-mount orientation allows more features of the cell to be imaged.
Finally, Connaughton and Dowling (1998) dissociated and cultured adult zebrafish retinal cells. Their type A horizontal cells had a major dendritic axis measuring 25 ± 1.1 μm and a minor dendritic axis measuring 20 ± 0.9 μm, whereas the major axis of the H1/2 cells described here was 29.1 ± 5.3 μm and the minor axis 20.3 ± 3.8 μm. The major dendritic axis of their type B horizontal cells was 39 ± 2.4 μm and the minor dendritic axis was 22 ± 1.8 μm, whereas the major and minor dendritic axes of our H3 cells were 47.9 ± 4.4 μm and 37.8 ± 5 μm, respectively. Thus, H1/2 and H3 cell types identified in this study are quantitatively similar to their type A and B cells.
Type H1/2 horizontal cells: one subtype or two?
The dimensions and morphological characteristics of H1 and H2 cells are quite similar, although the cells we initially identified as H2 cells were slightly larger than H1 cells (Fig. 3). One possible explanation for the difference in cell size between H1 and H2 cells is that they are found in different retinal locations. There is an area centralis in the zebrafish retina that has a high concentration of small cells (Mangrum et al., 2002). Retinal cells of the same type can look quite different depending on whether they are located centrally or peripherally (Boycott and Wäsle, 1974).
Although H1 and H2 cells could make up a single group of horizontal cells, clear examples of distinguishable H1 and H2 cells were found mixed together in the same retinal regions. In the goldfish retina, H1 and H2 cells are also nearly identical in quantitative morphological measurements and look similar in whole-mount preparations, but they are clearly distinguished by their vertical profiles as well as by electron microscopy of their connections with cone photoreceptors (Stell et al., 1982). Electron microscopy of zebrafish cone pedicle synapses is needed to distinguish H1 from H2 cells conclusively. Finally, the zebrafish retina may have all four horizontal cell types common to cyprinid fish based on horizontal cell density estimates (Marc and Cameron, 2001).
Dendritic terminal clusters of H1/2 and H3 cells
Overlaying images of the terminal boutons of H1/2 cells on images of the photoreceptor mosaic (see Fig. 4D) did not reveal a specificity of cone connections. Thus, zebrafish H1/2 cells probably connect indiscriminately with the cones distal to them. The full terminal rosettes of H1/2 cells match roughly in size the diameters of the various cones, suggesting that some cone terminals receive most, if not all, of their horizontal cell contacts from just one cell. Insofar as H1/2 horizontal cells also have partial clusters and even single boutons, other cone terminals must have contacts with several horizontal cells. It might seem surprising that some cone terminals are in contact with just one or a few horizontal cells, whereas others may be in contact with many horizontal cells, but, because horizontal cells of the same type are extensively coupled to each other via gap (electrical) junctions (Lasater and Dowling, 1985), this morphological difference may make no difference physiologically.
H3 cells exhibit a distinctive dendritic terminal pattern, in which the dendritic terminals appear as doublets arranged in a rhomboid pattern. Two adjacent H3 cells can both contribute one process to a dendritic doublet, or two different dendritic processes on one H3 cell can converge to form a doublet. Doublets were usually aligned in one orientation along the rhomboid pattern. Doublets were typically about 3 μm in length, compared with the 3.3 μm diameter of dendritic rosette clusters of H1/2 cells.
When the dendritic terminal pattern of an H3 cells is superimposed on the mosaic of short-single cones, it can be seen that the pattern of the H3 cell's terminals corresponds well with the single cones in the mosaic (Fig. 4D). Short-single and long-single cones have the same dimensional spacing in the photoreceptor mosaic (Robinson et al., 1993; Fadool, 2003; Fig. 4E), so it is likely that H3 cells connect selectively with either short-single or long-single cones. The H3 dendritic pattern is clearly inconsistent with the double-cone (long-wavelength sensitive cones) arrangement in the zebrafish photoreceptor mosaic.
Cone pedicles in the zebrafish have at least four to six synaptic ribbons, and horizontal cell terminals are the most numerous processes in the pedicles. Therefore, H3 doublets can never account for all of the horizontal cell contacts made with the cones they contact; rather they must share cone contacts with other horizontal cells. The doublet structure may give H3 cells further connective specificity within the cone pedicle itself. The doublets, which are often aligned along one axis of the H3 rhomboid grid, could pick specifically oriented ribbon synapses in the pedicles.
The H3 cells of the zebrafish are similar to the H3 cells of the goldfish retina (Stell and Lightfoot, 1975). Goldfish H3 cells also selectively contact short-single and miniature-single cones and are responsible for short-wavelength processing. The degree of similarity between goldfish and zebrafish H3 cells further suggests that the zebrafish H3 cells are probably also involved in color-specific coding from one type of cone photoreceptor. Therefore, H3 cells are most likely chromatic horizontal cells because of their selective connectivity with photoreceptor types.
Connaughton and Nelson (2007) recently reported in a poster presentation that they had identified physiologically two basic types of horizontal cells in zebrafish based on full-field light responses recorded in light-adapted retinal eyecup preparations. One type was a luminosity cell, hyperpolarizing to all wavelengths. Two subtypes of these cells were identified; one responded maximally to red light; the other equally to red and green light. These cells are likely to be the H1/2 cells. The other type was a chromaticity cell. Here four subtypes were identified; one was biphasic, two triphasic, and one tetraphasic. The biphasic, one triphasic, and the tetraphasic subtypes responded maximally to blue light, whereas the other triphasic cell responded maximally to UV light. These cells are most likely the H3 cells.
Rod horizontal cells
Two specimens of rod horizontal cells were identified among the 147 horizontal cells studied. No isolated rod horizontal cells were identified, probably because our DiI crystal insertion method requires an axon to take up DiI and label a cell away from the fluorescent flare of the DiI crystal. Teleost rod horizontal cells have no axons and usually lie proximally in the inner nuclear layer to cone horizontal cells (Djamgoz et al., 1995; Marc and Cameron, 2001). The dendrites of teleostean rod horizontal cells extend farther distally than those of cone horizontal cells, because rod terminals end more distally than do cone pedicles. The terminals of fish rod horizontal cell dendrites are small, spheroidal knobs whose size is proportional to the small dimensions of the rod terminals. The cells identified in this study as rod horizontal cells meet these criteria. Therefore, we are confident of this identification even though entire cells could not be imaged and measured, nor could the exclusiveness of their contacts with rods verified be directly.
Given the nature of the crystal insertion method, it is interesting that any rod horizontal cells were found. In both cases, the rod cells appeared to have taken up DiI from an adjacent H1/2 cell. The H1/2 cells were strikingly labeled, whereas the two rod horizontal cells were weakly labeled. Cone and rod horizontal cells do not form gap junctions with each other. Thus, the DiI likely passed from the labeled H1/2 cell to the rod horizontal cell via abnormal cell-to-cell contact.
Rod photoreceptors are arranged in a mosaic in between the cone photoreceptors in the zebrafish retina (Fadool, 2003). The rod horizontal cell dendritic terminals did not seem to have a discrete pattern (Fig. 6B,C), but the gaps between terminals are probably the locations of the cone photoreceptor pedicles. Examining more rod horizontal cells could reveal a pattern of connectivity with rod photoreceptors. The DiOlistics method may be more useful for studying zebrafish rod horizontal cells, inbsofar as it may be better able to label individual cells that do not have axons (Connaughton et al., 2004).
ACKNOWLEDGMENTS
The authors thank Dr. Ethan Cohen for the experimental concepts and training (P.I.S.), Dr. Pamela Kainz for feedback, and Dr. Leanne Godinho for critically reading the manuscript. The authors also thank Jessica Miller and Sal Sciascia in the Harvard Zebrafish Facility for their help in rearing and maintaining the fish.
Grant sponsor: Harvard College Research Fund (to P.I.S.); Grant sponsor: National Institutes of Health Individual NRSA Fellowship; Grant number: EY14790 (to J.I.M.); Grant sponsor: National Institutes of Health; Grant number: RO1 EY00811 (to J.E.D.).
LITERATURE CITED
- Allwardt BA, Lall AB, Brockerhoff SE, Dowling JE. Synapse formation is arrested in retinal photoreceptors of the zebrafish nrc mutant. J Neurosci. 2001;21:2330–2342. doi: 10.1523/JNEUROSCI.21-07-02330.2001. [DOI] [PMC free article] [PubMed] [Google Scholar]
- Boycott BB, Wässle H. The morphological types of ganglion cells of the domestic cat's retina. J Physiol. 1974;240:397–419. doi: 10.1113/jphysiol.1974.sp010616. [DOI] [PMC free article] [PubMed] [Google Scholar]
- Branchek T, Bremiller R. The development of photoreceptors in the zebrafish, Danio rerio. I. Structure. J Comp Neurol. 1984;224:107–115. doi: 10.1002/cne.902240109. [DOI] [PubMed] [Google Scholar]
- Chan TL, Grünert U. Horizontal cell connections with short wavelength-sensitive cones in the retina: a comparison between New World and Old World primates. J Comp Neurol. 1998;393:196–209. [PubMed] [Google Scholar]
- Connaughton VP, Dowling JE. Comparative morphology of distal neurons in larval and adult zebrafish retinas. Vis Res. 1998;38:13–18. doi: 10.1016/s0042-6989(97)00146-6. [DOI] [PubMed] [Google Scholar]
- Connaughton VP, Nelson R. Light responses from puresumed horizontal and amacrine cells in zebrafish retina. Invest Ophthalmol Vis Sci. 2007;48:E-abstract 5957. [Google Scholar]
- Connaughton VP, Graham D, Nelson R. Identification and morphological classification of horizontal, bipolar, and amacrine cells within the zebrafish retina. J Comp Neurol. 2004;477:371–385. doi: 10.1002/cne.20261. [DOI] [PubMed] [Google Scholar]
- Djamgoz MBA, Wagner H-J, Witkovsky P. Photoreceptor-horizontal cell connectivity, synaptic transmission and neuromodulation. In: Djamgoz M, Archer S, Vallerga S, editors. Neurobiology and clinical aspects of the outer retina. Chapman & Hall; London: 1995. pp. 155–193. [Google Scholar]
- Dowling JE. The retina: an approachable part of the brain. Belknap-Harvard; Cambridge, MA: 1987. [Google Scholar]
- Fadool JM. Development of a rod photoreceptor mosaic revealed in transgenic zebrafish. Dev Biol. 2003;258:277–290. doi: 10.1016/s0012-1606(03)00125-8. [DOI] [PubMed] [Google Scholar]
- Hidaka S, Christensen BN, Naka K-I. The synaptic ultrastructure in the outer plexiform layer of the catfish retina: a three-dimensional study with HVEM and conventional EM of Golgi-impregnated bipolar and horizontal cells. J Comp Neurol. 1986;247:181–199. doi: 10.1002/cne.902470205. [DOI] [PubMed] [Google Scholar]
- Kao YH, Sterling P. Matching neural morphology to molecular expression: single cell injection following immunostaining. J Neurocytol. 2003;32:245–251. doi: 10.1023/B:NEUR.0000010083.03446.78. [DOI] [PubMed] [Google Scholar]
- Lasater EM, Dowling JE. Dopamine decreases conductance of the electrical junctions between cultured retinal horizontal cells. Proc Natl Acad Sci U S A. 1985;82:3025–3029. doi: 10.1073/pnas.82.9.3025. [DOI] [PMC free article] [PubMed] [Google Scholar]
- Mangrum WI, Dowling JE, Cohen ED. A morphological classification of ganglion cells in the zebrafish retina. Vis Neurosci. 2002;19:767–779. doi: 10.1017/s0952523802196076. [DOI] [PubMed] [Google Scholar]
- Marc RE, Cameron D. A molecular phenotype atlas of the zebrafish retina. J Neurocytol. 2001;30:593–654. doi: 10.1023/a:1016516818393. [DOI] [PubMed] [Google Scholar]
- Marshak DW, Dowling JE. Synapses of cone horizontal cell axons in goldfish retina. J Comp Neurol. 1987;256:430–443. doi: 10.1002/cne.902560310. [DOI] [PubMed] [Google Scholar]
- Parthe V. Horizontal cells in the teleost retina. In: Drujan B, editor. The S-potential. Alan R. Liss; New York: 1982. pp. 31–49. [PubMed] [Google Scholar]
- Reese BE, Raven MA, Stagg SB. Afferents and homotypic neighbors regulate horizontal cell morphology, connectivity, and retinal coverage. J Neurosci. 2005;25:2167–2175. doi: 10.1523/JNEUROSCI.4876-04.2005. [DOI] [PMC free article] [PubMed] [Google Scholar]
- Robinson J, Schmitt EA, Harosi FI, Reece RJ, Dowling JE. Zebrafish ultraviolet visual pigment: absorption spectrum, sequence, and localization. Proc Natl Acad Sci U S A. 1993;90:6009–6012. doi: 10.1073/pnas.90.13.6009. [DOI] [PMC free article] [PubMed] [Google Scholar]
- Sakai HM, Naka K-I. Synaptic organization of the cone horizontal cells in the catfish retina. J Comp Neurol. 1986;245:107–115. doi: 10.1002/cne.902450108. [DOI] [PubMed] [Google Scholar]
- Sandmann D, Boycott BB, Peichl L. Blue-cone horizontal cells in the retinae of horses and other equidae. J Neurosci. 1996;16:3381–3396. doi: 10.1523/JNEUROSCI.16-10-03381.1996. [DOI] [PMC free article] [PubMed] [Google Scholar]
- Stell WK. Horizontal cell axons and axon terminals in goldfish retina. J Comp Neurol. 1975;159:503–520. doi: 10.1002/cne.901590405. [DOI] [PubMed] [Google Scholar]
- Stell WK, Lightfoot DO. Color-specific interconnections of cones and horizontal cells in the retina of the goldfish. J Comp Neurol. 1975;159:473–502. doi: 10.1002/cne.901590404. [DOI] [PubMed] [Google Scholar]
- Stell WK, Kretz R, Lightfoot DO. Horizontal cell connectivity in goldfish. In: Drujan B, editor. The S-potential. Alan R. Liss; New York: 1982. pp. 51–75. [PubMed] [Google Scholar]