

Abstract
Objective
The objective was to compare targeting increased eating of healthy foods vs. reducing intake of high energy-dense foods within the context of a family-based behavioral weight control program.
Methods and Procedures
Forty-one 8−12 year-old children >85th BMI percentile were randomly assigned to a 24-month family-based behavioral treatment that targeted increasing fruits and vegetables and low-fat dairy vs. reducing intake of high energy-dense foods.
Results
Children in the increase healthy food group showed greater reduction in zBMI compared to children in the reduce high energy-dense food group at 12- (−0.30 zBMI units vs. −0.15 zBMI units, P = 0.01) and 24- (−0.36 zBMI units vs −0.13 zBMI units, P = 0.04) month follow-up. Parents in the increase healthy food group showed greater reductions in concern about child weight (P = 0.007), and these changes were associated with child zBMI change (P = 0.008). Children in the reduce high energy-dense group showed larger sustained reductions in high energy-dense foods (P < 0.05). Baseline levels of high energy-dense foods (P < 0.05), parent food restraint (P = 0.01), parent concern over parent weight (P = 0.01) and parent acceptance of the child (P < 0.05) moderated child zBMI change, with greater sustained reductions in zBMI for children in the increase healthy food group for each measure. Parent zBMI change followed the same pattern as child changes, and parent and child zBMI changes were correlated (P < 0.001).
Discussion
Focusing on healthy food choices within an energy restricted diet may be useful in family-based weight control programs.
INTRODUCTION
Treating obesity in youth involves shifting positive energy balance to negative energy balance, with one important component of treatment a reduction in energy intake. The traditional approach to reducing energy intake is to focus on the reduction in high energy-dense, low nutrient-dense foods (1). An alternative or complementary approach may be to target an increase in healthy eating while energy intake is reduced. Increasing intake of low energy-dense foods may increase fullness with less energy (2). Leaner adults consume a greater proportion of their diet as low energy-dense foods (3,4), they consume fewer calories of a lower energy-dense than a higher energy-dense food (4,5). Thus, increasing consumption of low energy-dense foods such as fruits and vegetables may reduce energy intake and body weight (2).
In addition to the potential influence of lower energy-dense foods on satiety and fullness, we have shown in the laboratory that children may learn to substitute lower energy-dense healthy foods for less healthy higher energy-dense foods (6). For example, children may shift their choice from candy or pastries to fruit if there is a reduction in access to candy and easier access to fruit in their homes. The substitution may be facilitated as parents increase access to healthy foods and decrease access to less healthy foods that occur as families change food purchasing and food storage.
Low-fat dairy products provide another healthy type of food for children, with a wide range of health benefits reported from increasing dairy and calcium intake in children (7). Dairy intake has been associated with a lower body fat in young children (8,9), and a reduction in development of insulin resistance in young adults (10). Research supports the hypothesis that increases in dairy may be useful to reduce body weight in obese adults (11), though there are studies showing no influence of increasing dairy consumption on body weight (12,13).
Along with the changes in eating behaviors, there may also be changes in parenting behaviors that facilitate the differentiation of reducing unhealthy behaviors vs. increasing healthy behaviors. The shift in emphasis from reducing consumption of high energy-dense foods to increasing consumption of healthier foods may involve a difference in parental attitudes toward feeding, and perhaps parenting in general. When behavior change targets reducing high energy-dense foods parental attitude focuses on what the child can not eat, while when focusing on healthy eating the emphasis is on what the child can eat. This shift may result in differences in parenting behaviors from an emphasis on reducing negative behaviors to increasing positive behaviors (14). The change in emphasis may reduce parental food restriction, which could influence child food choice (15).
It is common in health promotion to emphasize healthier eating such as increasing fruits and vegetables and low-fat dairy, and children who are trying to lose weight may receive information to reduce intake of some types of foods while increasing intake of other types of foods. It is important to evaluate the independent effects of these two different approaches to child weight loss. This study provided an experimental comparison of interventions that target increasing fruits and vegetables and low-fat dairy products vs. reducing intake of high energy-dense foods within the context of a family-based behavioral weight control program on zBMI, eating, activity and parenting changes for treatment of at-risk for overweight and overweight (>85th BMI percentile) children.
METHODS AND PROCEDURES
Participants and design
Participants were recruited through newspaper advertisements, posters, flyers, television interviews, direct mailings, and personal and physician referrals. Entrance criteria included children between 8 and 12 years of age, over the 85th BMI percentile, not taking any weight-altering drugs, reading at or above a third grade level, one parent willing to attend treatment meetings, no family member participating in an alternative weight control program, and no children or parents having current dietary or exercise restrictions or psychiatric problems. Screening was conducted on 105 families, with 41 families randomized into one of two treatment groups: reducing high-fat, high-sugar foods group, or increasing healthy (fruit, vegetable, and low-fat dairy) foods group. Eighteen families who met criteria declined to participate (Figure 1). Families were studied in two cohorts, with all families participating in each cohort screened before randomization, and randomization of all families who met criteria for each cohort was implemented using a random number algorithm stratifying by gender. Families were not entered on the basis of their eating habits. This research was approved by the Health Sciences Institutional Review Board at the New York State University at Buffalo.
Figure 1.

Flow chart for families randomized to the two groups.
Procedures
Families were screened over the phone and invited to an orientation meeting. Interested families signed informed consent and assent forms and attended two screening meetings to complete introductory questionnaires and an interview. Accepted families attended weekly meetings for 2 months, biweekly meetings for 2 months, and one monthly meeting, followed by assessment meetings at 6-month, 1-year and 2-year time points. Family members were weighed before each meeting. Treatment meetings included group and individual sessions for parents and children totaling approximately one and a half hours. In a usual meeting families were weighed, were seen as a family by their case manager, and then went to separate parent and child group meetings. Manuals containing chapters, questions, and quizzes were given to parents and children with age appropriate information on nutrition, physical activity, and behavior modification of eating and activity.
Treatment
Diet
The Traffic Light Diet was used to decrease energy intake and promote a healthy diet for overweight children and their parents. Traffic Light Diet foods are categorized as GREEN, YELLOW, and RED, based upon their amount of fat and sugar per serving. Serving sizes used in the Traffic Light Diet are derived from the serving sizes used in the food guide pyramid. GREEN foods are high in nutrient density and low in energy density, (fat = 0−1 g or sugar <10% calories/serving). Most GREEN foods come from the fruit and vegetable groups. YELLOW foods are higher in energy density than GREEN foods, (fat = 2−5 g or sugar 10−25% calories/serving). RED foods are higher in energy density than YELLOW or GREEN foods (fat > 5 g or sugar > 25% calories/serving). Many RED foods come from the fats, oils, and sweets groups and are to be used sparingly. Modified foods from the fats, oils, and sweets groups are still considered to be RED foods, even if their fat and/or energy level is low. These foods contribute few nutrients to the diet and compete for consumption of healthier foods. Combination foods (e.g., sandwiches, pizza, hamburger, lasagna, etc.) are considered to be RED foods if a serving of the combination food contains at least a serving of a RED food, e.g., a turkey sandwich is a RED food if it contains at least one serving of mayonnaise. Overweight participants were instructed to consume between 1,000 and 1,500 calories per day. All participants were educated to maintain nutrient balance by eating the recommended number of servings based on the food guide pyramid (16). Families were provided education on reading food labels and healthy shopping.
Activity
Both groups received information about physical activity and the positive effects of exercising. The goal was at least 60 minutes per day of moderate to vigorous intensity physical activity for 6 days a week, shaped in 15-minute increments beginning at 15 minutes of moderate to vigorous intensity physical activity per day.
Groups
Both groups were given the Traffic Light Diet to reduce their daily energy intake, and a similar activity program. Each group received reinforcement for meeting their dietary goals through a point system. These points were calculated based on the participant's recording in a daily food journal. Each child and parent had to meet their specific weight loss goal to earn points. Overweight child and parent goals were a half pound and a pound weight loss per week, respectively. The goal for normal weight parents was to maintain their weight within a 5 lb increase or decrease.
The increase healthy food group focused on replacing high energy-dense foods with fruits, vegetables and low-fat dairy. The initial fruit and vegetable goal was to increase fruit and vegetable intake by at least one serving per day above their normal consumption. After 2 weeks of meeting their goal participants increased their servings of fruits and vegetables by one until they were eating at least five servings per day. The dairy goal was at least two servings of low-fat dairy per day. Children also had an activity goal, which began at least 15 minutes per day of moderate to vigorous physical activity, which was increased in 15-minute increments up to 60 minutes of moderate-to-vigorous physical activity per day. If children met their weight loss goal, they could earn 1 point per day for meeting fruits and vegetables, low-fat dairy and activity goals, with a total of 21 points per week, 7 points for fruits/vegetable goal, 7 for dairy goal and 7 for activity goal. As children had a weight loss target, it was not thought to be necessary to also reinforce them for meeting a calorie goal, as they could not lose weight unless they were in negative energy balance in part by reducing their calories.
Both children and their parents recorded their eating in a habit book, in which they reported the food, serving size and calories and their daily activities and minutes of activity in a separate page of their habit books. The habit book for the increase healthy food group had outline drawings of examples of fruits and vegetables or low-fat dairy that they checked off as they consumed them to keep track of meeting their goal. Children and their parents weighed themselves at home and charted their progress on a weight graph.
Stimulus control for food recommendations for the healthy food group were to arrange a food environment to make it easier to increase their fruits, vegetables, and low-fat dairy food consumption. This included making changes in foods available in the home environment, making fruits and vegetables visible and easily accessible, serving healthier foods, buying healthier foods and reducing purchases of less healthy foods, changes in food preparation and eating out behaviors. Parents were encouraged to model healthy behaviors for their children, and in addition to the point system, family members were encouraged to praise each other for practicing healthy behaviors. Preplanning and problem solving were taught to facilitate decision-making and handling of difficult eating and activity situations.
The reduce high energy-dense food group focused on meeting their calorie goal of 1,000−1,500 calories/day and decreasing intake of high-fat, high sugar foods (RED) by at least two a day below their usual consumption. After meeting their RED food goal for 2 consecutive weeks participants decreased their RED food goal by two, with the final goal no more than two RED foods per day. Children also had an activity goal similar to the increase healthy food group. If they met their weight loss goal they could earn 1 point per day for meeting the RED food goal, calorie and activity goals, with a total of 21 points per week, 7 points for RED foods, 7 for calories and 7 for activity.
Participants in this group also recorded their eating and activity in a habit book, and kept track of their weight. The habit book for children in this group had outline drawings of examples of high energy-dense foods (ice cream cones) that they checked off as they consumed them to keep track of meeting their goal. Stimulus control recommendations were designed to reduce consumption of RED foods by limiting them in their home environment, reducing purchasing of RED foods, and alter food preparation and eating out. Family members were also encouraged to praise each other for practicing healthy behaviors, to model healthy behaviors and to use preplanning and problem solving to handle difficult eating and activity situations.
Measurement
Anthropometric measures
Height was measured in centimeters, the height was rounded down to the nearest millimeter using a laboratory constructed stadiometer and weight was measured to the nearest ¼ lb using a calibrated Healthometer balance-beam scale. BMI (kg/m2), zBMI values standardized for child age and gender based on population norms (17) and percent overweight (measured BMI − BMI at 50th BMI percentile)/BMI at the 50th BMI percentile for that child's age and gender). BMI values at the 50th percentile and standard deviations for the BMI values were based on population norms (17). Height and weight and all dependent measures were collected at baseline, 6, 12, and 24 months.
Dietary Measures
Servings per day of fruits and vegetables, high energy-dense (RED) foods and low-fat dairy were derived from the food intake questionnaire, which assessed intake in usual serving sizes of 76 food items, including 33 fruits and vegetables, 32 high energy-dense foods, and 7 types of dairy products. The questionnaire was validated for fruit and vegetable and high energy-dense foods using multiple-pass 24-h recalls (18). In addition to previous validation of the questionnaire (18), in this study the questionnaire was compared to intake collected by daily habit books at baseline. Habit books were given to participants weekly to record the time food was consumed, the type of food consumed and the total calories consumed. The reliability of coding servings of RED foods, fruits, vegetables, and low-fat dairy servings were determined by having two independent observers blind to experimental condition code diet records for each day, and the reliability between observers was compared using percent agreement. Percent agreement was acceptable for servings of RED foods (88.1%), fruits (93.3%), vegetables (88.4%), and low-fat dairy (89.3%). Servings of low-fat dairy (r = 0.56, P < 0.01), fruits and vegetables (r = 0.34 , P < 0.05) and high energy-dense RED foods (r = 0.31, P = 0.05) were correlated with questionnaire derived measures.
Activity measures
Active behaviors were assessed by self report cards for 3 days (two weekdays and one weekend day) at baseline and 6 months. Participants recorded behaviors in minute increments on 4 × 6 index cards with columns for the start and stop time and the description of the activity. Activity records were reviewed with trained interviewers for accuracy and completeness, and details added if needed. Coding of the activities was based on the metabolic equivalents from the compendium of physical activity (19). Data were scored in terms of minutes of activity above two metabolic equivalents, to give an idea of general activity, as well as activity above three metabolic equivalents, to provide an index of time in moderate-to-vigorous intensity physical activity. Research has previously shown that children can reliably self-report their physical activity (20), and we have shown significant correlations between self-reported activity dairies and heart-rate (r = 0.36) and accelerometer (r = 0.38) values (21).
Demographics
The Hollingshead Four-Factor Index of Social Status was used to assess the families’ socioeconomic status, ethnicity, and race at baseline (22).
Child feeding questionnaire
The child feeding questionnaire assessed parental feeding practices including perceived responsibility, concern about child weight, dietary restriction, pressure to eat, monitoring of eating at baseline after 6 months. This questionnaire is a valid and reliable measure of parent feeding practices (23).
Child Report of Parental Behavior Inventory
Child and parent versions of the Child Report of Parental Behavior Inventory assessed child-rearing behaviors (24) at baseline, 6, 12, and 24 months. The 56-item questionnaire assessed three factors of parenting: acceptance vs. rejection, psychological control vs. autonomous control, and firm vs. lax control. Responses were given on a three-point scale, indicating whether an item is like, somewhat like, or not like the parent. The Child Report of Parental Behavior Inventory has extensive reliability and validity data (24–26).
Statistical Analysis
T-tests and chi-square were used to detect between-group differences at baseline. Group differences in zBMI, eating and activity behaviors, child feeding, and parenting were assessed using mixed effects regression (MRM) models. These take advantage of using all data that are available, take into account dependencies among the serial measures, and the changing variability over time. The models included a random intercept, months as a time variant level 1 predictor, and group and child age, gender, socioeconomic status, and baseline values as time invariant level 2 predictors for all but the zBMI model, where just socioeconomic status was a level 2 predictor, as zBMI values are standardized for child age and gender. Linear and quadratic months effects were included. Significant group by time interactions were tested by additional MRM models to compare between group differences from baseline to 6, 12, and 24 months. Data for all 41 randomized subjects were used in the MRM models.
Moderators, mediators and non-specific predictors were tested using the analytic plan suggested by Kraemer and colleagues (27,28). Moderators are baseline variables that interact with treatment to predict outcome. In these models, zBMI was the dependent variable, and the test of the moderator was a three-way interaction with the moderator × group × months, with baseline levels of that variable as a covariate. Significant moderator effects were probed in additional MRM models by dichotomizing continous variables by the median value of the moderator variable, and comparing group × time interactions for low or high levels of the moderator variable. Mediators are variables that differentially change over time (two-way interaction of group × months), and which predict change over time. Thus, only variables that differ between groups over time can be tested as mediators. Analysis of mediators studied time variant variables that interacted with group × time, with baseline levels of the variable as covariates. Finally, non-specific predictors are baseline or change variables that predict zBMI change over time, but do not interact with treatment. Analyses were completed using SYSTAT (29) and SAS (30).
To our knowledge there are no child weight control data that target increases in fruit and vegetable and low-fat dairy intake vs. reducing high energy-dense RED foods. The sample size was based on research from our laboratory with adults that compared an increase in fruit and vegetable intake vs. reducing high energy-dense foods (18). This study had an effect size (ESD) of 1.02, which can be shown with power of 0.8 and alpha of 0.05 using a sample size of 34 (17/group).
RESULTS
Baseline characteristics of children and parents are presented in Tables 1 and 2, respectively. No group differences were observed in any of the child or parent characteristics, with the exception of child perceptions of maternal acceptance and paternal autonomous control, which were higher in the decrease high energy-dense food group. Six (15%) were minority families.
Table 1.
Baseline characteristics (mean ± s.d.) of children in obesity treatments groups
|
Groups |
|||
|---|---|---|---|
| Characteristics | Increase healthy food | Decrease high energy density | P |
| Age (years) | 10.7 ± 1.3 | 10.3 ± 1.1 | 0.26 |
| Gender (F/M) | 9/12 | 9/11 | 0.89 |
| Height (inch) | 59.5 ± 4.5 | 58.2 ± 2.7 | 0.26 |
| Weight (lb) | 153.2 ± 38.2 | 146.0 ± 27.7 | 0.50 |
| Percent overweight | 74.3 ± 21.0 | 77.7 ± 22.1 | 0.62 |
| zBMI | 2.3 ± 0.3 | 2.3 ± 0.2 | 0.50 |
| Fruit/vegetable intake servings/day | 3.4 ± 2.0 | 3.2 ± 1.4 | 0.80 |
| RED food servings/day | 6.5 ± 2.3 | 6.2 ± 1.9 | 0.64 |
| Low-fat dairy intake/day | 0.5 ± 0.5 | 0.6 ± 0.4 | 0.70 |
| Minutes of general physical activity (>2 METs)/3 days | 571.9 ± 277.7 | 616.0 ± 339.5 | 0.65 |
| Minutes of MVPA (>3 METs)/3 days | 173.3 ± 176.1 | 247.2 ± 281.6 | 0.32 |
METs, metabolic equivalents; MVPA, moderate to vigorous intensity physical activity; RED, high energy dense.
Table 2.
Baseline characteristics of parents in obesity treatments groups
|
Groups |
|||
|---|---|---|---|
| Characteristics | Increase healthy food | Decrease high energy density | P |
| Age (years) | 42.9 ± 7.1 | 41.9 ± 4.8 | 0.58 |
| Gender (F/M) | 16/5 | 16/4 | 0.77 |
| Height (inch) | 65.1 ± 2.8 | 65.7 ± 3.5 | 0.53 |
| Weight (lb) | 194.0 ± 45.6 | 204.0 ± 59.1 | 0.51 |
| Percent overweight | 46.0 ± 33.0 | 50.4 ± 33.7 | 0.68 |
| zBMI | 1.5 ± 0.6 | 1.6 ± 0.8 | 0.67 |
| Fruit/vegetable intake servings/day | 3.9 ± 2.2 | 4.1 ± 1.8 | 0.80 |
| RED food intake | 5.7 ± 1.9 | 5.0 ± 3.0 | 0.34 |
| Low-fat dairy intake | 0.4 ± 0.4 | 0.5 ± 0.4 | 0.68 |
| Minutes of physical activity >2 METs/3 days | 1249.1 ± 381.1 | 1485.2 ± 531.8 | 0.11 |
| Minutes of MVPA (>3 METs)/3 days | 201.3 ± 223.9 | 239.3 ± 359.7 | 0.69 |
| Socioeconomic status | 48.2 ± 8.7 | 47.0 ± 11.4 | 0.69 |
| CFQ | |||
| Parental restriction | 3.7 ± 0.5 | 3.7 ± 0.5 | 0.75 |
| Concern over child weight | 4.4 ± 0.5 | 4.3 ± 0.8 | 0.59 |
| Monitoring | 3.7 ± 0.6 | 3.6 ± 0.9 | 0.46 |
| Pressure to eat | 1.7 ± 0.8 | 1.9 ± 0.8 | 0.44 |
| Responsibility | 4.2 ± 0.6 | 4.0 ± 0.9 | 0.47 |
| Concern over parent weight | 3.5 ± 0.4 | 3.5 ± 0.5 | 0.68 |
| CRPBI | |||
| CRPBI maternal acceptance | 59.8 ± 8.2 | 66.3 ± 2.8 | 0.006 |
| CRPBI maternal autonomous control | 26.6 ± 6.6 | 28.6 ± 5.0 | 0.35 |
| CRPBI maternal lax control | 24.1 ± 6.3 | 25.2 ± 4.8 | 0.58 |
| CRPBI paternal acceptance | 58.9 ± 10.3 | 64.9 ± 6.2 | 0.06 |
| CRPBI paternal autonomous control | 24.3 ± 6.0 | 28.6 ± 5.7 | 0.05 |
| CRPBI paternal lax control | 23.9 ± 7.9 | 27.7 ± 6.3 | 0.15 |
CFQ, Child feeding questionnaire; CRPBI, Child Report of Parental Behavior Inventory; METs, metabolic equivalents; MVPA, moderate to vigorous intensity physical activity; RED, high energy dense.
The MRM to predict changes in zBMI showed a linear interaction of group by months (P < 0.01), as the increase healthy food group showed greater reductions over time in comparison to the reduce high energy-dense food group (Figure 2). Analyses showed significant between group differences on changes from baseline to 12 (P = 0.01) and 24 (P = 0.04) months. Significant reductions in zBMI were also observed over time (P < 0.001), with overall reductions at 6 (coefficient = −3.33, P < 0.001) and 12 (coefficient = −2.22, P = 0.037) months. MRM analyses were also completed on percent overweight, and there was a significant linear interaction of group by months (P = 0.013), as subjects in the increase healthy food group showing a reduction in percent overweight of −17.5 ± 7.33, mean ± s.d.) −16.9 ± 10.9 and −16.4 ± 21.6 at 6, 12, and 24 months, respectively, while those in the reduce high energy-dense food group showed reductions of −15.6 ± 13.1, −8.4 ± 14.9, and −2.0 ± 18.2 at 6, 12, and 24 months. A significant overall reduction in percent overweight was observed over time (P < 0.002), with overall reductions at 6 (coefficient = −3.34, P < 0.001), 12 (coefficient = −2.22, P < 0.001), and 24 (coefficient = −1.20, P = 0.01) months. Values for primary dependent variables by group are shown in Table 3.
Figure 2.
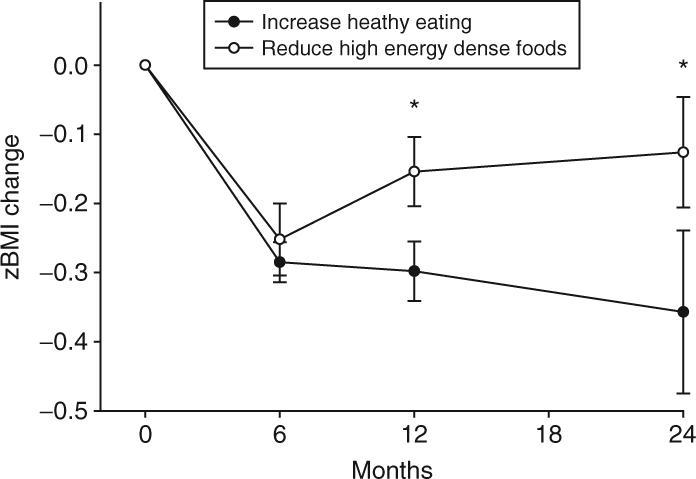
zBMI changes from baseline (mean ± s.e.m.) between the increase healthy food and reduce high energy-dense food groups. Mixed effects regression models showed an interaction of group by months (P = 0.03). Significant (*) between group differences were observed at 12 months (P = 0.01) and 24 months (P = 0.04).
Table 3.
Changes in zBMI, eating and activity and parenting variables over time
| Variable | Increase healthy food | Decrease high energy density | ||||
|---|---|---|---|---|---|---|
| Months | 0−6 | 0−12 | 0−24 | 0−6 | 0−12 | 0−24 |
| zBMI | −0.25 ± 0.09 | −0.26 ± 0.15 | −0.27 ± 0.41 | −0.31 ± 0.05 | −0.21 ± 0.17 | −0.11 ± 0.21 |
| Percent overweight | −18.6 ± 6.9 | −0.18.4 ± 9.3 | −14.2 ± 18.6 | −21.0 ± 12.6 | −13.5 ± 14.1 | −3.0 ± 16.7 |
| Fruit/vegetable servings/d | 0.3 ± 2.2 | −0.7 ± 2.3 | −1.14 ± 2.4 | 0.0 ± 1.5 | 0.2 ± 1.8 | −0.6 ± 1.6 |
| RED food intake | −2.3 ± 2.8 | −2.3 ± 2.6 | −0.9 ± 2.6 | −3.6 ± 1.6 | −2.8 ± 1.5 | −3.1 ± 0.7 |
| Low-fat dairy intake | 0.3 ± 0.6 | 0.4 ± 0.8 | 0.2 ± 0.5 | 0.4 ± 0.8 | 0.2 ± 0.9 | 0.2 ± 0.7 |
| Minutes >2 METs/3 days | 324.0 ± 369.8 | −0.1 ± 121.3 | 341.9 ± 447.4 | 513.0 ± 335.3 | 122.4 ± 245.9 | 20.6 ± 200.5 |
| Minutes ±3 METs)/3 days | 235.4 ± 245.9 | −1.4 ± 70.5 | 87.9 ± 193.5 | 192.0 ± 243.3 | 32.4 ± 150.5 | −18.1 ± 99.5 |
| CFQ | ||||||
| Restriction | −0.2 ± 0.6 | −0.2 ± 0.5 | −0.4 ± 0.6 | −0.6 ± 0.7 | −0.6 ± 0.8 | −0.4 ± 0.4 |
| Concern over child weight | −0.9 ± 1.0 | −0.9 ± 0.8 | −1.0 ± 1.17 | −0.9 ± 0.9 | −0.1 ± 0.5 | −0.2 ± 0.7 |
| Monitoring | 0.4 ± 0.6 | −0.2 ± 0.4 | −0.7 ± 0.8 | 0.3 ± 0.7 | −0.4 ± 1.3.4 | −0.7 ± 0.8 |
| Pressure to eat | −0.6 ± 1.1 | −0.7 ± 1.1 | −0.3 ± 1.4 | −0.56 ± 0.7 | −0.3 ± 0.5 | −0.3 ± 0.5 |
| Responsibility | −0.7 ± 0.6 | −0.6 ± 0.4 | −0.9 ± 0.6 | −0.7 ± 0.8 | −0.9 ± 0.6 | −0.6 ± 0.4 |
| Concern over parent weight | −0.1 ± 0.2 | 0.0 ± 0.2 | −0.2 ± 0.1 | −0.1 ± 0.2 | −0.1 ± 0.3 | 0.0 ± 0.3 |
| CRPBI | ||||||
| Maternal acceptance | −0.8 ± 5.5 | −1.1 ± 6.4 | 1.4 ± 5.6 | 0.2 ± 3.6 | −0.2 ± 5.0 | 2.0 ± 1.6 |
| Maternal autonomous control | −4.4 ± 4.6 | −1.7 ± 10.2 | −5.4 ± 3.9 | −2.9 ± 6.4 | −2.0 ± 8.6 | −2.6 ± 4.4 |
| Maternal lax control | 0.1 ± 3.2 | −2.3 ± 3.4 | −3.4 ± 1.7 | −0.3 ± 4.3 | −2.5 ± 4.4 | −3.4 ± 3.8 |
| Paternal acceptance | 0.6 ± 9.9 | 1.5 ± 5.9 | 1.8 ± 3.6 | 0.0 ± 3.8 | −1.0 ± 2.8 | −3.4 ± 5.6 |
| Paternal autonomous control | −3.3 ± 3.7 | −1.2 ± 6.2 | 0.0 ± 4.0 | −2.4 ± 7.2 | −2.2 ± 4.1 | −4.3 ± 6.0 |
| Paternal lax control | 2.9 ± 5.7 | 1.8 ± 6.8 | 1.0 ± 5.7 | −7.1 ± 6.4 | −5.7 ± 4.2 | −0.2 ± 0.2 |
CFQ, Child feeding questionnaire; CRPBI, Child Report of Parental Behavior Inventory; METs, metabolic equivalents; RED, high energy dense.
RED foods showed a significant quadratic change over time by groups (P < 0.05), as shown in the Figure 3a, with both groups showing a reduction up to 1 year, with the reduce high energy-dense food group showing better long-term maintenance of change than the increase healthy food group. Between-group differences were observed only at 24 months (P = 0.03). Changes over time were also observed for RED foods, with significant decreases from baseline to 6 (coefficient = −0.45, P < 0.001), 12 (coefficient = −0.20, P < 0.001) and 24 (coefficient = −0.09, P < 0.001) months. No significant changes in low-fat dairy were observed.
Figure 3.
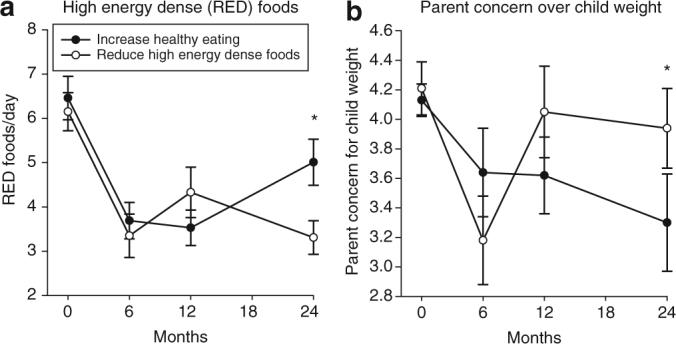
Between group differences (mean ± s.e.m.) in (a) high energy-dense (RED) foods and (b) parent concern over child weight. Mixed effects regression models showed significant differences by group in RED foods (P < 0.05), with significant differences (*) being observed at 24 months (P = 0.03). Mixed effects regression models showed significant differences by group in parent concern over child weight (P = 0.008), with significant (*) differences being observed at 24 months (P = 0.03).
A significant linear interaction of group by time was observed for parent concern for child weight (P = 0.007), with greater sustained reductions in parent concern for parents in the increase healthy food group (Figure 3b). Significant between group differences in parent concern for child weight were observed at 24 months (P = 0.03). Significant overall reductions in parent concern across both groups were observed (coefficient = −0.08, P = 0.001), with significant reductions from baseline to 6 (coefficient = −0.14, P < 0.001), 12 (coefficient = −0.03, P = 0.004) and 24 (coefficient = −0.02, P = 0.002). In mediational analyses, parent concern for child weight interacted with group to predict zBMI change over time (P = 0.008). In addition, there were significant reductions over time in parent concern for child weight (coefficient = −0.08, P < 0.001), perceived responsibility for child weight (coefficient = −0.05, P = 0.004); parent restraint over child eating (coefficient = −0.05, P = 0.001) and monitoring of child behavior (coefficient = −0.05, P = 0.03).
A number of baseline child variables moderated the effects of treatment on zBMI. Baseline levels of zBMI (P = 0.017), gender (P = 0.014), and age P = 0.006) interacted with treatment to influence success. As shown in Figure 4, children with lower baseline zBMI values (Figure 4a), older children (Figure 4d) and girls (Figure 4f) assigned to the increase healthy food group showed greater sustained reductions in zBMI over the 2 years than children assigned to the reduce high energy-dense food group. Baseline values of several behavioral variables also moderated treatment effects, including the number of RED foods consumed per day (P < 0.05), parental reports of restraint over child eating (P = 0.01), parent concern over parent weight (P = 0.01), and parental acceptance of the child (P < 0.05). Figure 5 illustrates that the experimental treatment to increase healthy foods improved zBMI changes for children who consumed higher levels of RED foods at baseline. As shown in Figure 6, children assigned to the increase healthy food group showed greater zBMI change over time when parents reported high parental restraint (Figure 6b), parents had high concern over parent weight (Figure 6d), and when parents had high acceptance of their children (Figure 6f). Thus, in each case the increase healthy food group interacted with the high levels of the moderator to improve outcome.
Figure 4.
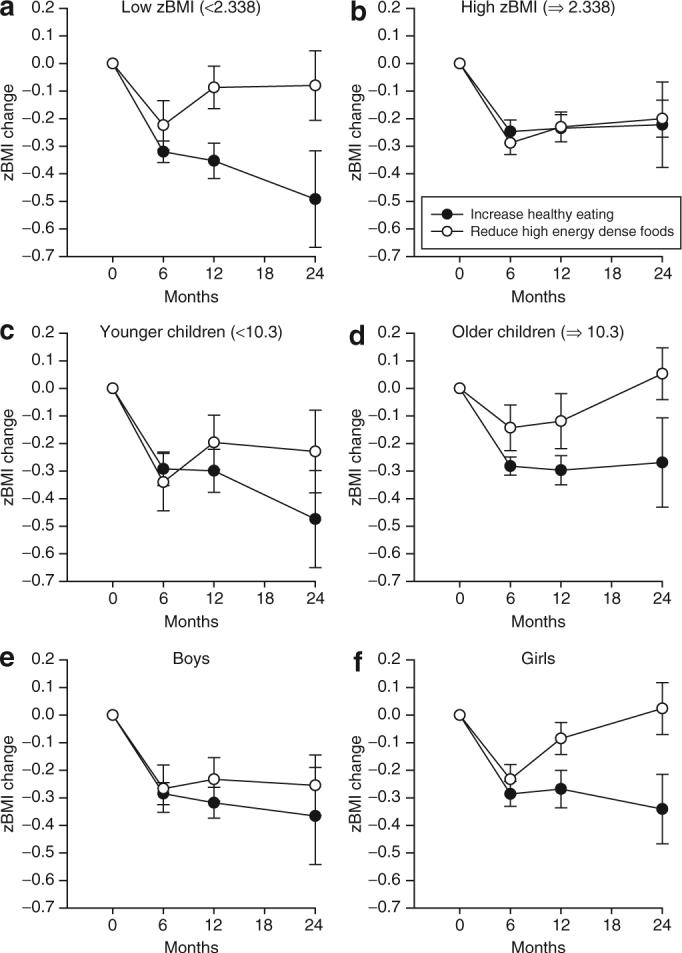
Moderating effects of (a, b) baseline zBMI, (c, d) child age, and (e, f) child gender on zBMI changes by treatment group. Mixed effects regression models showed that baseline levels of zBMI (P = 0.017), age (P = 0.006)m and gender (P = 0.014) interacted with treatment to influence outcome. In each interaction, children randomized to the increase healthy food group showed better long-term change than children randomized to the reduce high energy-dense food group.
Figure 5.
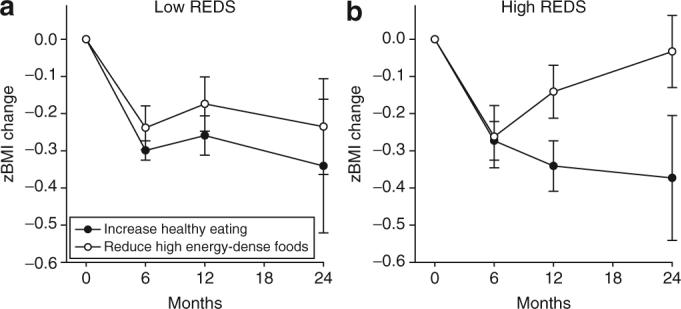
Moderating effects of high energy-dense (RED) foods on zBMI changes by treatment group. Mixed effects regression models showed that baseline levels of RED foods (P < 0.05) interacted with treatment to influence outcome. The effects of the treatments were greater for children who had higher levels of baseline consumption for RED foods.
Figure 6.
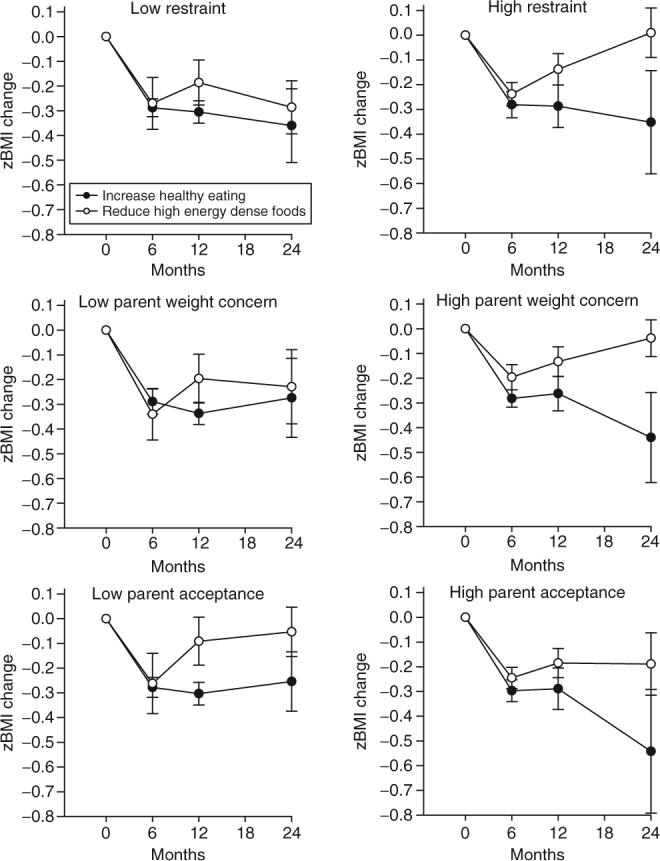
Moderating effects of (a, b) parent restriction of food, (c, d) concern over parent weight, and (e, f) child reported parental acceptance on zBMI changes by treatment group. Mixed effects regression models showed that baseline levels of restriction (P = 0.011), concern over parent weight (P = 0.009), and child reported parent acceptance (P = 0.045) interacted with treatment to influence outcome. In each interaction, children randomized to the increase healthy food group showed better long-term change than children randomized to the reduce high energy-dense food group for children with high levels of the moderating variable.
A number of non-specific time variant predictors of zBMI over the 2 years of observation were observed, with positive relationships observed for RED foods, which means that lower amounts of RED foods are associated with lower zBMI values (coefficient = 0.03, P < 0.001), and negative relationships observed for low-fat dairy (coefficient = −0.07, P = 0.03) and physical activity greater than two metabolic equivalents (coefficient = −0.0001, P = 0.02), as greater intake of low-fat dairy and greater activity levels were associated with lower zBMI. Parenting variables of parent concern for child weight (coefficient = 0.16, P < 0.001), parental restraint over child eating (coefficient = 0.09, P = 0.02) and parental monitoring (coefficient = −0.06, P = −0.02) were related to child zBMI. When both parenting variables and eating and activity variables were included in the same MRM model, reductions in parent concern for child weight (P < 0.001), restriction (P = 0.005) and monitoring (P = 0.018) remained as significant predictors. Low-fat dairy intake was inversely related to RED foods throughout the 2 years of observation (coefficient = −0.80, P = 0.015).
Parent zBMI change showed the same linear pattern as for their children, with parents in the increase healthy food group showing significant linear reductions in zBMI over months (coefficient = −0.005, P < 0.05), while the reduce high energy-dense food group showed no significant change over months (coefficient = 0.001, P = 0.63). Significant between group differences in zBMI were observed at 24 months (P = 0.017). These changes are due to a decrease in zBMI values of −0.30 ± 0.20, −0.21 ± 0.25, and −0.16 ± 0.23 zBMI units at 6, 12, and 24 months, respectively, for parents in the increase healthy food group, and a decrease in zBMI values of −0.24 ± 0.25, −0.13 ± 0.23, and +0.02 ± 0.19 zBMI units for parents in the reduce high energy-dense food group. MRM models showed that parent zBMI values over 2 years were correlated with child zBMI values (coefficient = 0.23, P < 0.001).
DISCUSSION
This study showed that in the context of a comprehensive family-based behavioral weight control program that provided for reduction in energy intake, increase in energy expenditure and changes in parenting behaviors, targeting an increase in fruit and vegetable intake and low-fat dairy products was associated with a significantly greater reduction in zBMI and percent overweight over 2 years for children and their parents than focusing on reducing high energy-dense foods. These results support those from a previous prevention study showing that targeting an increase in fruits and vegetables improved weight loss in parents of youth at risk for developing obesity (18). Perhaps most interestingly, the increase healthy food group was associated with no relapse in weight regain from the 6 months of intensive treatment through the 2 year follow-up.
One way in which the increase fruit and vegetable and low-fat dairy vs. reduce high energy-dense food groups may influence child behavior change is through parenting. Parental concern for child weight showed greater reductions for parents who were assigned to the increase healthy food group. These between group differences were significantly related to changes in zBMI, which meet the criteria for mediation of zBMI change (28). This association may be due to a shift in responsibility over child eating and exercise and their weight from the parent to the child, as the treatments focus on the child taking increased responsibility for their behavior. This is consistent with the observation that a reduction in parental restraint over child eating is related to improved child weight loss. This shift may be more pronounced for families in the increase healthy food group than for families in the reduce high energy-dense food group, perhaps due to the shift in parenting attending to positive examples of eating rather than negative examples of eating. It is also possible that the significant reduction in parental concern over child weight, and the relationship between the degree of change in parental concern over child weight and changes in child zBMI values are due to child weight being decreased more in the increase fruit and vegetable and low-fat dairy group, and parents responding to this reduction in zBMI with a reduced parental concern. Significant reductions in parental restriction over child eating were observed, and both reductions in parental concern over child weight and parental restriction over child eating were associated with zBMI change, and both of these variables were stronger predictors than any of the child eating behaviors. These results suggest that the family-based treatment, in general, is associated with a reduction in parental restriction over child eating, and focusing on healthy eating had the additional benefit of greater weight loss and greater reductions in concern over child weight. In addition, baseline levels of parent feeding behaviors and parenting moderated the effects of targeting healthy eating, including high concern over child weight, high parental restraint over eating, and high parental acceptance. The reductions in monitoring of child feeding and dietary restriction are positive changes, which may be indicative of parents less involved in directly controlling their child's eating behavior. Birch and colleagues have shown that food restriction can lead to eating in the absence of hunger and may be associated with increased body weight (15,31,32).
Between-group changes in high energy-dense foods were observed over time, with the reduce high energy-dense food group showing larger sustained changes. In addition, reductions in high energy-dense foods and an increase in low-fat dairy products were associated with zBMI values over 2 years, and children with higher consumption of high energy-dense foods benefited more from the treatments that target healthy eating. Unfortunately, none of these results provide information that help understand what behavioral changes were observed that may mediate the influence of targeting increasing fruits and vegetables and low-fat dairy on zBMI change. The expected changes in fruits and vegetables and low-fat dairy were not observed, and while increases in low-fat dairy was associated with lower zBMI values, this effect was not specific to the increase healthy food group.
Thus, the process measures provide a reasonable idea of what parenting changes may have been related to zBMI changes, but there is less confidence in understanding what changes in behaviors related to energy balance mediated weight change. There are at least three potential explanations for this failure. First, the changes are not mediated by eating, but rather by activity. Although changes in general activity level were related to zBMI over the 2 years of observation, there were no significant between-group differences in either general activity or moderate to vigorous intensity physical activity behaviors, which argue against activity changes mediating the between group differences. Second, the zBMI changes may be related to interactions or synergisms between foods or between food and activity levels. For example, it may require small, non-significant changes in high energy-dense foods in combination with increases in fruits and vegetables, or small, non-significant changes in healthy eating in combination with increases in general activity level. The analytic approaches that we have used focus on unitary changes in specific eating or activity behaviors, rather than interactions between the measures, and smaller, synergistic changes are more difficult to detect. Third, the questionnaire measures that were used to assess eating may not have been sensitive enough to detect changes in fruits and vegetables or low-fat dairy intake. It is well known that measurement of intake in obese children is challenging (33), and questionnaires may not be sensitive to individual level changes in eating, which makes them less useful for any correlational analyses (34), which are needed to establish mediation of zBMI change. Questionnaires were used to reduce subject burden in collection of dietary data, but there are important limitations to questionnaire measures of dietary intake that may make them less than ideal for this study (34).
The difficulty in determining what aspect of behavior change was responsible for weight loss should not take away from the overall finding that focusing on increasing healthy eating within the context of an energy restricted diet is associated with superior long-term effects in comparison to a diet that only focuses on reducing high energy-dense foods. The study was designed to compare programs that targeted distinctly different types of foods, but programs could target both increasing intake of healthy foods while reducing intake of high energy-dense foods. Future research should compare programs that combine both approaches vs. just focusing on increasing healthy eating or reducing intake of less heathy foods.
The dietary strategy of targeting an increase in fruits and vegetables and low-fat dairy within the context of a reduced energy intake is only one approach to treat pediatric obesity. For example, Ludwig and colleagues have used a low-glycemic diet to treat pediatric obesity (35,36), which also focuses on what foods the children can eat, and does not require energy restriction, as Ludwig argues that children will spontaneously reduce their energy intake when consuming low-glycemic index foods (37). In addition, Golan and colleagues use a more general health promotion strategy to treat pediatric obesity, focusing the treatment on the parents, teaching the parents strategies to improve eating and activity behaviors, also without energy restriction (38). The approach developed by Golan is associated with percent overweight changes that are similar to those achieved in the current study.
Relationship between fruit and vegetable intake and energy intake in correlational (39,40) and experimental studies (3,5) have been observed in adults. Experimental relationship showing fruits and vegetables can substitute for higher energy-dense, lower nutrient foods (6). Additional research is needed to test more powerful methods for increasing fruit and vegetable intake in children, and under what conditions increasing fruit and vegetable intake can reduce body weight, using more sensitive measures of fruits and vegetables intake.
The focus of this study was on modifying dietary change, and while children were provided information on activity change, activity changes were not targeted, to isolate the influence of dietary change on percent overweight as much as possible. Perhaps not surprisingly, there were no significant changes in activity over time. A comprehensive program would include targeting both eating and activity changes, and there may be some synergy between targeting increased activity as another healthy behavior that could enhance changes in healthy eating that were observed.
In summary, we have shown that increasing healthy eating may be an important target in pediatric weight control programs, and these changes may enhance weight loss. However, additional research is needed to understand the mechanisms for these changes. A primary goal should be to use more sensitive measures of dietary change to track changes in healthy eating vs. reductions in eating less healthy foods. In addition to improving measurement, there are several mechanisms that could be tested in future research. For example, there may some direct effects of increasing fruit and vegetable on satiety (3,5), so that children who consume more fruits and vegetables are fuller and less motivated to consume more usual higher energy-dense foods. It is also possible that youth have learned to substitute healthier for less healthy alternatives (6), so that when given the choice to consume healthy vs. higher energy-dense, less healthy alternatives, the children choose the healthier choices. Finally, parents in the healthy food group may make important changes in purchasing and food storage that could influence child intake. Families in the increase healthy food group may be purchasing more healthy foods than families in the reduce high energy-dense food group, while both groups of families may be reducing purchasing and cooking high energy-dense foods. This change in stimulus control, by increasing the variety and access to healthy foods may be responsible in part for changing child eating. It is possible that these factors are not working independently, but may interact. For example, children may find it easier to substitute healthy foods for less healthy foods if there is a greater variety of healthy foods to eat and access to less healthy alternatives is reduced. Research is needed to replicate these results in other age groups, and to understand the mechanism for why increasing fruits and vegetables leads to a reduction in high energy-dense foods and weight loss.
ACKNOWLEDGMENTS
This research was supported by grant HD 39792 (to LHE) from the National Institute of Child Health and Human Development. The authors thank Brian Wrotniak, Colleen Kilanowski, and Angela Wojcik for their work as therapists. Dr Epstein is a consultant to Kraft Foods.
Footnotes
DISCLOSURE The authors declared no conflict of interest.
REFERENCES
- 1.Epstein LH. Development of evidence-based treatments for pediatric obesity. In: Kazdin AE, Weisz JR, editors. Evidence-Based Psychotherapies For Children and Adolescents. Guilford Publications, Inc.; New York: 2003. pp. 374–388. [Google Scholar]
- 2.Rolls BJ, Drewnowski A, Ledikwe JH. Changing the energy density of the diet as a strategy for weight management. J Am Diet Assoc. 2005;105:S98–S103. doi: 10.1016/j.jada.2005.02.033. [DOI] [PubMed] [Google Scholar]
- 3.Rolls BJ, Bell EA, Castellanos VH, et al. Energy density but not fat content of foods affected energy intake in lean and obese women. Am J Clin Nutr. 1999;69:863–871. doi: 10.1093/ajcn/69.5.863. [DOI] [PubMed] [Google Scholar]
- 4.Bell EA, Castellanos VH, Pelkman CL, Thorwart ML, Rolls BJ. Energy density of foods affects energy intake in normal-weight women. Am J Clin Nutr. 1998;67:412–420. doi: 10.1093/ajcn/67.3.412. [DOI] [PubMed] [Google Scholar]
- 5.Rolls BJ, Roe LS, Meengs JS. Reductions in portion size and energy density of foods are additive and lead to sustained decreases in energy intake. Am J Clin Nutr. 2006;83:11–17. doi: 10.1093/ajcn/83.1.11. [DOI] [PMC free article] [PubMed] [Google Scholar]
- 6.Goldfield GS, Epstein LH. Can fruits and vegetables and activities substitute for snack foods? Health Psychol. 2002;21:299–303. [PubMed] [Google Scholar]
- 7.Nicklas TA. Calcium intake trends and health consequences from childhood through adulthood. J Am Coll Nutr. 2003;22:340–356. doi: 10.1080/07315724.2003.10719317. [DOI] [PubMed] [Google Scholar]
- 8.Skinner JD, Bounds W, Carruth BR, Ziegler P. Longitudinal calcium intake is negatively related to children's body fat indexes. J Am Diet Assoc. 2003;103:1626–1631. doi: 10.1016/j.jada.2003.09.018. [DOI] [PubMed] [Google Scholar]
- 9.Carruth BR, Skinner JD. The role of dietary calcium and other nutrients in moderating body fat in preschool children. Int J Obes Relat Metab Disord. 2001;25:559–566. doi: 10.1038/sj.ijo.0801562. [DOI] [PubMed] [Google Scholar]
- 10.Pereira MA, Jacobs DR, Jr., Van Horn L, et al. Dairy consumption, obesity, and the insulin resistance syndrome in young adults: the CARDIA Study. JAMA. 2002;287:2081–2089. doi: 10.1001/jama.287.16.2081. [DOI] [PubMed] [Google Scholar]
- 11.Zemel MB. Role of calcium and dairy products in energy partitioning and weight management. Am J Clin Nutr. 2004;79:S907–S912. doi: 10.1093/ajcn/79.5.907S. [DOI] [PubMed] [Google Scholar]
- 12.Thompson WG, Rostad Holdman N, Janzow DJ, et al. Effect of energy-reduced diets high in dairy products and fiber on weight loss in obese adults. Obes Res. 2005;13:1344–1353. doi: 10.1038/oby.2005.163. [DOI] [PubMed] [Google Scholar]
- 13.Harvey-Berino J, Gold BC, Lauber R, Starinski A. The impact of calcium and dairy product consumption on weight loss. Obes Res. 2005;13:1720–1726. doi: 10.1038/oby.2005.210. [DOI] [PubMed] [Google Scholar]
- 14.Aragona J, Cassady J, Drabman RS. Treating overweight children through parental training and contingency contracting. J Appl Behav Anal. 1975;8:269–278. doi: 10.1901/jaba.1975.8-269. [DOI] [PMC free article] [PubMed] [Google Scholar]
- 15.Birch LL, Fisher JO, Davison KK. Learning to overeat: maternal use of restrictive feeding practices promotes girls’ eating in the absence of hunger. Am J Clin Nutr. 2003;78:215–220. doi: 10.1093/ajcn/78.2.215. [DOI] [PMC free article] [PubMed] [Google Scholar]
- 16.U. S. Department of Agriculture . The Food Guide Pyramid. U.S. Government Printing Office; Washington, DC: 1992. [Google Scholar]
- 17.Kuczmarski RJ, Ogden CL, Guo SS, et al. Vital Health Statistics. Vol. 246. National Center for Health Statistics; Hyattsville, MD: 2002. CDC growth charts for the United States: methods and development. pp. 1–90. (11). [PubMed] [Google Scholar]
- 18.Epstein LH, Gordy CC, Raynor HA, et al. Increasing fruit and vegetable and decreasing fat and sugar intake in families at risk for childhood obesity. Obes Res. 2001;9:171–179. doi: 10.1038/oby.2001.18. [DOI] [PubMed] [Google Scholar]
- 19.Ainsworth BE, Haskell WL, Whitt MC, et al. Compendium of physical activities: an update of activity codes and MET intensities. Med Sci Sports Exerc. 2000;32:S498–S504. doi: 10.1097/00005768-200009001-00009. [DOI] [PubMed] [Google Scholar]
- 20.Baranowski T. Validity and reliability of self report measures of physical activity: an information-processing perspective. Res Q Exerc Sport. 1988;59:314–327. [Google Scholar]
- 21.Coleman KJ, Saelens BE, Wiedrich-Smith MD, Finn JD, Epstein LH. Relationships between Tritrac-R3D vectors, heart rate and self-report in obese children. Med Sci Sports Exerc. 1997;29:1535–1542. doi: 10.1097/00005768-199711000-00022. [DOI] [PubMed] [Google Scholar]
- 22.Hollingshead AB. Four Factor Index of Social Status. Yale University; New Haven, Connecticut: 1975. [Google Scholar]
- 23.Birch LL, Fisher JO, Grimm-Thomas K, et al. Confirmatory factor analysis of the Child Feeding Questionnaire: a measure of parental attitudes, beliefs and practices about child feeding and obesity proneness. Appetite. 2001;36:201–210. doi: 10.1006/appe.2001.0398. [DOI] [PubMed] [Google Scholar]
- 24.Schaefer ES. Children's reports of parental behavior: an inventory. Child Dev. 1965;36:413–424. [PubMed] [Google Scholar]
- 25.Margolies PJ, Weintraub S. The revised 56-item CRPBI as a research instrument: Reliability and factor structure. J Clin Psychol. 1977;33:472–476. [Google Scholar]
- 26.Locke LM, Prinz RJ. Measurement of parental discipline and nurturance. Clin Psychol Rev. 2002;22:895–929. doi: 10.1016/s0272-7358(02)00133-2. [DOI] [PubMed] [Google Scholar]
- 27.Kraemer HC, Frank E, Kupfer DJ. Moderators of treatment outcomes: clinical, research, and policy importance. JAMA. 2006;296:1286–1289. doi: 10.1001/jama.296.10.1286. [DOI] [PubMed] [Google Scholar]
- 28.Kraemer HC, Wilson GT, Fairburn CG, Agras WS. Mediators and moderators of treatment effects in randomized clinical trials. Archiv Gen Psychiatry. 2002;59:877–883. doi: 10.1001/archpsyc.59.10.877. [DOI] [PubMed] [Google Scholar]
- 29.Systat Software . Systat 10.2. SYSTAT Software, Inc.; Richmond, CA: 2002. [Google Scholar]
- 30.Littell RC, Milliken GA, Stroup WW, Wolfinger RD. SAS® System for Mixed Models. SAS Institute Inc.; Cary, NC: 1996. [Google Scholar]
- 31.Fisher JO, Birch LL. Eating in the absence of hunger and overweight in girls from 5 to 7 y of age. Am J Clin Nutr. 2002;76:226–231. doi: 10.1093/ajcn/76.1.226. [DOI] [PMC free article] [PubMed] [Google Scholar]
- 32.Francis LA, Birch LL. Maternal weight status modulates the effects of restriction on daughters’ eating and weight. Int J Obes Relat Metab Disord. 2005;29:942–949. doi: 10.1038/sj.ijo.0802935. [DOI] [PMC free article] [PubMed] [Google Scholar]
- 33.Bandini LG, Schoeller DA, Cyr HN, Dietz WH. Validity of reported energy intake in obese and non-obese adolescents. Am J Clin Nutr. 1990;52:421–425. doi: 10.1093/ajcn/52.3.421. [DOI] [PubMed] [Google Scholar]
- 34.Andersen LF, Tomten H, Haggarty P, Lovo A, Hustvedt BE. Validation of energy intake estimated from a food frequency questionnaire: a doubly labelled water study. Eur J Clin Nutr. 2003;57:279–284. doi: 10.1038/sj.ejcn.1601519. [DOI] [PubMed] [Google Scholar]
- 35.Ebbeling CB, Leidig MM, Sinclair KB, Hangen JP, Ludwig DS. A reduced-glycemic load diet in the treatment of adolescent obesity. Arch Pediatr Adolesc Med. 2003;157:773–779. doi: 10.1001/archpedi.157.8.773. [DOI] [PubMed] [Google Scholar]
- 36.Spieth LE, Harnish JD, Lenders CM, et al. A low-glycemic index diet in the treatment of pediatric obesity. Arch Pediatr Adolesc Med. 2000;154:947–951. doi: 10.1001/archpedi.154.9.947. [DOI] [PubMed] [Google Scholar]
- 37.Ludwig DS, Majzoub JA, Al-Zahrani A, et al. High glycemic index foods, overeating, and obesity. Pediatrics. 1999;103:E26. doi: 10.1542/peds.103.3.e26. [DOI] [PubMed] [Google Scholar]
- 38.Golan M, Weizman A, Apter A, Fainaru M. Parents as exclusive agents of change in the treatment of childhood obesity. Am J Clin Nutr. 1998;67:1130–1135. doi: 10.1093/ajcn/67.6.1130. [DOI] [PubMed] [Google Scholar]
- 39.Ledikwe JH, Blanck HM, Khan LK, et al. Low-energy-density diets are associated with high diet quality in adults in the United States. J Am Diet Assoc. 2006;106:1172–1180. doi: 10.1016/j.jada.2006.05.013. [DOI] [PubMed] [Google Scholar]
- 40.Ledikwe JH, Blanck HM, Kettel Khan L, et al. Dietary energy density is associated with energy intake and weight status in US adults. Am J Clin Nutr. 2006;83:1362–1368. doi: 10.1093/ajcn/83.6.1362. [DOI] [PubMed] [Google Scholar]