

Abstract
Background
Thyroid hormones (TH) may influence glucose metabolism. Hyperthyroid subjects have higher insulin secretion rates when compared with euthyroid individuals.
Objective
To evaluate the association between TH concentrations and insulin secretion in euthyroid, healthy Pima Indian adults (n=55, 29±7 years, females/males 36/19) with normal glucose tolerance (NGT) admitted to a Clinical Research Unit.
Methods
TSH, free thyroxine (FT4), 3,5,3′-L-tri-iodothyronine (FT3), and fasting plasma insulin (FPI) concentrations were measured in fasting plasma samples, percentage of body fat (%BF) by dual energy x-ray absorptiometry (DXA), acute insulin response (AIR), and incremental area under the curve (AUC) of insulin in response to a 25 g intravenous glucose tolerance test (IVGTT) and 75 g oral glucose tolerance test (OGTT) respectively and insulin action (M) during an euglycemic clamp.
Results
FT3 concentrations were associated with FPI, AIR, and insulin AUC both before (r=0.33, P=0.01; r=0.29, P=0.03; and r=0.35, P=0.008 respectively) and after adjustment for age, sex, %BF, glucose (fasting concentrations or glucose AUC), and M (β=0.09, P=0.01; β=0.16, P=0.03; and β=0.24, P=0.0007 respectively). No associations were found for TSH or FT4.
Conclusion
FT3 was associated with several measurements of insulin secretion in euthyroid individuals with NGT. T3 concentrations may play a role in the regulation of insulin secretion.
Introduction
Inadequate insulin secretion is an early event in the natural history of type 2 diabetes mellitus (T2DM) (1). Glucotoxicity and lipotoxicity (2), cellular nutrient overload (3), inflammatory/immune mechanisms (4), in utero exposure to a diabetic environment (5), low weight at birth (6), and genetic factors (5, 7) contribute to this insulin secretory dysfunction. Furthermore, a reduction in β-cell mass may be a characteristic of subjects with impaired fasting glucose and T2DM (8, 9). A better understanding of these and other factors influencing β-cell mass and function is important to prevent or delay the development of T2DM.
Thyroid hormones (TH) influence glucose metabolism. Current knowledge on the role of TH in both insulin secretion and action comes mainly from studies performed during experimental or spontaneous forms of hyperthyroidism. The elevated plasma glucose concentrations observed in hyperthyroid subjects are mainly accounted for by an increase in hepatic glucose production, since insulin-mediated glucose uptake in muscle is actually enhanced (10, 11). Insulin secretion rates have been reported to be enhanced in thyrotoxic individuals when they are compared with the euthyroid situation or with control subjects (10, 12–16).However, other studies have also reported no differences (17, 18) or even decreased (19, 20) secretion rates.
In euthyroid individuals, evidence for a physiological role of TH, if any, in insulin secretion is scarce. We aimed to investigate the association of TH with direct measurements of both insulin secretion and insulin action in euthyroid individuals with normal glucose regulation.
Subjects, materials, and methods
Subjects were members of the Gila River (Pima) Indian Community near Phoenix, AZ, USA. Participants were non-diabetic, healthy, adult full-blooded Pima, or closely related Tohono O’odham Indians who participated in an ongoing longitudinal study to identify risk factors for T2DM and obesity. Subjects in this study were part of a group (n=115) selected to examine the relationship of TH with energy expenditure and body weight. These subjects had normal thyroid function (based on normal serum thyroid-stimulating hormone (TSH) concentration, 0–3–4.5 mIU/l) and measurements of energy expenditure and substrate oxidation. For the present study, a subset of this group was selected if they had normal glucose tolerance (NGT) and measurements available for both insulin secretion and insulin action. Subjects were admitted to the Clinical Research Unit of the National Institute of Diabetes and Digestive and Kidney Diseases (NIDDK) in Phoenix, where they were fed a standard weight-maintaining diet for at least 3 days before metabolic testing. Subjects did not smoke or take medication at the time of the study. The study was approved by the NIDDK Institutional Review Board and the Gila River Indian Tribal Council. Before participation, written informed consent was obtained.
Percentage of body fat (%BF) was measured by whole-body dual- energy x-ray absorptiometry. Glucose tolerance status was assessed by a 3-h, 75 g oral glucose tolerance test (OGTT) (American Diabetes Association 2003).Acute insulin response (AIR) was calculated as the average incremental plasma insulin concentration from the third to the fifth minute after a 25 g i.v. glucose bolus. Insulin-mediated glucose disposal rate (M) was assessed at physiologic insulin concentrations (156±36 pmol/l) during a hyperinsulinemic–euglycemic clamp and normalized to estimated metabolic body size (EMBS, fat-free mass + 17.7 kg) (21).
Frozen fasting plasma samples were used to measure TSH and free TH concentrations at Linco-Diagnostic Services Inc., St Charles, MO, USA. Plasma TSH concentrations were measured by RIA (LincoPlex). Plasma 3,5,3′-L-tri-iodothyronine (FT3) and free thyroxine (FT4) concentrations were measured by a solid-phase 125I RIA (Diagnostic Product Corporation, Los Angeles, CA, USA) with intra-assay and inter-assay coefficient of variation (CV) values of 6 and 7.8% and 5 and 7%, respectively. Plasma glucose concentrations were measured using the glucose oxidase method (Beckman Instruments Inc., Fullerton, CA, USA). Plasma insulin concentrations were measured by two different radio-immunoassays used over time in our laboratory: Concept 4 (Concept 4; ICN, Costa Mesa, CA, USA) and Access (Beckman Instruments. Insulin assays). All measurements of insulin were normalized to the original RIA (a modified Herbert-Lau assay) using regression equations.
Statistical analyses were performed using SAS software (SAS version 9.1, SAS Institute Inc., Cary, NC, USA). All data are expressed as mean±S.D. throughout the manuscript. Incremental areas under the curve (AUC) for plasma glucose and insulin concentrations during oral glucose tolerance test (OGTT) were determined by the trapezoidal method. Non-normally distributed variables were log transformed (log10) to reduce skewness and then normality was re-evaluated. Pearson’s or Spearman’s correlation analyses were used to quantify relationships between TH concentrations and variables of interest. General linear regression models were used to assess independent relationships of FT3 with measurements of insulin secretion after adjustment for covariates. Level of statistical significance was set at P<0.05.
Results
Subjects were euthyroid young adults (Table 1). The FT3 concentrations were associated with fasting plasma insulin (FPI), AIR, and insulin AUC both before (Fig. 1) and after the adjustment for age, sex, and %BF (r=0.37, P=0.007; r=0.35, P=0.01; and r=0.39, P=0.005 respectively). No associations between FT3 concentrations and body fat, fasting glucose, incremental glucose AUC, or M were observed. Associations between FT3 concentrations and FPI, AIR, and insulin AUC were additionally adjusted for glucose concentration and insulin action, the most important determinants of insulin secretion. In multiple regression analyses, FT3 concentrations were positively associated with FPI, AIR, and insulin AUC after adjustment for age, sex, %BF, fasting plasma glucose concentrations, glucose AUC (only for the association with insulin AUC), and M (Table 2).
Table 1.
Subjects characteristics.
| n=55 | |
|---|---|
| Sex (females/males) | 36/19 |
| Age (years) | 29±7 |
| Height (cm) | 168±7 |
| Weight (kg) | 93±21 |
| BMI (kg/m2) | 33±8 |
| Body fat (%) | 32±7 |
| Fasting plasma glucose (mg/dl) | 87±10 |
| 2-h glucose (75 g OGTT, mg/dl) | 105±21 |
| Fasting plasma insulin (µU/ml) | 39±14 |
| AUC insulin (µU/ml per min) | 136±85 |
| Acute insulin response (µU/ml) | 270±120 |
| M (mg/kg EMBS min) | 2.8±1.5 |
| TSH (µIU/ml) | 2.7±1.5 |
| Free T4 (ng/dl) | 1.2±0.2 |
| Free T3 (pg/ml) | 2±0.4 |
Data are mean±S.D; BMI, body mass index; OGTT, oral glucose tolerance test; AUC, Incremental area under the curve; EMBS, estimated metabolic body size; TSH, thyroid-stimulating hormone; Insulin, glucose, TSH, free T3, and free T4 concentrations are given in conventional units; to convert to Système Intermationale units (pmol/l, mmol/l, µIU/l pmol/l, and pmol/l respectively) multiply by 6.945, 0.055, 1, 1.54, and 12.87 respectively.
Figure 1.
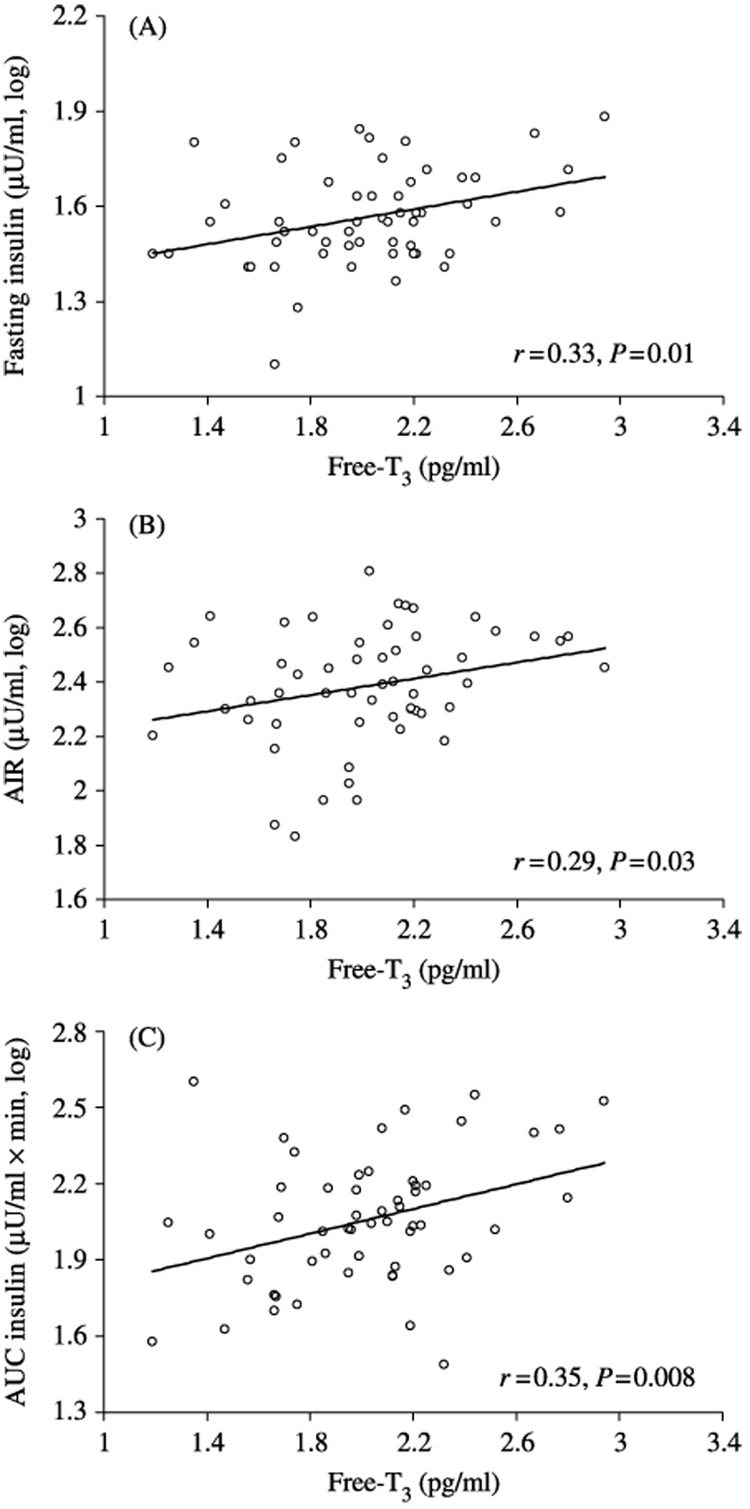
Association between plasma free T3 concentrations and fasting plasma insulin (A), acute insulin response (B), and incremental area under the curve of insulin (C). Correlation coefficients and P values are given.
Table 2.
Determinants of fasting plasma insulin, acute insulin response, and insulin AUC.
| Fasting insulin (log10) | AIR (log10) | Insulin AUC (log10) | ||||
|---|---|---|---|---|---|---|
| R2=0.70, P<0.0001 | R2=0.34, P=0.002 | R2=0.62, P<0.0001 | ||||
| β | P | β | P | β | P | |
| Age (years) | −0.004 | 0.03 | −0.009 | 0.03 | −0.009 | 0.01 |
| Sex (male) | 0.006 | 0.9 | −0.11 | 0.2 | −0.16 | 0.02 |
| Body fat (%) | 0.01 | 0.0005 | −0.001 | 0.8 | −0.001 | 0.9 |
| Fasting glucose (mg/ml) | 0.002 | 0.3 | −0.007 | 0.02 | – | – |
| Glucose AUC (mg/dl per min) | - | - | - | - | 0.004 | 0.004 |
| M (log10) | −0.38 | 0.001 | −0.53 | 0.02 | −0.85 | 0.0002 |
| Free T3 (pg/ml) | 0.09 | 0.01 | 0.16 | 0.03 | 0.24 | 0.0007 |
Data are β (estimated partial regression coefficient) and P values for the association of free T3 concentrations (mean±S.D. 2±0.4 pg/ml) with fasting insulin (mean±S.D. 39±14 µU/ml), AIR (acute insulin response, mean±S.D. 270±120 µU/ml), and insulin AUC (insulin area under the curve, mean±S.D. 136±85 µU/ml per min) after adjustment for covariates. Total R2 and P values for the entire model are given. M: insulin-mediated glucose disposal rate at physiological insulin concentrations. Insulin (µUI/ml), glucose (mg/dl), and free T3 (pg/ml) concentrations are given in conventional units; to convert to Système Internationale units (pmol/l, mmol/l, and pmol/l) multiply by 6.945, 0.055, and 1.54 respectively.
Neither FT4 nor TSH concentrations were associated with FPI, AIR, fasting glucose, or M. The FT4 concentrations were weakly associated with insulin AUC (r=0.25, P=0.07).
Discussion
In euthyroid Pima Indians with NGT, plasma concentrations of FT3 were associated with fasting insulin and with both a direct measurement (AIR) and an estimate (insulin AUC) of β-cell function derived from intravenous glucose tolerance test (IVGTT) and OGTT respectively. These associations were independent of insulin-mediated glucose uptake and plasma glucose concentrations, both major determinants of insulin secretion.
The association between TH and insulin secretion has been investigated mainly in individuals with hyperthyroidism (10, 12–19). A serendipitous, positive association between serum-FT3 and an estimate of insulin production (calculated from the insulin clearance during the clamp and fasting insulin concentrations) was found in euthyroid, lean, healthy individuals (22). A physiological mechanism for the possible role of TH on insulin secretion has not been clearly established, however, evidence indicates that TH may affect both β-cell mass and function.
TH are critically involved in cell growth and development. Plate chondrocyte hypertrophic differentiation (23), cardiomyocyte growth (24), neuronal and glial cell differentiation (25), and primary B lymphopoiesis (26) are influenced by TH. T3 is also a powerful inducer of pancreatic acinar cell proliferation in rodents (27). β-Cell mass is determined by a balance between β-cell replication, size, and neogenesis, and rate of β-cell apoptosis (28). In vitro studies of human and rodent insulinoma cell lines showed that T3 protects from apoptosis and induces β-cell growth and proliferation (29). The latter effect was mediated by interaction of T3 with its receptors and associated with changes in the expression of cell cycle-related proteins (29). Human pancreatic duct cells (hPANC-1) express high levels of TH receptor isoforms (30). Treatment of hPANC-1 cells with T3 induces changes in cell morphology, promotes cell differentiation into insulin-producing β-cells, upregulates insulin and glucose transporter protein-2 transcripts, and increases insulin release into the medium (30). Furthermore, T3 affects the splicing and secretion of β-amyloid precursor proteins (APP) isoforms (31) and represses the expression of the APP gene in neuroblastoma cells (32). Whether T3 has a similar effect on islet amyloid polypeptide, a potential cytotoxic protein for β cells, is not known.
On the other hand, TH may also influence β-cell function. TH receptor has been identified in pancreatic β -cell lines (33). T3-enhanced insulin release in isolated rat pancreatic islets exposed to glucose concentrations of 2–8 mmol/l, had no effect at concentrations of 12 mmol/l, and inhibited insulin release at concentrations of 16.6 mmol/l (34). T3 promotes expression of important proteins involved in both glucose and lipid metabolism that may influence insulin secretion. In particular, carnitine palmitoyl transferase 1 (CPT-1) expression and activity (35, 36), mitochondrial glycerol-3-phosphate dehydrogenase (mGPDH) activity (37), and levels of excitatory amino acid transporter type 1 (EAAT1) mRNA and protein (38) are increased by TH. EAAT1 and mGPDH are key components of the NADH shuttles which are essential for coupling glycolysis with mitochondrial ATP generation and triggering glucose-induced insulin secretion (39). CPT-1 is responsible for the transport of fatty acids into the mitochondria for oxidation. Accumulation of long-chain fatty acyl-CoAs is proposed to mediate the deleterious effects of chronically elevated fatty acids on insulin secretion (2). However, free fatty acids (FFAs), when not chronically in excess, are essential to the pancreatic β-cell for its normal function, in particular, for glucose-stimulated insulin secretion (40). It has been reported that hyperthyroid individuals have higher serum concentrations of FFAs, glycerol, and rates of lipolysis in adipose tissue (41, 42). Whether, and how, FFA concentrations or rates of lipolysis are similarly influenced at physiological TH concentrations in euthyroid individuals and whether this favors insulin secretion is not known. Unfortunately, FFA concentrations were not available in our study population.
In summary, plasma-free T3 concentrations were associated with direct and indirect measurements of insulin secretion independent of insulin sensitivity and glucose concentrations in euthyroid individuals with NGT. T3 concentrations may play a role in the regulation of insulin secretion.
Acknowledgements
We are grateful to Dr Jeff Curtis for critical reading of the manuscript. We would like to thank the clinical, dietary, and laboratory staffs of the NIDDK Clinical Research Unit staff. Most of all, we thank our volunteers and the members and leaders of the Gila River Indian Community for their continuing cooperation in our studies. This research was supported by the Intramural Research Program of the NIH/NIDDK.
References
- 1.Lillioja S, Mott DM, Spraul M, Ferraro R, Foley JE, Ravussin E, Knowler WC, Bennett PH, Bogardus C. Insulin resistance and insulin secretory dysfunction as precursors of non-insulin-dependent diabetes mellitus. Prospective studies of Pima Indians. New England Journal of Medicine. 1993;329:1988–1992. doi: 10.1056/NEJM199312303292703. [DOI] [PubMed] [Google Scholar]
- 2.Poitout V, Robertson RP. Minireview: secondary β-cell failure in type 2 diabetes - a convergence of glucotoxicity and lipotoxicity. Endocrinology. 2002;143:339–342. doi: 10.1210/endo.143.2.8623. [DOI] [PubMed] [Google Scholar]
- 3.Cooksey RC, Pusuluri S, Hazel M, McClain DA. Hexosamines regulate sensitivity of glucose-stimulated insulin secretion in β-cells. American Journal of Physiology. Endocrinology and Metabolism. 2006;290:E334–E340. doi: 10.1152/ajpendo.00265.2005. [DOI] [PubMed] [Google Scholar]
- 4.Donath MY, Storling J, Maedler K, Mandrup-Poulsen T. Inflammatory mediators and islet β-cell failure: a link between type 1 and type 2 diabetes. Journal of Molecular Medicine. 2003;81:455–470. doi: 10.1007/s00109-003-0450-y. [DOI] [PubMed] [Google Scholar]
- 5.Gautier JF, Wilson C, Weyer C, Mott D, Knowler WC, Cavaghan M, Polonsky KS, Bogardus C, Pratley RE. Low acute insulin secretory responses in adult offspring of people with early onset type 2 diabetes. Diabetes. 2001;50:1828–1833. doi: 10.2337/diabetes.50.8.1828. [DOI] [PubMed] [Google Scholar]
- 6.Ong KK, Petry CJ, Emmett PM, Sandhu MS, Kiess W, Hales CN, Ness AR, Dunger DB. Insulin sensitivity and secretion in normal children related to size at birth, postnatal growth, and plasma insulin-like growth factor-I levels. Diabetologia. 2004;47:1064–1070. doi: 10.1007/s00125-004-1405-8. [DOI] [PubMed] [Google Scholar]
- 7.Pimenta W, Korytkowski M, Mitrakou A, Jenssen T, Yki-Jarvinen H, Evron W, Dailey G, Gerich J. Pancreatic β-cell dysfunction as the primary genetic lesion in NIDDM. Evidence from studies in normal glucose-tolerant individuals with a first-degree NIDDM relative. Journal of the American Medical Association. 1995;273:1855–1861. [PubMed] [Google Scholar]
- 8.Butler AE, Janson J, Bonner-Weir S, Ritzel R, Rizza RA, Butler PC. β-cell deficit and increased β-cell apoptosis in humans with type 2 diabetes. Diabetes. 2003;52:102–110. doi: 10.2337/diabetes.52.1.102. [DOI] [PubMed] [Google Scholar]
- 9.Yoon KH, Ko SH, Cho JH, Lee JM, Ahn YB, Song KH, Yoo SJ, Kang MI, Cha BY, Lee KW, Son HY, Kang SK, Kim HS, Lee IK, Bonner-Weir S. Selective β-cell loss and α-cell expansion in patients with type 2 diabetes mellitus in Korea. Journal of Clinical Endocrinology and Metabolism. 2003;88:2300–2308. doi: 10.1210/jc.2002-020735. [DOI] [PubMed] [Google Scholar]
- 10.Dimitriadis G, Baker B, Marsh H, Mandarino L, Rizza R, Bergman R, Haymond M, Gerich J. Effect of thyroid hormone excess on action, secretion, and metabolism of insulin in humans. American Journal of Physiology. 1985;248:E593–E601. doi: 10.1152/ajpendo.1985.248.5.E593. [DOI] [PubMed] [Google Scholar]
- 11.Muller MJ, Acheson KJ, Jequier E, Burger AG. Effect of thyroid hormones on oxidative and nonoxidative glucose metabolism in humans. American Journal of Physiology. 1988;255:E146–E152. doi: 10.1152/ajpendo.1988.255.2.E146. [DOI] [PubMed] [Google Scholar]
- 12.Ahren B, Lundquist I, Hedner P, Valdemarsson S, Schersten B. Glucose tolerance and insulin and C-peptide responses after various insulin secretory stimuli in hyper- and hypothyroid subjects before and after treatment. Diabetes Research. 1985;2:95–103. [PubMed] [Google Scholar]
- 13.Holdsworth CD, Besser GM. Influence of gastric emptying-rate and of insulin response on oral glucose tolerance in thyroid disease. Lancet. 1968;2:700–702. doi: 10.1016/s0140-6736(68)90747-2. [DOI] [PubMed] [Google Scholar]
- 14.Jap TS, Ho LT, Won JG. Insulin secretion and sensitivity in hyperthyroidism. Hormone Metabolic Research. 1989;21:261–266. doi: 10.1055/s-2007-1009208. [DOI] [PubMed] [Google Scholar]
- 15.O’Meara NM, Blackman JD, Sturis J, Polonsky KS. Alterations in the kinetics of C-peptide and insulin secretion in hyperthyroidism. Journal of Clinical Endocrinology and Metabolism. 1993;76:79–84. doi: 10.1210/jcem.76.1.8421108. [DOI] [PubMed] [Google Scholar]
- 16.Shen DC, Davidson MB. Hyperthyroid Graves’ disease causes insulin antagonism. Journal of Clinical Endocrinology and Metabolism. 1985;60:1038–1041. doi: 10.1210/jcem-60-5-1038. [DOI] [PubMed] [Google Scholar]
- 17.Asano T, Okumura M. Insulin delivery rate in response to glucose and arginine infusion in hyperthyroidism. Diabetologia. 1982;23:108–113. doi: 10.1007/BF01271170. [DOI] [PubMed] [Google Scholar]
- 18.Taylor R, McCulloch AJ, Zeuzem S, Gray P, Clark F, Alberti KG. Insulin secretion, adipocyte insulin binding and insulin sensitivity in thyrotoxicosis. Acta Endocrinologica. 1985;109:96–103. doi: 10.1530/acta.0.1090096. [DOI] [PubMed] [Google Scholar]
- 19.Ikeda T, Fujiyama K, Hoshino T, Takeuchi T, Mashiba H, Tominaga M. Oral and intravenous glucose-induced insulin secretion in hyperthyroid patients. Metabolism. 1990;39:633–637. doi: 10.1016/0026-0495(90)90031-7. [DOI] [PubMed] [Google Scholar]
- 20.Roti E, Braverman LE, Robuschi G, Salvi M, Gardini E, d’Amato L, Maestri D, Montermini M, Borciani E, Pezzarossa A. Basal and glucose- and arginine-stimulated serum concentrations of insulin, C-peptide, and glucagon in hyperthyroid patients. Metabolism. 1986;35:337–342. doi: 10.1016/0026-0495(86)90151-4. [DOI] [PubMed] [Google Scholar]
- 21.Lillioja S, Bogardus C. Obesity and insulin resistance: lessons learned from the Pima Indians. Diabetes/Metabolism Reviews. 1988;4:517–540. doi: 10.1002/dmr.5610040508. [DOI] [PubMed] [Google Scholar]
- 22.Bakker SJ, ter Maaten JC, Popp-Snijders C, Heine RJ, Gans RO. Triiodothyronine: a link between the insulin resistance syndrome and blood pressure? Journal of Hypertension. 1999;17:1725–1730. doi: 10.1097/00004872-199917120-00009. [DOI] [PubMed] [Google Scholar]
- 23.Harvey CB, O’Shea PJ, Scott AJ, Robson H, Siebler T, Shalet SM, Samarut J, Chassande O, Williams GR. Molecular mechanisms of thyroid hormone effects on bone growth and function. Molecular Genetics and Metabolism. 2002;75:17–30. doi: 10.1006/mgme.2001.3268. [DOI] [PubMed] [Google Scholar]
- 24.Kinugawa K, Jeong MY, Bristow MR, Long CS. Thyroid hormone induces cardiac myocyte hypertrophy in a thyroid hormone receptor alpha1-specific manner that requires TAK1 and p38 mitogen-activated protein kinase. Molecular Endocrinology. 2005;19:1618–1628. doi: 10.1210/me.2004-0503. [DOI] [PMC free article] [PubMed] [Google Scholar]
- 25.Konig S, Moura NV. Thyroid hormone actions on neural cells. Cellular and Molecular Neurobiology. 2002;22:517–544. doi: 10.1023/a:1021828218454. [DOI] [PubMed] [Google Scholar]
- 26.Dorshkind K, Horseman ND. The roles of prolactin, growth hormone, insulin-like growth factor-I, and thyroid hormones in lymphocyte development and function: insights from genetic models of hormone and hormone receptor deficiency. Endocrine Reviews. 2000;21:292–312. doi: 10.1210/edrv.21.3.0397. [DOI] [PubMed] [Google Scholar]
- 27.Ledda-Columbano GM, Perra A, Pibiri M, Molotzu F, Columbano A. Induction of pancreatic acinar cell proliferation by thyroid hormone. Journal of Endocrinology. 2005;185:393–399. doi: 10.1677/joe.1.06110. [DOI] [PubMed] [Google Scholar]
- 28.Rhodes CJ. Type 2 diabetes-a matter of β-cell life and death? Science. 2005;307:380–384. doi: 10.1126/science.1104345. [DOI] [PubMed] [Google Scholar]
- 29.Verga FC, Panacchia L, Bucci B, Stigliano A, Caballo MG, Brunetti E, Toscano V, Misiti S. 3,5,3′-Triiodothyronine (T3) is a survival factor for pancreatic β -cells undergoing apoptosis. Journal of Cellular Physiology. 2006;206:309–321. doi: 10.1002/jcp.20460. [DOI] [PubMed] [Google Scholar]
- 30.Misiti S, Anastasi E, Sciacchitano S, Verga FC, Panacchia L, Bucci B, Khouri D, D’Acquarica I, Brunetti E, Di Mario U, Toscano V, Perfetti R. 3,5,3′L-thyronine enhances the differentiation of a human pancreatic duct cell line (hPANC-1) towards a β-cell-like phenotype. Journal of Cellular Physiology. 2005;204:286–296. doi: 10.1002/jcp.20293. [DOI] [PubMed] [Google Scholar]
- 31.Latasa MJ, Belandia B, Pascual A. Thyroid hormones regulate β-amyloid gene splicing and protein secretion in neuroblastoma cells. Endocrinology. 1998;139:2692–2698. doi: 10.1210/endo.139.6.6033. [DOI] [PubMed] [Google Scholar]
- 32.Belandia B, Latasa MJ, Villa A, Pascual A. Thyroid hormone negatively regulates the transcriptional activity of the β-amyloid precursor protein gene. Journal of Biological Chemistry. 1998;273:30366–30371. doi: 10.1074/jbc.273.46.30366. [DOI] [PubMed] [Google Scholar]
- 33.Verga FC, Petrucci E, Patriarca V, Michienzi S, Stigliano A, Brunetti E, Toscano V, Misiti S. Thyroid hormone receptor TRβ1 mediates Akt activation by T3 in pancreatic β-cells. Journal of Molecular Endocrinology. 2007;38:221–233. doi: 10.1677/jme.1.02166. [DOI] [PubMed] [Google Scholar]
- 34.Cortizo AM, Chazenbalk GD, de Gagliardino EE, Garcia ME, Pisarev MA, Gagliardino JJ. Thyroid hormone binding and - deiodination by pancreatic islets: relationship with the in vitro effect upon insulin secretion. Acta Endocrinologica. 1987;116:66–72. [PubMed] [Google Scholar]
- 35.Jansen MS, Cook GA, Song S, Park EA. Thyroid hormone regulates carnitine palmitoyltransferase Ialpha gene expression through elements in the promoter and first intron. Journal of Biological Chemistry. 2000;275:34989–34997. doi: 10.1074/jbc.M001752200. [DOI] [PubMed] [Google Scholar]
- 36.Mynatt RL, Park EA, Thorngate FE, Das HK, Cook GA. Changes in carnitine palmitoyltransferase-I mRNA abundance produced by hyperthyroidism and hypothyroidism parallel changes in activity. Biochemical and Biophysical Research Communications. 1994;201:932–937. doi: 10.1006/bbrc.1994.1791. [DOI] [PubMed] [Google Scholar]
- 37.Lee YP, Lardy HA. Influence of thyroid hormones on l-alpha-glycerophosphate dehydrogenases and other dehydrogenases in various organs of the rat. Journal of Biological Chemistry. 1965;240:1427–1436. [PubMed] [Google Scholar]
- 38.Ralphe JC, Bedell K, Segar JL, Scholz TD. Correlation between myocardial malate/aspartate shuttle activity and EAAT1 protein expression in hyper- and hypothyroidism. American Journal of Physiology. Heart and Circulatory Physiology. 2005;288:H2521–H2526. doi: 10.1152/ajpheart.00991.2004. [DOI] [PubMed] [Google Scholar]
- 39.Eto K, Tsubamoto Y, Terauchi Y, Sugiyama T, Kishimoto T, Takahashi N, Yamauchi N, Kubota N, Murayama S, Aizawa T, Akanuma Y, Aizawa S, Kasai H, Yazaki Y, Kadowaki T. Role of NADH shuttle system in glucose-induced activation of mitochondrial metabolism and insulin secretion. Science. 1999;283:981–985. doi: 10.1126/science.283.5404.981. [DOI] [PubMed] [Google Scholar]
- 40.Nolan CJ, Madiraju MS, Delghingaro-Augusto V, Peyot ML, Prentki M. Fatty acid signaling in the β-cell and insulin secretion. Diabetes. 2006;55:S16–S23. doi: 10.2337/db06-s003. [DOI] [PubMed] [Google Scholar]
- 41.Dimitriadis G, Mitrou P, Lambadiari V, Boutati E, Maratou E, Koukkou E, Tzanela M, Thalassinos N, Raptis SA. Glucose and lipid fluxes in the adipose tissue after meal ingestion in hyperthyroidism. Journal of Clinical Endocrinology and Metabolism. 2006;91:1112–1118. doi: 10.1210/jc.2005-0960. [DOI] [PubMed] [Google Scholar]
- 42.Riis AL, Gravholt CH, Dujurhuus CB, Norrelund H, Jorgensen JO, Weeke J, Moller N. Elevated regional lipolysis in hyperthyroidism. Journal of Clinical Endocrinology and Metabolism. 2002;87:4747–4753. doi: 10.1210/jc.2002-020174. [DOI] [PubMed] [Google Scholar]