

Abstract
The time-varying influences of peer and family support on adolescent daily mood were explored among youth transitioning from middle school to high school (8th to 9th grade, N = 268) as compared to youth transitioning from 10th to 11th grade (N = 240). Real-time measures of daily positive and negative affect (ecological momentary assessments) were collected via palmtop computers at baseline, 6 months, and 12 months. Participants rated 12 mood adjectives in response to 5 to 7 random prompts per day for 7 consecutive days. Perceived peer and family support were assessed via self-report. Mixed-effects regression analyses revealed significant grade by time by peer support interactions for positive and negative mood, with the younger cohort showing greater increases in the relation between peer support and affect over time than the older cohort. Family support did not interact with cohort or time.
Research on risk and protective processes has highlighted the role of social support in adolescent mental health (Lewinsohn et al., 1994; Windle, 1992). Numerous studies have demonstrated the protective relations between family and parental support and adolescent mood and depressive symptomatology (Ge, Lorenz, Conger, Elder, & Simons, 1994; Stice, Ragan, & Randall, 2004; Windle, 1992). However, research on the positive effects of peer support is inconsistent, and the associations between peer support and adolescent well-being in longitudinal studies tend to be weak (Berndt, 1999; DuBois, Felner, Brand, Adan, & Evans, 1992). Moreover, findings regarding the relative contributions of family versus peer support to adolescent emotional functioning are mixed. For example, Burton, Stice, and Seeley (2004) found that deficits in peer support but not parental support had a small but significant association with subsequent increases in depressive symptoms in a sample of 11- to 15-year-old girls. In contrast, longitudinal studies of parent versus peer support indicated that only parental support prospectively predicted change in depressive symptoms (Lewinsohn et al., 1994; Stice et al., 2004; Windle, 1992). Thus, past studies have generated inconsistent results regarding the roles of family and peer support in adolescent mental health.
Little is also known about the time trends of the influences of peers and families. Developmental theory and research suggest that the relative importance of peer and family networks changes across adolescence (Furman & Buhrmester, 1992; Larson & Richards, 1991). The influences of peer and family support on well-being are likely to change during this period as well. Lending support to this assertion, cross-sectional research has found that the association between friendship intimacy and emotional adjustment is stronger in adolescence as compared to preadolescence (Buhrmester, 1990), whereas the relation between parental support and emotional problems was found to weaken with age in a sample of 12- to 24-year-olds (Helsen, Vollebergh, & Meeus, 2000). However, only a few longitudinal studies (e.g., DuBois et al., 2002; Hu, Flay, Hedeker, Siddiqui, & Day, 1995) have modeled social support as a time-varying predictor of adolescent outcomes using sufficient measurement waves and appropriate statistical techniques to capture dynamic processes. As such, it remains uncertain whether the relations of peer and family support with mood become stronger, weaker, or remain static with development (Berndt, 1999). Efforts to improve the quality of peer and family support in adolescence require a stronger understanding of the patterns of influence across development, rather than simply determining whether one influence is stronger than the other (DuBois et al., 2002).
Although current perspectives recognize that the peer group is not merely a functional replacement for the family during adolescence (Steinberg, 2001), evidence points to considerable variance in the roles that peer and family support networks play across this developmental transition. The social network of the early adolescent is dynamic, with increased time spent with peers relative to time spent with the family (Larson & Richards, 1991; Larson, Richards, Moneta, Holmbeck, & Duckett, 1996). In addition, closeness and intimacy in peer relationships are enhanced in adolescence (Furman & Buhrmester, 1992), and interactions become more emotionally rewarding (Larson & Richards, 1991).
In contrast, adolescents experience increased emotional autonomy and behavioral independence from parents (Steinberg, 2001; Steinberg & Silverberg, 1986) and report decreased perceptions of support from parents as compared to preadolescents (Furman & Buhrmester, 1992). However, evidence also points to stability in certain aspects of the parent–adolescent relationship across development. For example, Larson and colleagues (1996) found that whereas total time with parents decreased across 5th through 12th grade, the amount of one-on-one time spent with either parent did not decline with age.
Past adolescent research has examined the influences of peers and families on depressive symptomatology among clinical and community samples, but less attention has been paid to daily well-being. Methodological advances in mood assessment, such as ecological momentary assessment (EMA; Stone & Shiffman, 1994), have improved the assessment of the daily emotional experiences of adolescents. EMA can capture immediate emotional states by assessing phenomenon in the moment they occur. Moreover, these methods are less susceptible to the biases of global questionnaire methods (Stone & Shiffman, 1994). Experience sampling techniques have been used effectively in previous studies to examine adolescent mood (e.g., Larson, Moneta, Richards, & Wilson, 2002).
To clarify the dynamic associations of family and peer support and emotional functioning across critical periods in adolescence, this study examined the time-varying relations of perceived peer and family support on daily mood across a 1-year period among an 8th-grade cohort and a 10th-grade cohort. Specifically, with the two cohorts, we examined whether peers and families were differentially associated with mood at different points in adolescence. We hypothesized that both peer and family support would significantly predict adolescent mood patterns. However, in light of research on developmental changes in peer and family support networks in adolescence (Furman & Buhrmester, 1992; Larson & Richards, 1991), we expected that grade would moderate the support–mood relations over time. That is, across the 1-year assessment period, we predicted that peer and family support would each have different patterns of associations for the younger versus older cohorts: Peer support–mood associations would increase across grades and time, whereas family support–mood associations would weaken or stabilize. In addition, exploratory analyses examined sex as a moderator of these patterns.
Methods
Participants
Potential participants were 8th- and 10th-grade students from 14 Chicago suburban–metropolitan area schools invited to participate in a larger longitudinal study of the natural history of smoking based on responses to a brief screening survey about smoking history and intentions to smoke. For the screening phase, a passive consent procedure (i.e., waiver of written parental consent) was employed such that parents and students were notified prior to the screening and given the opportunity to decline their child’s participation. Survey responses were used to identify students who had never smoked but were contemplating smoking and students who were experimenting with smoking (defined as youth who smoked less than 100 cigarettes in their lifetime and were not yet daily smokers); 5,278 students were screened, 2,153 met inclusion criteria, and 1,457 were invited to participate. Invitation and recruitment packets were mailed to eligible students and their parents. Students were enrolled in the longitudinal study after written parental consent and student assent were obtained.
Of those invited, 713 (48%) agreed to participate, and 562 (81%) completed the baseline wave. The consent rate is similar to those reported in other EMA and experience sampling studies with adolescents (e.g., Larson et al., 2002; Silk, Steinberg, & Morris, 2003). Failure to complete the baseline assessment was due to (a) students were sick or absent for their data-collection visit and were unable to reschedule (n = 25, 17%); (b) students did not bring parental consent forms to their appointment (n = 12, 8%); or (c) students were turned away by research staff because enrollment in a particular school was filled (n = 114, 76%). Details regarding the procedures can be found in Diviak, Kohler, O’Keefe, Mermelstein, and Flay (2006).
Among the 8th-grade cohort (N = 296), mean age was 13.94 years (SD = .40); 52% were girls; and racial or ethnic composition was 68% White, 3% African American, 18% Latino, and 12% other or biracial. Among the 10th-grade cohort (N = 266), mean age was 16.01 years (SD = .42); 57.5% were girls; and racial or ethnic composition was 74% White, 8% African American, 8% Latino, and 4% other or biracial. Average parental education for the sample was as follows: 30% completed high school or less, 17% completed some college, and 45% completed college or more. The characteristics of the 562 participants enrolled at baseline were compared to the 1,457 students initially invited to participate on the following demographic characteristics: sex, race, and grade. There were minimal differences on most measures (odds ratios ranged from 0.70 to 1.52, with broad confidence intervals), although girls and White students were overrepresented in the final sample (55% and 72%, respectively) than in the full screening sample (51% and 71%, respectively; for details, see Diviak et al., 2006). Experience with cigarette smoking did not differ between those invited and those who participated (odds ratios ranged from 0.83 to 1.18 on a variety of measures, with broad confidence intervals).
Procedures
All participants received training on the use of the EMA device at the beginning of the data-collection week and carried the device for 7 consecutive days at each measurement wave. The palmtop computers randomly prompted the adolescents approximately five to seven times per day to answer questions about their mood, behavior, and situation; only mood items were analyzed in this study. Participants received a payment of $40 at the end of each data-collection week. In addition, self-report questionnaire packets were mailed to the adolescents 2 weeks prior to each data wave. The participant was instructed to bring the completed packet to his or her EMA training session and was paid $10 on receipt of each completed packet. Baseline visits were staggered throughout the fall and spring at various schools. All participants were in either 8th or 10th grade at baseline and had transitioned into 9th or 11th grade by the 12-month wave. For the younger cohort, the 6-month time point reflects the post-8th grade transition period (summer and early fall of 9th grade). Procedures during all phases of the study received approval from the Institutional Review Board at the University of Illinois at Chicago.
Measures
Daily affect (EMA)
Participants were asked on each EMA interview to rate their mood just before the prompt; for example, “Before the signal, I felt happy.” Participants responded to mood adjectives using a 10-point Likert-type scale ranging from 1 (not at all) to 10 (very). The adjectives were selected based on pilot work involving qualitative (focus groups and in-depth interviews) and quantitative data collection with 146 eighth- and 10th-graders recruited from similar schools to those involved in this study. Confirmatory factor analyses on our sample revealed a Positive Affect (PA) factor (i.e., happy, relaxed, and cheerful), all with factor loadings of at least .74 (Cronbach’s α in this sample ranged from .72 to .73 across waves). A Negative Affect (NA) factor was formed (i.e., lonely, embarrassed, sad, angry, and left-out), all with factor loadings greater than .50 (Cronbach’s α ranged from .73 to .78). PA and NA correlated −.44 to −.36 across waves. In light of work suggesting that PA and NA represent distinct dimensions of emotion (Watson & Tellegen, 1985), PA and NA were examined as independent scales in this study.
Measures of daily mood as assessed by adjectives have increasingly been used to study adolescents’ emotional experience (e.g., Larson et al., 2002; Larson & Richards, 1991; Silk et al., 2003; Whalen, Jamner, Henker, & Delfino, 2001) and have been shown to predict indicators of adolescent adjustment and well-being such as stress, depression, and self-esteem (Larson et al., 2002). In our own work, we have found that measures of daily affect significantly correlate with measures of depressive mood (see Weinstein, Mermelstein, Hankin, Hedeker, & Flay, in press).
Demographics and smoking history
Age, grade, sex, race or ethnicity, parental education, and smoking history were assessed via self-report questionnaires. For the purposes of this study, data on smoking history were used to categorize adolescents into two smoking status groups. Nonsmokers (N = 379) refer to youth who never progressed beyond the initial stages of trying smoking, including those who smoked zero cigarettes in their life (n = 154), those who smoked zero cigarettes during the study but indicated having ever smoked in their life (n = 32), and those who smoked during one 90-day period during the study but smoked less than 20 cigarettes in their lifetime (n = 193). The second group, experimenters and beyond (N = 183), include those reporting more frequent experimentation, escalation, regular use, or higher experimentation followed by quitting during the study. This division allowed us to control for potential confounds of smoking status on the relations examined in the study, as groupings were based on the assumption that youth who experiment with smoking may be more vulnerable to a variety of problem behaviors than youth who smoke once or twice (Jamner et al., 2003).
Family support
Family support was assessed using the Family Relationship Index, a combination of three subscales of the Family Environment Scale (Moos & Moos, 1994). The 27-item Family Relationship Index is the sum of the Cohesion, Expressiveness, and Conflict (reversed) subscales, such that higher scores reflect higher perceived quality of family relationships. This index has been used in past research as a summary measure of family support (Bloom & Spiegel, 1984; McGee, Williams, & Silva, 1984) and has good test–retest reliability and validity as indicated by significant associations with measures of dyadic adjustment, family arguments, reports of support from other family members, and children’s social and cognitive development (Moos & Moos, 1994). To improve the internal consistency of the scale for this sample, two items were excluded from analyses (“We say anything we want to,” and “We are usually careful about what we say to each other”). Cronbach’s α for the final 25-item scale ranged from .88 to .89 across waves. Although the original measure uses a 2-point (true/false) response format, items in this study were rated according to a 4-point scale ranging from 1 (definitely false) to 4 (definitely true).
Peer support
Eighteen items from the Attachment to Peers subscale of the Inventory of Parent and Peer Attachment (Armsden & Greenberg, 1987) were used to measure adolescent perceptions of peer support. Specifically, these items assess the degree of trust, closeness, and communication in peer relationships, including items such as “My friends understand me” and “My friends are concerned about my well-being.” These items were selected as a result of factor analysis in this sample; Cronbach’s αs were .93 to .94 across waves. Items are scored on a 5-point Likert-type scale ranging from 1 (almost never/never true) to 5 (almost always/always true). Higher scores reflect greater perceived support and attachment. Armsden and Greenberg (1987) reported strong test–retest and internal reliability; validity of the Inventory of Parent and Peer Attachment as a measure of peer support in adolescence is indicated by positive correlations with social self-concept, tendency to utilize peers in times of need, and self-esteem.
Results
Analytic Approach
Given the hierarchically nested design of the data set, in which momentary mood assessments were nested within participants, our research questions were analyzed using mixed-effects regression models (MRMs; Laird & Ware, 1982) via SAS PROC MIXED. MRMs simultaneously address both the momentary and participant levels of data while remaining robust to the data dependency that occurs with the repeated assessments of individuals over time via EMA. This study employed random intercept and trend modeling, a subclass of MRM that accounts for each individual’s distinct initial level of affect and rate of change across time, rather than focusing only on average mood changes over time. Thus all available data points are used, not just summary scores. These individual parameters were then used to estimate the sample population parameters. Moreover, because covariates in MRMs may be time-invariant or time-varying, our analyses not only addressed stable individual characteristics (grade, sex) but also estimated any time-related changes in the associations between peer and family support and mood. In the following analyses, peer and family support were examined as independent predictors of mood in separate MRMs.
Our main research questions were tested by examining (a) the main effect relations between support and PA or NA, (b) the interactions of Peer or Family Support × Grade Cohort (8th graders, 10th graders) × Time (baseline, 6 months, 12 months) on PA and NA, and (c) the interactions of Peer and Family Support × Sex and Support × Sex × Time. Smoking status (dichotomized as 0 = nonsmokers) was also included to control for possible confounds due to differences in smoking status between the two cohorts. For each outcome variable, if the interaction terms were nonsignificant, the model was refit excluding the nonsignificant terms.
Compliance and Attrition
Participants provided mood reports for a mean of 33.50 (SD = 9.86) random prompts from the EMA device per person per wave and missed a mean of 5.70 (SD = 5.75) prompts. In total, participants responded to 85% of all random prompts (SD = .14). Furthermore, 89% of the random prompts were answered within 3 min of the signal.
Attrition in this study was minimal. At the final wave (12 months), 507 adolescents (90%) participated in data collection. Analyses verified that there were no significant differences in retention for grade, sex, race or ethnicity, or smoking status, or for baseline reports of daily PA, daily NA, and peer support (effect sizes d ranged from .04 to .10). However, nonparticipation was somewhat higher among students who at baseline reported lower family support, t(553) = 2.50, p = .013, d = .21.
Preliminary Analyses
Descriptive statistics for the outcome variables at all waves for the total sample, and also stratified by grade cohort and sex, are shown in Table 1. As the table reveals, this sample was not very distressed; mean PA ratings were above 6.0 on a 10-point Likert scale, and NA hovered around 2.4 (higher scores reflect greater NA). Examination of the bivariate correlations among the main variables revealed that, in line with expectations, peer support and family support each correlated significantly and positively with PA; for peer support, rs ranged from .15 to .19 across waves (ps < .001), and for family support, rs ranged from .26 to .32 across waves (ps < .001). Each was significantly negatively correlated with daily NA; rs for peer support ranged from −.11 (p < .05) to −.25 (p < .001), and for family support ranged from −.28 to −33 across waves (ps < .001). Thus, with higher levels of peer and family support, adolescents had more positive and less negative overall mood. In addition, peer and family support were modestly but significantly correlated at each wave; rs ranged from .14 to .24 (ps < .001). Wave-to-wave correlations of the peer support and family support measures (rs ranging from .64 to .66 and rs = .73, respectively; ps < .001) suggest stability in support networks over time.
Table 1.
Means and Standard Deviation of Main Variables for the Total Sample and by Age Cohort and Sex
| Total
|
8th Graders
|
10th Graders
|
Boys
|
Girls
|
|||||||||||
|---|---|---|---|---|---|---|---|---|---|---|---|---|---|---|---|
| Variable | N | M | SD | N | M | SD | N | M | SD | N | M | SD | N | M | SD |
| Baseline | |||||||||||||||
| IPPA | 557 | 73.81 | 12.15 | 294 | 72.34 | 12.40 | 263 | 75.57 | 11.64*** | 255 | 68.59 | 12.30 | 302 | 78.23 | 10.13*** |
| FES | 555 | 67.87 | 11.26 | 292 | 68.22 | 11.47 | 263 | 67.48 | 11.02 | 253 | 69.54 | 9.53 | 302 | 66.47 | 12.36** |
| PA | 517 | 6.73 | 1.23 | 271 | 6.84 | 1.26 | 246 | 6.61 | 1.19* | 230 | 6.83 | 1.25 | 287 | 6.66 | 1.21 |
| NA | 517 | 2.44 | 0.97 | 271 | 2.39 | 0.91 | 246 | 2.50 | 1.02 | 230 | 2.42 | 1.02 | 287 | 2.47 | 0.93 |
| 6 Months | |||||||||||||||
| IPPA | 518 | 73.16 | 12.69 | 272 | 72.24 | 12.87 | 246 | 74.18 | 12.43 | 233 | 67.39 | 12.46 | 285 | 77.88 | 10.79*** |
| FES | 519 | 68.60 | 12.00 | 272 | 68.47 | 12.13 | 247 | 68.74 | 11.85 | 234 | 69.15 | 10.99 | 285 | 68.15 | 12.75 |
| PA | 487 | 6.57 | 1.32 | 260 | 6.73 | 1.37 | 227 | 6.38 | 1.23** | 223 | 6.55 | 1.42 | 264 | 6.59 | 1.23 |
| NA | 487 | 2.40 | 1.07 | 260 | 2.33 | 1.04 | 227 | 2.47 | 1.11 | 223 | 2.45 | 1.17 | 264 | 2.35 | 0.98 |
| 12 Months | |||||||||||||||
| IPPA | 505 | 73.41 | 12.85 | 265 | 72.54 | 13.37 | 240 | 74.37 | 12.21 | 226 | 67.78 | 12.99 | 279 | 77.97 | 10.78*** |
| FES | 505 | 68.35 | 11.97 | 265 | 68.05 | 12.22 | 240 | 68.67 | 11.71 | 227 | 68.99 | 11.16 | 278 | 67.82 | 12.59 |
| PA | 466 | 6.43 | 1.34 | 239 | 6.56 | 1.40 | 227 | 6.28 | 1.27* | 211 | 6.40 | 1.42 | 255 | 6.45 | 1.28 |
| NA | 466 | 2.32 | 1.04 | 239 | 2.27 | 1.02 | 227 | 2.36 | 1.06 | 211 | 2.39 | 1.20 | 255 | 2.25 | 0.88 |
Note: IPPA = Inventory of Parent and Peer Attachment, Peer Support subscale; FES = Family Environment Scale; PA = Daily Positive Affect Scale–Ecological Momentary Assessments; NA = Negative Affect Scale–Ecological Momentary Assessments. P values are for comparisons of 8th graders versus 10th graders and boys versus girls.
p < .05.
p < .01.
p < .001.
The Influences of Peer and Family Support on Daily PA and NA Across Time
For inclusion in the following analyses, participants had to provide both EMA and either family support or peer support data at the same two or more time points. Thus, 508 participants were included in the models evaluating peer support (yielding 48,998 observations to be analyzed each for PA and NA) and 506 participants (yielding 48,892 mood observations) were included in the family support analyses. Although these sample sizes vary slightly, there were no differences found between the two samples on any of the variables included in the models.
Peer support–PA
Results of the final model are presented in Table 2. Consistent with our hypotheses, the Peer Support × Grade Cohort × Time interaction was significant, indicating that time-related changes in the associations of peer support and PA differed by grade cohort. To best illustrate these longitudinal patterns, Figure 1 (top panel) displays the positive relation of peer support and PA over time by means of Pearson correlation at each time point. The correlation reflects the strength of the peer support–PA relation. As the figure reveals, the three-way interaction was driven by changes in the support–PA relations for the eighth-grade cohort over time. The younger cohort had greater increases in the magnitude of the support–PA relation over time than did the older cohort.
Table 2.
Parameter Estimates and Standard Errors From the Final Mixed-Effects Regression Models of Peer Support on Positive Affect and Negative Affect
| Positive Affecta |
Negative Affectb |
|||
|---|---|---|---|---|
| Effect | Estimate | SE | Estimate | SE |
| Intercept | 6.6985*** | .3105 | 2.7912*** | .2285 |
| Time | 0.5257*** | .2015 | 0.1687 | .1536 |
| Sex | .2791 | −0.8468*** | .2019 | |
| Grade Cohort | .4046 | 0.6567* | .2991 | |
| Smoking Status | 0.2125 | .4129 | 0.4637 | .3034 |
| Peer Support | −0.8590* | .0752 | −0.1338* | .0551 |
| Sex × Time | 0.1365* | .0558 | −0.1102* | .0455 |
| Grade Cohort × Time | 0.8042** | .2832 | −0.5771** | .2164 |
| Smoking Status × Time | 0.6827* | .2878 | −0.5713** | .2187 |
| Peer Support × Time | 0.0697 | .0503 | −0.2685 | .0382 |
| Peer Support × Sex | −0.0966 | .0623 | 0.2222*** | .0445 |
| Peer Support × Grade Cohort | 0.1439 | .0946 | −0.1359 | .0698 |
| Peer Support × Smoking Status | 0.2035* | .0961 | −0.0615 | .0703 |
| Peer Support × Cohort × Time | −0.1913** | .0678 | 0.1324* | .0517 |
| Peer Support × Smoke × Time | −0.1826** | .0689 | 0.1246* | .0522 |
Note: N = 508.
χ2(3, N = 508) = 17,161.34, p < .0001.
χ2(3, N = 508) = 51,257.80, p < .0001.
p < .05.
p < .01.
p < .001.
Figure 1.
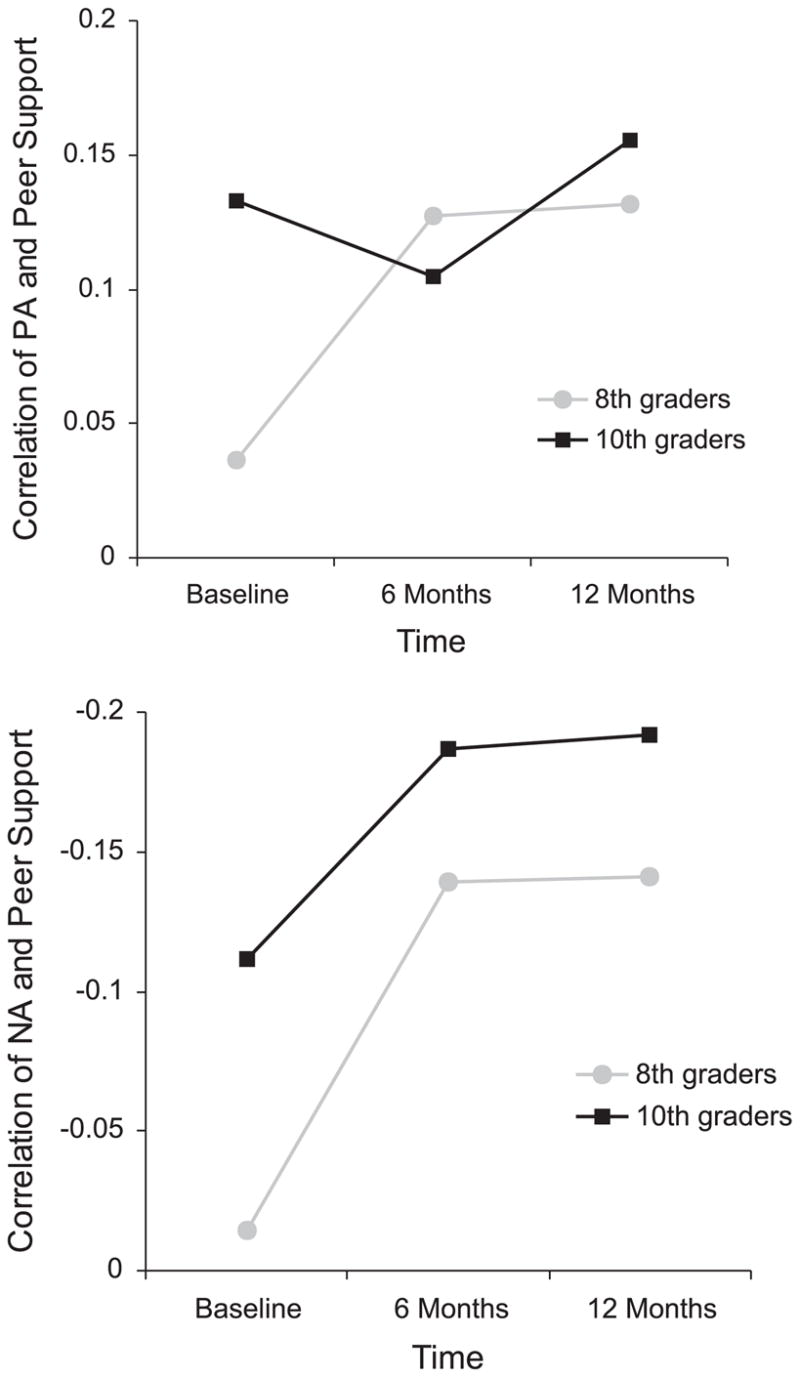
Pearson correlation coefficients between peer support and PA over time as a function of grade cohort (top panel). Pearson correlation coefficients between peer support and NA over time as a function of grade cohort (bottom panel).
Follow-up comparisons conducted on the correlation coefficients of peer support and PA over time for each cohort using Fisher’s r to z transformation (Cohen & Cohen, 1983) confirmed that the support–PA relation was significantly stronger for the older cohort at baseline, z = − 6.14, p < .0001. Across time, these values converged: Correlation coefficients at 6 and 12 months did not significantly differ by cohort, z = 1.46, ns, and z = −1.56, ns, respectively. Further, for the younger cohort, the relation between peer support and PA by 12 months (approximately mid-9th grade) was nearly as strong as that of the older cohort at baseline (10th grade). Thus, the positive peer support–PA relation strengthened across Grades 8 to 9 but remained consistent across Grades 10 to 11. Last, the interactions with sex were not significant, indicating that the associations of peer support and PA did not differ for boys and girls.
Peer support–NA
An initial MRM as described previously was next evaluated for NA, and results of the final model are presented in Table 2. As with PA, developmental trends were again evident, as indicated by the significant Peer Support × Grade Cohort × Time interaction. That is, the peer support–NA associations over time differed for the younger and older cohorts. To illustrate this relation, the Pearson correlation coefficients between peer support and NA by grade cohort over time are shown in Figure 1 (bottom panel). As the figure reveals, negative relations between peer support and NA increased across time for all adolescents. However, these changes were greater for the younger cohort as compared to the older cohort. As the younger cohort transitioned from middle school to high school, peer support became increasingly important to NA such that by 12 months (9th grade), the relation for the younger cohort was as strong as the 10th graders at baseline. For the older cohort, the support–NA relation was stronger at baseline and continued to increase over time.
Comparisons of the correlation coefficients between peer support and NA for each cohort confirmed that differences at baseline were significant, z = 6.15, p < .0001. Additionally, the support–NA relation was greater for the older cohort at 6 months, z = 3.09, p = .002, and 12 months, z = 3.38, p = .0007. Therefore, the peer support–NA relation was consistently stronger for the older cohort as compared to the younger cohort. Moreover, peer support increasingly influenced NA across the high school period. Nonetheless, the significant three-way interaction indicated that changes in the peer support–NA relation over time were significantly more dramatic for the younger cohort than for those already in senior high school.
Results also revealed a significant Peer Support × Sex interaction, indicating that the overall peer support–NA relation varied by sex. Girls exhibited higher levels of negative moods at lower levels of peer support relative to the boys. The association of peer support and NA was consistently stronger for girls over time, as time trends did not vary by sex (i.e., the Peer Support × Sex × Time interaction was not significant in the initial model).
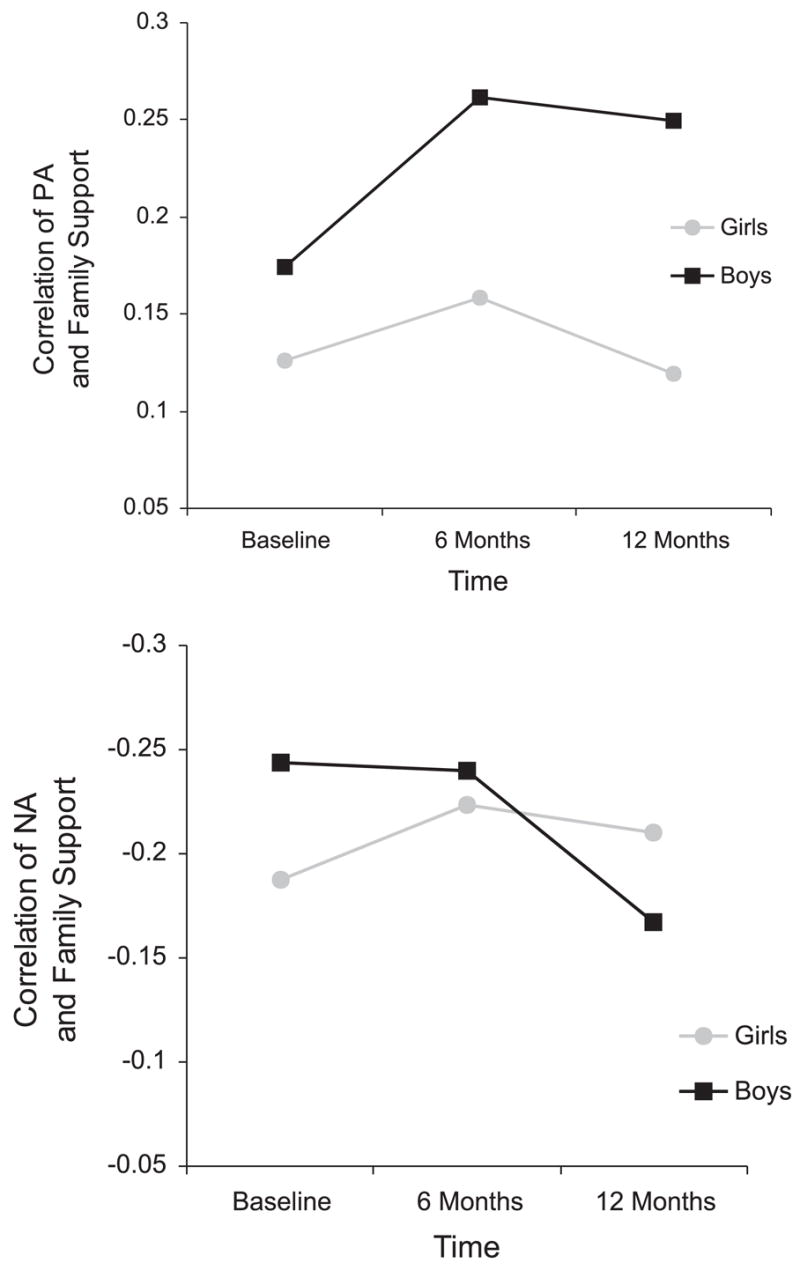
Family support–PA
Consistent with our predictions, the pattern of associations for family support across adolescence differed from the trends seen with peer support. Results of the initial model evaluated for family support on PA indicated that the Family Support × Grade Cohort × Time interaction was not significant. The model was rerun excluding this interaction, and Table 3 lists the results of the final model. As can be seen from the table, the Family Support × Grade Cohort interaction was also not significant. However, results revealed that the overall family support–PA relation was moderated by sex (Peer Support × Sex interaction). Figure 2 (top panel) depicts the longitudinal relation between family support and PA by sex and reveals that, contrary to the results found for peers, the relation between family support and PA was consistently greater for boys than for girls. Thus, family support had stronger associations with boys’ positive mood.
Table 3.
Parameter Estimates and Standard Errors from the Final Mixed-Effects Regression Models of Family Support on Positive Affect and Negative Affect
| Positive Affecta |
Negative Affectb |
|||
|---|---|---|---|---|
| Effect | Estimate | SE | Estimate | SE |
| Intercept | 5.6776*** | .2986 | 3.5842*** | .2581 |
| Time | −0.1868 | .1471 | −0.1741 | .1820 |
| Sex | 0.6652* | .3105 | −0.6240* | .3116 |
| Grade Cohort | −0.2091 | .3221 | −0.3046 | .2354 |
| Smoking Status | −0.7503* | .3111 | 1.7936*** | .2257 |
| Family Support | 0.0176*** | .0039 | −0.0186*** | .0035 |
| Sex × Time | 0.1010* | .0514 | −0.6110** | .2224 |
| Grade Cohort × Time | −0.0029 | .0523 | −0.0317 | .0439 |
| Smoking Status × Time | −0.0757 | .0565 | −0.0380 | .0473 |
| Family Support × Time | −0.0004 | .0020 | −0.002 | .0026 |
| Sex × Grade Cohort | −0.0816 | .2026 | −0.1202 | .1579 |
| Family Support × Sex | −0.0098* | .0040 | 0.0091* | .0042 |
| Family Support × Grade Cohort | 0.0002 | .0041 | 0.0072* | .0029 |
| Family Support × Smoking Status | 0.0112** | .0043 | −0.0250*** | .0031 |
| Family Support × Sex × Time | — | — | 0.0078* | .0032 |
Note: N = 506.
χ2(3, N = 506) = 16,386.49, p < .0001.
χ2(3, N = 506) = 20,365.76, p < .0001.
p < .05.
p < .01.
p < .001.
Figure 2.
Pearson correlation coefficients between family support and PA over time as a function of sex (top panel). Pearson correlation coefficients between family support and NA over time as a function of sex (bottom panel).
Family support–NA
Results for family support and NA were generally consistent with our prediction. As with PA, the Family Support × Grade Cohort × Time interaction was not significant and was removed. However, results of the final model (presented in Table 3) revealed a significant Family Support × Grade Cohort interaction, suggesting that the overall family support–NA relation varied by grade cohort. More specifically, the family support–affect relation was slightly stronger for the older adolescents when collapsing across time. However, rather than providing evidence of a developmental trend, examination of the correlation between family support and NA for each cohort (r = −.20 for the younger cohort and r = −.21 for the older cohort, aggregating across time) reveals that differences between the two cohorts were not substantial. The final model also revealed a significant Family Support × Sex × Time interaction, indicating differential relations between family support and NA over time for girls versus boys. As illustrated in Figure 2 (bottom panel), the support–NA relation is initially stronger for boys but then declines over time, whereas girls are less variable.
Discussion
This study examined the relations between peer and family support and daily positive and negative mood across eighth grade and into the high school period. Findings confirmed that peer and family support were significantly associated with positive and negative moods but revealed complex longitudinal patterns. Results suggest that higher levels of peer support corresponded with better adolescent mood. Additionally, peers became increasingly important to daily mood for the younger cohort as they crossed a developmental milestone: the transition from middle school to senior high school. However, the relations between peer support and mood were more consistent during the mid high school period, as the rate of positive change in the support–affect relation among the older cohort slowed (for NA) or stabilized (for PA) over time.
These age differences in the emotional consequences of peer support are consistent with research indicating that the intimacy of, and reliance on, peer networks increases in early and middle adolescence (Furman & Buhrmester, 1992), and they corroborate past cross-sectional research demonstrating that the association between friendship intimacy and emotional well-being strengthens with age (Buhrmester, 1990). If, as Sullivan (1953) theorized, friendships satisfy the emergent social needs of the adolescent, peers may become larger stakeholders in an adolescent’s well-being across development.
Moreover, the school transition may be causally related to the observed patterns. Perhaps the navigation of stage-salient tasks accompanying this environmental shift, such as developing one’s identity and forging close romantic and platonic relationships (Masten & Coatsworth, 1998), elevates the emotional status of peers. Additionally, transition-related changes in school size, workload, and expectations may result in an increased reliance on peers as a means of coping. Accordingly, the effects of peer support on well-being may be accentuated during this initial period of adjustment. Although some research has found that significant relations between peers and mental health were confined to the transition period (e.g., Hirsch & DuBois, 1992), our findings suggest that the strengthening of the peer support–mood relation began in the summer prior to high school entry (i.e., during the 6-month wave) and was maintained through 11th grade. Thus, both age-related and environmental factors may contribute to the patterns of change in this study.
Family support was also significantly related to adolescent mood. Indeed, the overall family support–affect link was stronger than the peer support–mood relations. However, family support did not display a dynamic relation with adolescent mood over time; rather, the significant associations between family support and mood remained constant during this period of development. Thus, findings suggest that the increased role of peers across the high school period did not replace the emotional support provided by parents. Likewise, increased autonomy and distance from parents across Grades 8 through 11 does not necessarily translate into decreased family influences on mood. Rather, developmental perspectives assert that as adolescents achieve psychological and behavioral autonomy, the parent–adolescent relationship is transformed but not rejected (Steinberg, 2001). Results of this study corroborate those from past studies demonstrating the importance of family support to adolescent mood and depressive symptoms (e.g., Ge et al., 1994; Stice et al., 2004; Windle, 1994), and these findings are consistent with developmental theories that peer support does not supersede the role of parental support until the late adolescent years (Petersen, Sarigiani, & Kennedy, 1991).
Also noteworthy in this study is evidence of sex differences in the support–affect relation. Girls reported higher levels of peer support than boys at every assessment wave. Further, peer support had greater associations with girls’negative mood patterns as compared to boys, regardless of grade cohort. Such findings are interesting given that adolescent girls report greater frequency of peer-related stress than boys (Ge at al., 1994; Larson & Ham, 1993). It is possible that adolescent girls are more susceptible to the protective, mood-enhancing effects as well as the harmful, stress-inducing effects of peers than are boys (e.g., Rose, 2002). In defense of this argument, social support is consistently found to have stronger associations with girls’ mood and depressive symptoms than boys (Slavin & Ranier, 1990; Windle, 1992). However, we found the reverse pattern for family support: Boys reported significantly higher levels of family support than girls at the baseline wave, and family support was a stronger predictor of boys’ positive mood patterns. Tension in the parent–daughter relationship specifically, resulting from an imbalance between girls’ desired versus granted levels of autonomy in adolescence (Rudolph & Hammen, 1999), may account for these sex differences. An alternate explanation is that adolescent girls’ experience greater emotional autonomy from parents than do boys (Steinberg & Silverberg, 1986), thus weakening the affective influences of parental support.
In sum, findings suggest that peer and family support play different roles across development. This complex patterning may have contributed, in part, to the inconsistent findings for peer support in prior work. Rather than having fixed relations with mood, peer support was found to become more important with adolescent development. The high school transition period marked a shift in the influence of peers: In 8th grade, the relation between peers and mood was weak; posttransition, this relation was consistently strong through 11th grade. Thus, previous studies that examined the overall effects of peer support without incorporating the influence of developmental status, or using appropriate statistical techniques to model changes in the influences of variables over time, may have overlooked the dynamic relation between peers and adolescent mood and consequently presented an incomplete picture of peer influences.
These findings also have important implications in terms of the timing and content of prevention and early intervention efforts to promote emotional well-being in adolescence. It has been proposed that periods of reorganization, such as school transitions, are optimal targets for intervention, but more research is needed to determine the effectiveness of such tactics (Hudson, Kendall, Coles, Robin, & Webb, 2002). Results from this study provide preliminary support for early high school as a viable window for intervention. Early high school prevention and intervention programs may address increasing peer networks and utilization of peer support via social skills training or brief therapy focused on interpersonal functioning (e.g., interpersonal therapy for adolescents; Mufson, Dorta, Moreau, & Weissman, 2004).
This investigation extended previous research on the linkages of peer and family support and adolescent mood patterns by using a three-wave longitudinal design, real-time methods of mood assessment, and statistical techniques best suited for longitudinal data. Nonetheless, several study limitations should be noted. First, the method used did not test causal relations between social support and mood, and thus interpretations regarding the affective influences of peer and family support must be made cautiously. Second, this sample was selected based on smoking intentions and experience. This sampling strategy may have reduced the generalizability of the findings because individuals at either end of the continuum of adjustment may have been underrepresented. The largest segment of the adolescent sample that was not included in the study was the nonsusceptible nonsmokers (i.e., youth who were clear in their intentions not to smoke in the next year), who comprised approximately 33% of the population screened. However, over the course of the study, the participants fell into all categories of smokers (e.g., from those who never smoked and became “nonsusceptible” to regular smokers), and this increases the potential representativeness of the sample. Moreover, levels of depressive mood within this sample as assessed via the Children’s Depression Inventory (Kovacs, 1985; for details, see Weinstein et al., in press) was comparable to those found in a recent meta-analysis of nonclinical adolescent samples (Twenge & Nolen-Hoeksema, 2002). Furthermore, efforts were taken to statistically control for the effects of smoking status on outcome measures in the analyses.
Generalizability of these findings is also limited by the moderately low participation rate. This rate is comparable to that of other studies employing real-time methods of data assessment (Larson et al., 2002; Silk et al., 2003) and may suggest differences in those adolescents motivated to participate in this type of research. However, few demographic differences were found between participants and nonparticipants in the study, suggesting that the sample may slightly but not dramatically underrepresent boys and minority youth. Overall, given the small percentages of non-White participants, findings may not generalize to other populations. Additionally, although support–mood relations were examined across Grades 8 to 11, the same adolescents were not followed across this entire period. As such, we cannot completely rule out cohort differences in the effects of support over time.
This study identified family and peer support as predictors of adolescent moods but did not investigate the transactional nature of social support and mood. It is possible that the worsening of mood during the high school period negatively influences peer and family relationships, reducing the support derived from these networks. In a cyclical fashion, this chain of influence may exacerbate mood declines (DuBois et al., 1992; Stice et al., 2004). Thus, although not tested in this study, the bidirectional nature of the support–mood relation across adolescence remains an area for future research.
Acknowledgments
This research was supported by Grant CA80266 from National Cancer Institute and a grant from the Tobacco Etiology Research Network, funded by Robert Wood Johnson Foundation.
Contributor Information
Sally M. Weinstein, Department of Psychology and Institute for Health Research and Policy, University of Illinois at Chicago
Robin J. Mermelstein, Department of Psychology and Institute for Health Research and Policy, University of Illinois at Chicago
Donald Hedeker, School of Public Health, University of Illinois at Chicago.
Benjamin L. Hankin, Department of Psychology, University of South Carolina
Brian R. Flay, Department of Public Health, Oregon State University
References
- Armsden GC, Greenberg MT. The inventory of parent and peer attachment: Individual differences and their relationship to psychological well-being in adolescence. Journal of Youth & Adolescence. 1987;16:427–454. doi: 10.1007/BF02202939. [DOI] [PubMed] [Google Scholar]
- Berndt TJ. Friends’ influence on students’ adjustment to school. Educational Psychologist. 1999;34:15–29. [Google Scholar]
- Bloom JR, Spiegel D. The relationship of two dimensions of social support to the psychological well-being and social functioning of women with advanced breast cancer. Social Science and Medicine. 1984;19:831–837. doi: 10.1016/0277-9536(84)90400-3. [DOI] [PubMed] [Google Scholar]
- Buhrmester D. Intimacy of friendship, interpersonal competence, and adjustment during preadolescence and adolescence. Child Development. 1990;61:1101–1111. [PubMed] [Google Scholar]
- Burton E, Stice E, Seeley JR. A prospective test of the stress-buffering model of depression in adolescent girls: No support once again. Journal of Consulting & Clinical Psychology. 2004;72:689–697. doi: 10.1037/0022-006X.72.4.689. [DOI] [PubMed] [Google Scholar]
- Cohen J, Cohen P. Applied multiple regression/correlation analysis for the behavioral sciences. Hillsdale, NJ: Lawrence Erlbaum Associates, Inc; 1983. [Google Scholar]
- Diviak KR, Kohler SL, O’Keefe JJ, Mermelstein RJ, Flay B. Recruitment and retention of adolescents in a smoking trajectory study: Who participates and lessons learned. Substance Use & Misuse. 2006;41:175–182. doi: 10.1080/10826080500391704. [DOI] [PubMed] [Google Scholar]
- DuBois DL, Burk-Braxton C, Swenson LP, Tevendale HD, Lockerd EM, Moran B. Getting by with a little help from self and others: Self-esteem and social support as resources during early adolescence. Developmental Psychology. 2002;38:822–839. doi: 10.1037//0012-1649.38.5.822. [DOI] [PubMed] [Google Scholar]
- DuBois D, Felner R, Brand S, Adan A, Evans E. A prospective study of life stress social support, and adaptation in early adolescence. Child Development. 1992;63:542–557. doi: 10.1111/j.1467-8624.1992.tb01645.x. [DOI] [PubMed] [Google Scholar]
- Fuhrman W, Buhrmester D. Age and sex differences in perceptions of networks of personal relationships. Child Development. 1992;63:103–115. doi: 10.1111/j.1467-8624.1992.tb03599.x. [DOI] [PubMed] [Google Scholar]
- Ge X, Lorenz FO, Conger RD, Elder GH, Jr, Simons RL. Trajectories of stressful life events and depressive symptoms in adolescence. Developmental Psychology. 1994;30:467–483. [Google Scholar]
- Helsen M, Vollebergh W, Meeus W. Social support from parents and friends and emotional problems in adolescence. Journal of Youth & Adolescence. 2000;29:319–335. [Google Scholar]
- Hirsch B, DuBois D. The relation of peer social support and psychological symptomatology during the transition to junior high school: A two-year longitudinal analysis. American Journal of Community Psychology. 1992;20:333–347. doi: 10.1007/BF00937913. [DOI] [PubMed] [Google Scholar]
- Hu FB, Flay BR, Hedeker D, Siddiqui O, Day LE. The influences of friends’ and parental smoking on adolescent smoking behavior: The effects of time and prior smoking. Journal of Applied Social Psychology. 1995;25:2018–2047. [Google Scholar]
- Hudson JL, Kendall PC, Coles ME, Robin JA, Webb A. The other side of the coin: Using intervention research in child anxiety disorders to inform developmental psychopathology. Development and Psychopathology. 2002;14:819–841. doi: 10.1017/s095457940200408x. [DOI] [PubMed] [Google Scholar]
- Jamner LD, Whalen CK, Loughlin SE, Mermelstein R, Audrain-McGovern J, Krishnan-Sarin S, et al. Tobacco use across the formative years: A road map to developmental vulnerabilities. Nicotine and Tobacco Research. 2003;5:71–87. doi: 10.1080/14622200310001625573. [DOI] [PubMed] [Google Scholar]
- Kovacs M. The Children’s Depression Inventory (CDI) Psychopharmacological Bulletin. 1985;21:995–998. [PubMed] [Google Scholar]
- Laird NM, Ware JH. Random-effects models for longitudinal data. Biometrics. 1982;38:963–974. [PubMed] [Google Scholar]
- Larson R, Ham M. Stress and “storm and stress” in early adolescence: The relationship of negative events with dysphoric affect. Developmental Psychology. 1993;29:130–140. [Google Scholar]
- Larson RW, Moneta G, Richards M, Wilson S. Continuity, stability and change in daily emotional experience across adolescence. Child Development. 2002;73:1151–1165. doi: 10.1111/1467-8624.00464. [DOI] [PubMed] [Google Scholar]
- Larson R, Richards MH. Daily companionship in late childhood and early adolescence: Changing developmental contexts. Child Development. 1991;62:284–300. doi: 10.1111/j.1467-8624.1991.tb01531.x. [DOI] [PubMed] [Google Scholar]
- Larson R, Richards MH, Moneta G, Holmbeck G, Duckett E. Changes in adolescents’ daily interactions with their families from ages 10 to 18: Disengagement and transformation. Developmental Psychopathology. 1996;32:744–754. [Google Scholar]
- Lewinsohn PM, Roberts RE, Seeley JR, Rohde P, Gotlib IH, Hops H. Adolescent psychopathology: II. Psychosocial risk factors for depression. Journal of Abnormal Psychology. 1994;103:302–315. doi: 10.1037//0021-843x.103.2.302. [DOI] [PubMed] [Google Scholar]
- Masten AS, Coatsworth JD. The development of competence in favorable and unfavorable environments: Lessons from research on successful children. American Psychologist. 1998;53:205–220. doi: 10.1037//0003-066x.53.2.205. [DOI] [PubMed] [Google Scholar]
- McGee R, Williams S, Silva PA. Behavioral and developmental characteristics of aggressive, hyperactive and aggressive-hyperactive boys. Journal of the American Academy of Child Psychiatry. 1984;23:270–279. doi: 10.1016/s0002-7138(09)60502-1. [DOI] [PubMed] [Google Scholar]
- Moos RH, Moos BS. Family Environment Scale manual. 3. Palo Alto, CA: Consulting Psychologists; 1994. [Google Scholar]
- Mufson L, Dorta KP, Moreau D, Weissman MM. Interpersonal psychotherapy for depressed adolescents. New York: Guilford; 2004. [Google Scholar]
- Petersen AC, Sarigiani PA, Kennedy RE. Adolescent depression: Why more girls? Journal of Youth & Adolescence. 1991;20:247–271. doi: 10.1007/BF01537611. [DOI] [PubMed] [Google Scholar]
- Rose AJ. Co-rumination in the friendships of girls and boys. Child Development. 2002;73:1830–1843. doi: 10.1111/1467-8624.00509. [DOI] [PubMed] [Google Scholar]
- Rudolph KD, Hammen C. Age and gender as determinants of stress exposure, generation, and reactions in youngsters: A transactional perspective. Child Development. 1999;70:660–677. doi: 10.1111/1467-8624.00048. [DOI] [PubMed] [Google Scholar]
- Silk JS, Steinberg L, Morris A. Adolescents’ emotion regulation in daily life: Links to depressive symptoms and problem behavior. Child Development. 2003;74:1869–1880. doi: 10.1046/j.1467-8624.2003.00643.x. [DOI] [PubMed] [Google Scholar]
- Slavin LA, Rainer K. Sex differences in emotional support and depressive symptoms among adolescents: A prospective analysis. American Journal of Community Psychology. 1990;18:407–421. doi: 10.1007/BF00938115. [DOI] [PubMed] [Google Scholar]
- Steinberg L. We know some things: Parent–child relationships in retrospect and prospect. Journal of Research on Adolescence. 2001;11:1–19. [Google Scholar]
- Steinberg L, Silverberg SB. The vicissitudes of autonomy in early adolescence. Child Development. 1986;57:847–851. doi: 10.1111/j.1467-8624.1986.tb00250.x. [DOI] [PubMed] [Google Scholar]
- Stice E, Ragan J, Randall P. Prospective relations between social support and depression: Differential direction of effects for parent and peer support? Journal of Abnormal Psychology. 2004;113:155–159. doi: 10.1037/0021-843X.113.1.155. [DOI] [PubMed] [Google Scholar]
- Stone AA, Shiffman S. Ecological momentary assessment (EMA) in behavioral medicine. Annals of Behavioral Medicine. 1994;16:199–202. [Google Scholar]
- Sullivan HS. The interpersonal theory of psychiatry. New York: Norton; 1953. [Google Scholar]
- Twenge J, Nolen-Hoeksema S. Age, sex, race, socioeconomic status, and birth cohort differences on the children’s depression inventory: A meta-analysis. Journal of Abnormal Psychology. 2002;111:578–588. doi: 10.1037//0021-843x.111.4.578. [DOI] [PubMed] [Google Scholar]
- Watson D, Tellegen A. Toward a consensual structure of mood. Psychological Bulletin. 1985;98:219–235. doi: 10.1037//0033-2909.98.2.219. [DOI] [PubMed] [Google Scholar]
- Weinstein SM, Mermelstein RJ, Hankin BL, Hedeker D, Flay BR. Longitudinal patterns of daily affect and global mood during adolescence. Journal of Research on Adolescence. doi: 10.1111/j.1532-7795.2007.00536.x. in press. [DOI] [PMC free article] [PubMed] [Google Scholar]
- Whalen CK, Jamner LD, Henker B, Delfino RJ. Smoking and moods in adolescents with depressive and aggressive dispositions: Evidence from surveys with electronic diaries. Health Psychology. 2001;20:99–111. [PubMed] [Google Scholar]
- Windle M. A longitudinal study of stress buffering for adolescent problem behaviors. Developmental Psychology. 1992;28:522–530. [Google Scholar]