

SUMMARY
Metabolic and inflammatory pathways crosstalk at many levels and while required for homeostasis, interaction between these pathways can also lead to metabolic dysregulation under conditions of chronic stress. Thus, we hypothesized that mechanisms might exist to prevent overt inflammatory responses during physiological fluctuations in nutrients or under nutrient-rich conditions, and identified the six-transmembrane protein STAMP2 as a critical modulator of this integrated response system of inflammation and metabolism in adipocytes. Lack of STAMP2 in adipocytes results in aberrant inflammatory responses to both nutrients and acute inflammatory stimuli. Similarly, in whole animals, visceral adipose tissue of STAMP2-/- mice exhibits overt inflammation, and these mice develop spontaneous metabolic disease on a regular diet, manifesting insulin resistance, glucose intolerance, mild hyperglycemia, dyslipidemia, and fatty liver disease. We conclude that STAMP2 has a novel role in integrating inflammatory and metabolic responses, and thus plays a key role in systemic metabolic homeostasis.
INTRODUCTION
Cells and organisms must strike an appropriate balance between nutrient sufficiency and surplus. Adequate amounts of nutrients must be obtained in order to survive and function normally. On the other hand, chronic nutrient overload can lead to obesity, as well as to an array of associated metabolic disorders, including insulin resistance, hepatosteatosis, type 2 diabetes and cardiovascular disease. This cluster of chronic diseases now constitutes the largest global health threat.
In the past decade, it has been clearly recognized that metabolic disease, particularly obesity and diabetes, has strong inflammatory underpinnings (Wellen and Hotamisligil 2005; Hotamisligil 2006). For example, obesity is associated with a state of chronic low-grade inflammation, and insulin action can be inhibited by several inflammatory signaling molecules, including the JNK, IKK and SOCS family proteins (Emanuelli et al. 2000; Mooney et al. 2001; Yuan et al. 2001; Hotamisligil 2006). Experiments with loss of function mouse models have demonstrated the central role of these inflammatory pathways in metabolic diseases (Yuan et al. 2001; Hirosumi et al. 2002; Howard et al. 2004; Arkan et al. 2005; Cai et al. 2005). Inflammatory signaling pathways can be activated in obesity both by cytokines such as TNFα, as well as by nutrients such as lipids and glucose, particularly when blood or cellular levels are chronically elevated (Brownlee 2001; Hotamisligil 2006).
Given the potential for nutrients to stimulate inflammatory pathways and the importance of keeping these pathways in check, we hypothesized that previously unrecognized counter-regulatory mechanisms might exist to protect cells from activation of inflammatory pathways during physiological fluctuations in nutrient exposure or in nutrient-rich conditions. We reasoned that a factor participating in such a coordinating mechanism between nutrient and inflammatory responses would be expected to meet several criteria: 1) The gene product should be present in tissue types responsible for nutrient clearance from blood, such as adipose tissue. 2) Expression or activity should be regulated by both nutritional and inflammatory stimuli. 3) The factor should regulate inflammatory signaling components and/or gene expression. Cells or tissues lacking such a factor would then exhibit excess or prolonged inflammation in response to challenges by both nutrients and inflammatory mediators. 4) The factor should regulate cellular metabolism, and its absence should result in impaired cellular metabolic function. 5) Through regulation of metabolic function in particular cell-types and organs, the factor should also impact systemic metabolism.
In this study, we identify six-transmembrane protein of prostate 2 (STAMP2) as a novel factor meeting these criteria. STAMP2, also known as TNF-induced adipose related protein (TIARP) or six transmembrane epithelial antigen of prostate 4 (STEAP4), belongs to a family of six transmembrane proteins, termed either the STAMP or STEAP family (Moldes et al. 2001; Korkmaz et al. 2005; Ohgami et al. 2006). Three of the four family members, including STAMP2, have recently been characterized as metalloreductases playing a role in cellular import of iron and copper (Ohgami et al. 2006). Here, we report that STAMP2 coordinates inflammatory responses with metabolic function in adipocytes and is essential for maintenance of systemic metabolic homeostasis.
RESULTS
Regulation of STAMP2 expression in cultured adipocytes and adipose tissue
In attempts to identify factors that might participate in coordinated regulation of metabolism and inflammation, we first performed a screen for genes differentially regulated in obese mice 1) lacking a key inflammatory molecule, TNFα, or receptors responsible for TNF action or 2) treated with insulin-sensitizing thiazolidinedione (TZD) drugs (Wellen et al. 2004). We then narrowed our focus to genes that are exclusive to or highly enriched in adipose tissue and identified STAMP2 as a candidate molecule. Adipose tissue STAMP2 expression was reduced in obese animals either deficient in TNFα function or treated with TZD, demonstrating that STAMP2 is regulated by TNFα in vivo (Fig. 1a). Consistent with our findings, previous reports have demonstrated that STAMP2 is expressed in adipocytes in vitro and regulated by cytokines (Moldes et al. 2001; Fasshauer et al. 2004). To further explore the regulation of STAMP2, we examined its expression in mouse tissues and in cultured adipocytes during differentiation. STAMP2 is expressed in white adipose tissue (WAT) at more abundant levels than any other tissue examined (Fig. 1b). In addition, STAMP2 expression was absent in preadipocytes but strongly induced during adipocyte differentiation in 3T3-L1 cells, in agreement with earlier studies (Moldes et al. 2001) (Fig. 1c). In adipose tissue, the principal source of STAMP2 expression was also found in mature adipocytes although a low level expression was detected in the stromal-vascular fraction (Fig. 1d).
Figure 1. Regulation of STAMP2 expression.
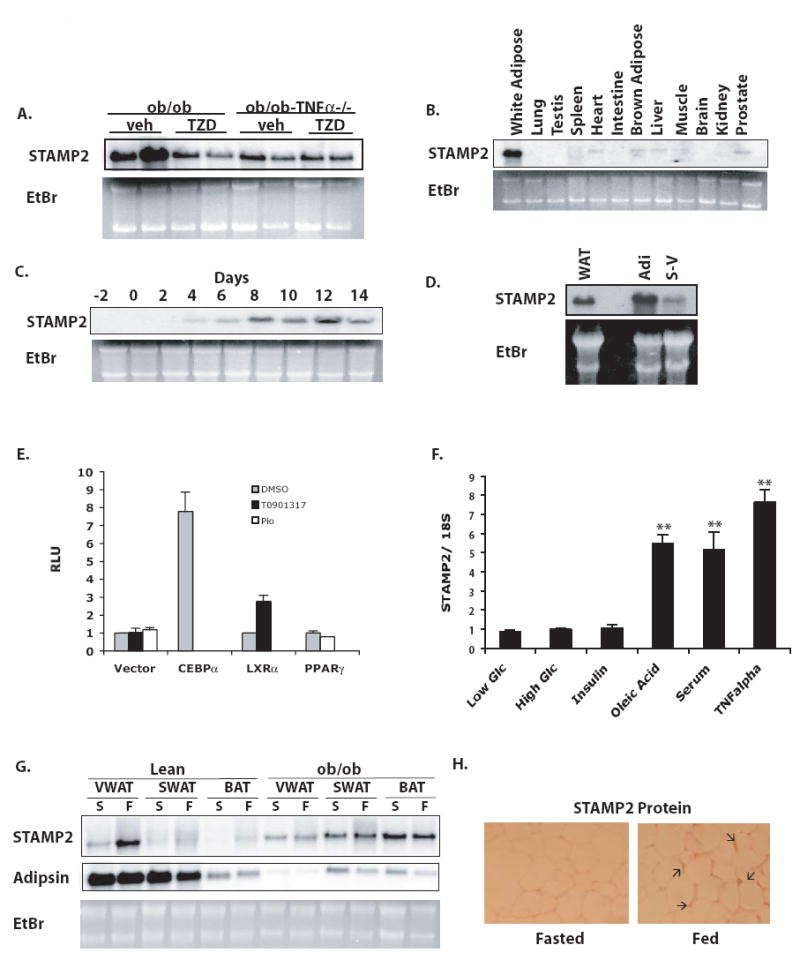
(A) Regulation of adipose tissue STAMP2 mRNA expression in ob/ob and ob/ob-TNF α-/- treated with vehicle or thiazolidinediones, assessed by Northern blot. (B) Northern blot showing tissue distribution of STAMP2 mRNA in wt mice. (C) STAMP2 expression by Northern blot during differentiation of 3T3-L1 preadipocytes into adipocytes. (D) STAMP2 expression in adipocyte and stromal-vascular fractions of adipose tissue. (E) Activation of the STAMP2 promoter. Responsiveness of the −2kb STAMP2 promoter to transcription factors CEBPα, LXRα, and PPARγ was analyzed by luciferase reporter assays in HeLa cells. T0901317 is a synthetic LXR agonist and pioglitazone (Pio) is an agonist of PPARγ. (F) Regulation of STAMP2 expression in response to 4mM or 25 mM glucose or 6-hour treatments of 100 nM insulin, 300 μM oleic acid, 20% serum, or 10 ng/ml TNFα, assessed by quantitative RT-PCR (qPCR). Data indicates mean ± s.e.m. ** p<0.005. (G) Regulation of STAMP2 expression by in WAT in fed and fasted conditions (Northern blot). (F=Fed; S=Starved). (H) Immunostaining for adipose-tissue STAMP2 protein in fed and fasted mice in samples from viscerol depot.
Adipocyte differentiation is predominantly coordinated by PPARγ and C/EBP family member transcription factors, with PPARγ and C/EBPα engaging in a positive feedback loop to drive differentiation forward (Rosen et al. 2000). Since STAMP2 expression is induced during differentiation, we asked whether one or both of these adipogenic transcription factors might control STAMP2 expression. While no portion of the 2kb 5’ promoter sequences that we examined responded to PPARγ even in the presence of synthetic agonists, STAMP2 promoter activity was strongly induced by CEBPα (Fig. 1e). Interestingly, we found that the promoter was also responsive to LXRα, another transcription factor implicated in adipocyte gene expression, although this was smaller in magnitude compared to CEBPα (Fig. 1e). Since PPARγ does not appear to directly regulate the STAMP2 promoter, it is likely that reduced expression of STAMP2 seen in the TZD-treated ob/ob WAT is indirect (Fig. 1a). Together, these results establish STAMP2 as a differentiation-dependent molecule present in adipocytes in vitro and in vivo, thus fullfilling our first criterion.
In our model, we have postulated that regulatory molecules would respond to nutritional status and inflammatory signals. To investigate whether STAMP2 expression is regulated by nutritional conditions in vitro, we treated 3T3-L1 adipocytes with various stimuli and examined STAMP2 expression. While glucose and insulin treatments alone produced minimal regulation of STAMP2 expression in adipocytes, high serum and fatty acids markedly induced STAMP2 levels (Fig. 1f). Similarly, treatment with TNFα increased STAMP2 levels in adipocytes to levels comparable to or higher than those obtained by these nutritional stimuli (Fig. 1f).
We next sought to determine whether fluctuations in nutritional status would also result in regulation of STAMP2 expression in adipose tissue depots in vivo. To that end, we examined STAMP2 expression during feeding and fasting in lean as well as genetically obese, leptin-deficient (ob/ob) mice. In lean mice, STAMP2 expression, was elevated in the fed as compared to fasted state, particularly in visceral adipose depot (VWAT), a site often considered as the most relevant depot for metabolic pathologies (Fig. 1g) (Despres and Lemieux 2006). STAMP2 protein levels, as assessed by immunohistochemistry, correlated with the RNA levels (Fig. 1h). In ob/ob mice, however, nutritional regulation of STAMP2 expression was completely lost (Fig. 1g). A similar loss of nutritional regulation was also observed in high-fat diet-induced obesity (Supplementary Fig. 1). Thus, STAMP2 expression is responsive to both nutritional and inflammatory signals both in cultured adipocytes and adipose tissue.
Aberrant inflammatory and metabolic responses in the absence of STAMP2 in vitro
To investigate whether STAMP2 has a direct role in modulating inflammation in adipocytes, we utilized RNAi to reduce STAMP2 expression in 3T3-L1 adipocytes. After administration of siRNA, we confirmed efficient (≥80%) knockdown of STAMP2 mRNA expression (Fig. 2a). Protein levels, as assessed by immunofluorescence analysis, were reduced (Figure 2b). Finally, we demonstrate by Western blot that Flag-tagged STAMP2 exogenously expressed in adipocytes can be almost entirely suppressed using this siRNA-based experimental system (Fig. 2c).
Figure 2. STAMP2 deficiency results in elevated inflammatory gene expression and reduced insulin action in cultured adipocytes.
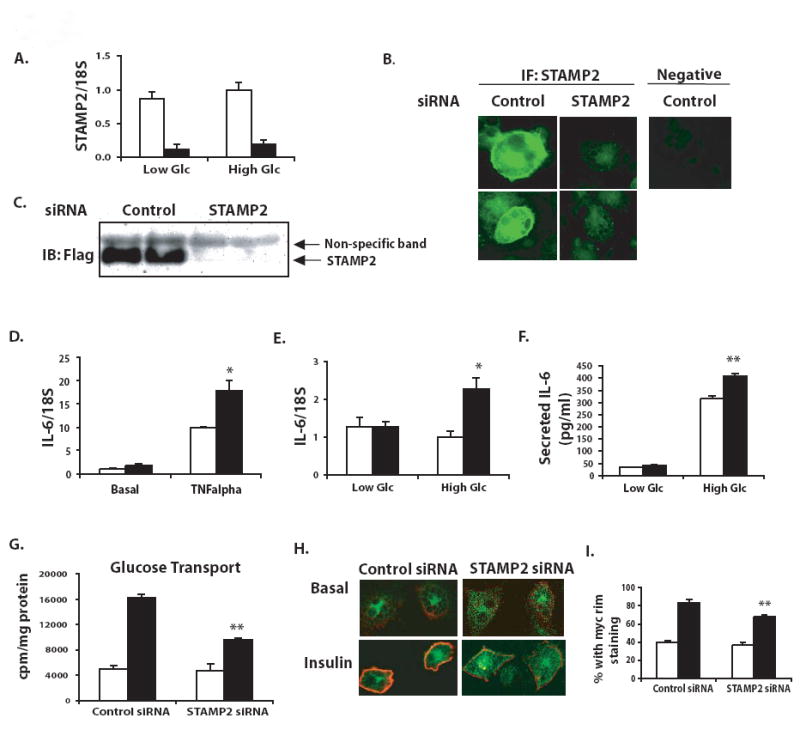
(A) Efficient knockdown of STAMP2 mRNA confirmed by qPCR following electroporation of control and STAMP2-specific siRNAs into 3T3-L1 adipocytes under low and high glucose (Glc). (B) Knockdown of STAMP2 protein confirmed by immunofluorescence. (C) Knockdown of Flag-STAMP2 expressed in 3T3-F442A adipocytes confirmed by Western blot analysis. (D) IL-6 expression measured by qPCR after overnight incubation in high glucose serum-free medium, and stimulation with TNFα (10 ng/ml, 6h). (E) IL-6 expression in adipocytes in high and low glucose conditions (F) IL-6 secretion measured by ELISA in cell supernatants collected under the same conditions as panel E. (G) Insulin-stimulated 3H-2-deoxyglucose uptake in cultured adipocytes upon suppression of STAMP2 (H) Insulin stimulated myc-Glut4-GFP translocation to the plasma membrane assessed by immunocytochemistry and confocal microscopy (I) Quantitation of experiments shown in panel H in 3 independent experiments. Data represents mean ± s.e.m. Open bars-control siRNA; closed bars-STAMP2 siRNA. * indicates p<0.05; ** indicates p<0.005.
Next, we examined expression of inflammatory cytokine production in adipocytes, in the presence of either inflammatory (TNFα stimulation) or nutritional (hyperglycemic) challenges. Upon treatment with TNFα, we observed significantly greater induction of IL-6 expression in STAMP2-knockdown versus control cells (Fig. 2d). When cultured in a physiological low glucose medium, STAMP2 knockdown and control cells expressed similar amounts of interleukin-6 (IL-6) mRNA. However, in high glucose conditions, STAMP2-deficient cells expressed approximately twice as much IL-6 mRNA as control cells (Fig. 2e). We also measured secretion of IL-6 protein, and found that in high glucose conditions, IL-6 secretion was indeed augmented in the absence of STAMP2 (Fig. 2f). Interestingly, this effect appears to be somewhat selective, as other TNFα-regulated genes, such as MCP-1 and IL-1β, as well as the TNFR1 and TNFR2, were not differentially regulated in these conditions (data not shown).
Abnormal inflammatory activity might be expected to negatively influence metabolic homeostasis. To address this possibility, we examined insulin action in 3T3-L1 adipocytes transfected with STAMP2-specific or control siRNA. Indeed, STAMP2 deficiency resulted in moderate but consistent impairment of insulin-stimulated glucose transport in adipocytes (Fig. 2g). We then assessed whether this is due to alterations in the insulin-induced translocation of the glucose transporter Glut4 to the plasma membrane in the absence of STAMP2. An ectopically expressed Glut4 (tagged with a myc epitope in the first exofacial loop as well as GFP, for tracking) exhibited reduced insulin-stimulated translocation to the plasma membrane in the absence of STAMP2 (Fig. 2h). This reduction was significant when STAMP-deficient cells with detectable Glut4 translocation were quantitated compared to controls (Fig. 2i). We also examined the insulin receptor signaling pathway. In control cells, insulin stimulation results in dose dependent increases in the tyrosine phosphorylation of insulin receptor and serine phosphorylation of Akt. In STAMP2-deficient cells, the effects of insulin were modestly but significantly reduced (Supplementary Fig. 2a). These results indicate that STAMP2 deficiency impairs insulin action and disrupts glucose transport in adipocytes.
Increased inflammation and reduced insulin action in the genetic absence of STAMP2 in vivo
To confirm the function of STAMP2 in regulating adipose tissue inflammation and metabolism in vivo, we examined mice with homozygous targeted null mutations in the STAMP2 locus. We confirmed by Northern blot analysis in adipose tissue that these mice did in fact lack STAMP2 expression (Fig. 3a). STAMP2-/- mice were fully viable and fertile and reproduced at the expected Mendelian ratios with no visible abnormalities. At 5-6 months of age, wild type and STAMP2-/- mice were sacrificed and tissues harvested for analysis of gene expression, biochemical studies, and histological analysis. In addition to confirming the absence of STAMP2, we also examined expression of the three other STAMP family members for possible compensatory regulation. Interestingly, all of the STAMP family members are expressed in adipose tissue, but only STEAP3 was consistently and significantly upregulated in the absence of STAMP2 (Fig. 3b). On the other hand, STEAP1 and STAMP1 tended to be suppressed in STAMP2-/- VWAT (Fig. 3b).
Figure 3. Adipose tissue of STAMP2-/- mice exhibits elevated expression of inflammatory genes, accumulation of mononuclear cells and oxidative stress.
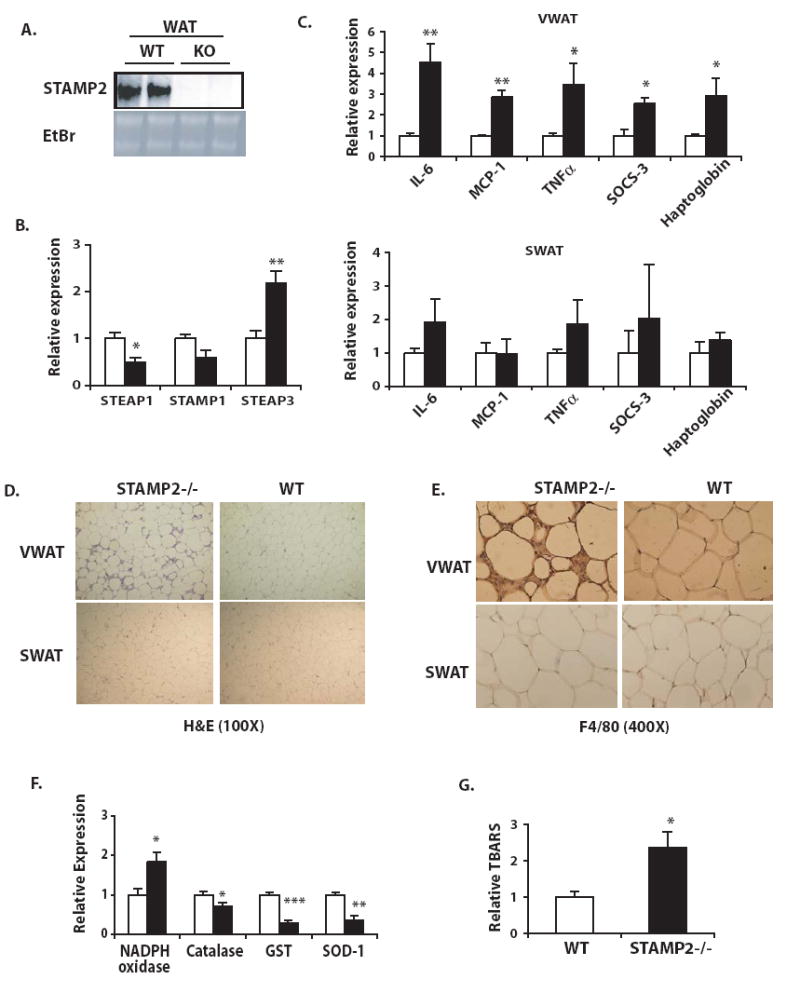
Tissues were harvested from 5- to 6-month-old mice on standard diet. (A) STAMP2 mRNA expression in the adipose tissue of STAMP2-/- (KO) and wild type (WT) mice examined by Northern blot analysis (B) Expression of STAMP family members in VWAT examined by qPCR. (C) Inflammatory gene expression in VWAT and SWAT, examined by qPCR. (Open bars- WT; closed bars-STAMP2-/-). (D) Tissue sections from WT and STAMP2-/- mice were stained with hemotoxylin and eosin (E) F4/80 antigen positivity in WT and STAMP2-/- VWAT, detected by immunohistochemistry (F) Gene expression related to oxidative stress was evaluated in VWAT (open bars- WT; closed bars- STAMP2-/-) (G) Levels of TBARS in VWAT (n=5 animals/ genotype). All data presented as mean ± s.e.m. For all qPCR experiments, 5-6 animals in each genotype were examined, and mRNA expression of each gene was normalized to 18S rRNA levels. * indicates p< 0.05; ** p<0.005; *** p<0.0005.
Next, inflammatory gene expression in both subcutaneous and visceral WAT depots was examined. We found that inflammation due to STAMP2 deficiency was much more pronounced in this in vivo setting compared to that observed in 3T3-L1 adipocytes. In STAMP2-/- animals, expression of multiple inflammatory factors, including IL-6, TNFα, MCP-1, haptoglobin and SOCS-3 were significantly elevated in VWAT (Fig. 3c). In contrast to VWAT, alterations in inflammatory gene expression in SWAT in STAMP2-/- animals were minimal; while there was a trend for higher levels of some genes, these differences were subtle and did not reach statistical significance (Fig. 3c). Thus, the primary site of STAMP2 expression and regulation in vivo coincides with that of marked inflammatory abnormalities in its absence.
The VWAT depot also manifested striking histological differences between STAMP2-/- and WT animals. Though no clear differences in adipocyte cell size were observed, in STAMP2-/- mice, VWAT, but not SWAT, contained markedly increased numbers of mononuclear cells among adipocytes (Fig. 3d). Recent evidence has indicated that adipose tissue, particularly in obesity, can accumulate macrophages (Weisberg et al. 2003; Xu et al. 2003). To test whether the mononuclear cells present in the VWAT of STAMP2-/- mice might be infiltrating macrophages, we tested for the presence of the macrophage-specific antigen F4/80 by immunohistochemistry (Fig. 3e). There was strong staining for F4/80 in the interstitial space between adipocytes in VWAT of most STAMP2-/- animals, suggesting that STAMP2-/- VWAT indeed becomes infiltrated by macrophages, defined as F4/80-positive cells. In contrast, we did not observe noticeable macrophage accumulation in any WT mice. Interestingly, similar to inflammatory gene expression, macrophage infiltration was also seen only in STAMP2-/- VWAT and absent from SWAT (Fig. 3d, e).
Metabolic dysfunction in adipocytes and adipose tissue is frequently associated with oxidative stress (Furukawa et al. 2004; Houstis et al. 2006). We asked whether this might be a potential mechanism involved in the STAMP2-deficient model, and therefore, measured expression of antioxidant genes in adipose tissues. These experiments demonstrated that expression of catalase, glutathione-S-transferase (GST), and superoxide dismutase 1 (SOD1), were significantly reduced in the VWAT of mice lacking STAMP2, whereas NADPH oxidase 1 was significantly upregulated (Fig. 3f). These expression patterns are similar to observations previously reported in obesity (Furukawa et al. 2004). Interestingly, no significant changes were observed in these genes in the subcutaneous adipose tissue (Supplementary Fig. 3a). To test whether STAMP2-/- mice might have increased oxidative stress in VWAT as compared to WT mice, we measured levels of thiobarbituric acid reactive substances (TBARS) as an indicator of lipid peroxidation. Indeed, STAMP2-/- mice displayed significantly higher levels of lipid peroxidation in VWAT than WT mice (Fig. 3g). These results suggest that in the absence of STAMP2, adipose tissue is susceptible to oxidative stress.
If our hypothesis is correct that STAMP2 suppresses inflammation under nutrient-rich conditions, then STAMP2-/- WAT may exhibit increased inflammatory response to a nutritional challenge. To address this possibility, we administered intralipid and glucose into WT and STAMP2-/- mice and examined inflammatory gene expression in adipose tissue compared to saline-treated control mice in both genotypes. Combined administration of glucose and lipid stimulated expression of IL-6 and SOCS-3 in both genotypes, although to a significantly greater extent in the adipose tissue of STAMP2-/- mice (Fig. 4a). These data support the model that even a short-term nutritional challenge can stimulate an inflammatory response in WAT in vivo, and that STAMP2 plays a role in modulating this response. To determine whether STAMP2 is also necessary for metabolic regulation in vivo, we isolated primary adipocytes from WT and STAMP2-/- mice and examined glucose transport. Adipocytes isolated from STAMP2-/- mice exhibited severely defective insulin-stimulated glucose transport. Interestingly, defective glucose uptake was far more profound in the STAMP2-/- adipocytes obtained from the visceral depot, although it was also reduced in subcutaneous adipocytes (Fig. 4b).
Figure 4. Impaired insulin action in the visceral WAT of STAMP2-/- mice.
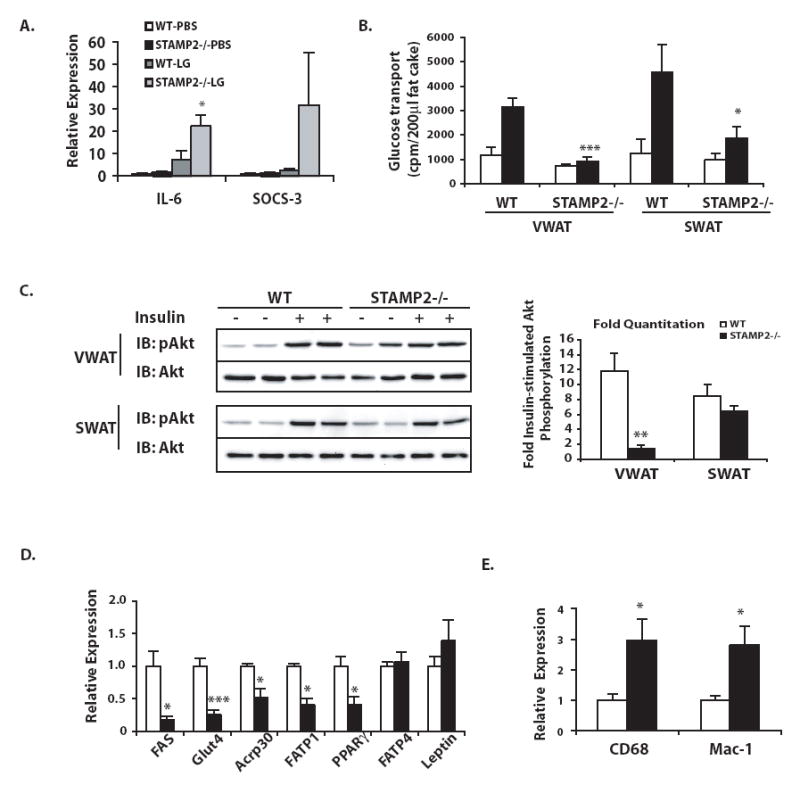
(A) PBS or intralipid and glucose (LG) were injected intraperitoneally into wt and STAMP2-/- mice followed by measurement of IL-6 and SOCS-3 mRNA levels in VWAT by qPCR. Data pooled from 2 independent experiments, shown as mean ± s.e.m. (B) Glucose transport in primary adipocytes. (C) Insulin stimulated Akt phosphorylation in VWAT and SWAT. Representative animals are shown in the Western blot, with each lane representing one animal. Phosphorylation of Akt normalized to total Akt protein was quantified and both absolute (see supplementary figure 3) and fold insulin-stimulated Akt phosphorylation graphed, with data pooled from 2 independent experiments, represented as mean ± s.e.m. Expression of (D) metabolic and (E) macrophage-specific genes in VWAT was determined by qPCR. For each gene 6-9 animals/ genotype were examined, shown as mean ± s.e.m. For B-E, open bars- WT, closed bars- STAMP2-/-. * indicates p<0.05; ** p< 0.005; *** p< 0.0005.
To next examined insulin receptor signaling in vivo. In WT mice, insulin action as measured by increased phosphorylation of Akt was clear and uniform in both adipose depots. In STAMP2-/- mice, however, basal and insulin-stimulated levels of Akt phosphorylation were rather heterogeneous between animals, and basal Akt phosphorylation levels were overall elevated (Fig. 4c and Supplementary Fig. 3b). Hence, insulin had a significantly impaired stimulatory impact on Akt phosphorylation in the VWAT of STAMP2-/- mice (Fig. 4c). In contrast, insulin signaling in SWAT in the same STAMP2-/- mice was normal (Fig. 4c). We suggest that the alterations in insulin signaling may contribute to the severe suppression of insulin-stimulated glucose transport in visceral adipocytes in the absence of STAMP2, but likely are not sufficient to account for the entire defect. We also found significantly decreased expression of several genes critical for metabolic function, including Glut4, adiponectin, fatty acid synthase, and fatty acid transporter 1, and PPARγ, though others, such as FATP4 and leptin were not significantly regulated (Fig. 4d). It is likely that reduced expression of Glut4 also contributes to the pronounced glucose transport defect in STAMP2-/- visceral adipocytes. Since we have examined gene expression in the entire fat pad without separating out adipocytes specifically, it is possible that the increased presence of macrophages in adipose tissue may have contributed to adipocyte-specific gene expression patterns. As would be anticipated, macrophage-specific gene expression, such as Mac-1 and CD68, is also elevated in the VWAT of STAMP2-/- mice (Fig. 4e).
STAMP2 deficiency causes spontaneous metabolic disease in mice
We next asked whether STAMP2 deficiency may lead to alterations in systemic metabolic homeostasis. To address this, we examined body weight, systemic glucose metabolism and lipid levels in whole animals. Upon weaning, mice were placed on a standard rodent diet, and monitored to 20 weeks of age. Throughout the experimental period, there was minimal difference in total body weight between genotypes which did not reach statistical significance at any age (Fig. 5a). We also tested whether STAMP2 deficiency might alter body composition in mice by performing dual energy x-ray absorbiton (DEXA) analysis. While no differences in adiposity were observed at 2 months of age, by 5 months, STAMP2-/- mice tended to accumulate more body fat than WT mice (Fig. 5b). Subcutaneous (WT: 0.021±0.002; KO: 0.032±0.002 g/g body weight; p=0.004) but not visceral (WT: 0.039±0.003; KO: 0.041±0.004 g/g body weight; p= 0.6) adipose tissue weight was significantly higher in STAMP2-/- mice. It is possible that the extra body fat later on in life accumulates subcutaneously, rather than viscerally, due to the severe defects in insulin action in visceral fat in STAMP2-/- mice. In addition, liver weight was significantly higher in STAMP2-/- mice (WT: 0.043±0.004; KO: 0.057±0.004 g/g body weight; p=0.038).
Figure 5. Development of metabolic disease in STAMP2-/- mice.
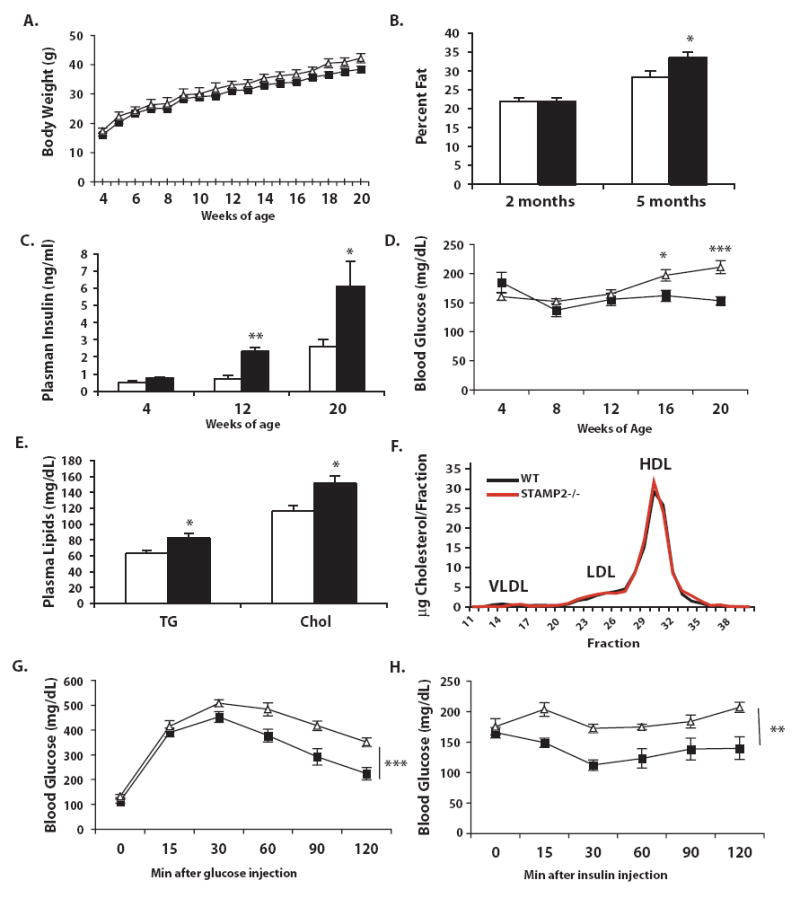
(A) Wild type (n=11) and STAMP2-/- (n=9) mice were weighed weekly until 20 weeks of age. (B) Percent body fat was measured in a separate group of mice aged 2 and 5 months using DEXA analysis. (C) Every 4 weeks, blood was collected after a 6 hour fast. At 4, 12, and 20 weeks of age, serum insulin measured by ELISA. (D) Blood glucose was measured every 4 weeks after a 6 hour fast. (E) Serum triglycerides and cholesterol were measured and (F) distribution of lipoprotein particles profiled at 12 weeks of age. (G) Glucose and (H) insulin tolerance tests were performed on mice aged 12 and 17 weeks respectively. All data is presented as mean ± s.e.m. In A, D, G & H- squares- wt, triangles- STAMP2-/-; in B, C, & E, open bars- wt, closed bars- STAMP2-/-. * p<0.05; ** p<0.005; *** p<0.0005.
To gain additional insights into the metabolism of these mice and possible reasons for the tendency to accumulate body fat, we monitored in 6-week old STAMP2-/- and WT mice for 48 hours in metabolic cages which enable determination of both energy intake (eating) and output (metabolic rate). Although there were no differences in food intake, VO2 and VCO2 tended to be lower in STAMP2-/- mice, suggesting that they may have a lower metabolic rate (Supplementary Fig. 4a,b). There was also reduced rates of physical activity in these animals, particularly during the dark cycle (Supplemental Fig. 4c,d). These results suggest that the principal cause of higher adiposity in STAMP2-/- mice may be reduced energy expenditure.
Insulin resistance is a central feature of metabolic syndrome. To evaluate the status of insulin action, we first examined plasma insulin and glucose levels throughout the experimental period. At 12 weeks of age, plasma insulin levels were significantly elevated in STAMP2-/- mice compared with WT mice and this pattern was progressively accentuated until the end of the experiment at 20 weeks (Fig. 5c). Plasma glucose concentrations were also slightly but significantly higher in the STAMP2-/- mice compared to WT animals by16 weeks of age and continued to increase at 20 weeks (Fig. 5d). Higher blood glucose concentrations in the presence of hyperinsulinemia in the STAMP2-/- mice is indicative of systemic insulin resistance.
We also determined steady state levels of plasma lipids, to assess whether STAMP2-deficiency causes dyslipidemia. Plasma triglycerides and cholesterol concentrations were moderately but significantly elevated at 12 weeks of age in STAMP2-/- mice compared to control animals (Fig. 5e). While total levels of cholesterol were elevated, FPLC analysis revealed no clear difference in lipoprotein particle distribution (Fig. 5f). Plasma free fatty acid levels did not differ between genotypes (WT: 0.82±0.1; KO: 0.84±0.4 mM).
To explore systemic insulin sensitivity further in this model, we next performed insulin (ITT) and glucose (GTT) tolerance tests in each genotype. Glucose disposal curves upon administration of insulin were significantly reduced in STAMP2-/- mice compared to WT controls, demonstrating the presence of insulin resistance (Fig. 5g). Similarly, in GTT, the glucose disposal patterns observed in STAMP2-/- mice indicates significant glucose intolerance (Fig. 5h). These results clearly show that STAMP2-deficiency disturbs systemic insulin action in the absence of additional stress.
Given the clear impairment in systemic glucose metabolism in STAMP2-/- mice, we suspected that insulin action at metabolic tissues other than adipose tissue may also be impaired. To address whether liver function may be altered in STAMP2-/- mice, we first investigated insulin action at this site in vivo. In these experiments, we observed a severe impairment of insulin receptor signaling in the livers of STAMP2-/- mice (Fig. 6a).
Figure 6. Liver insulin action and hyperinsulinemic-euglycemic clamp.
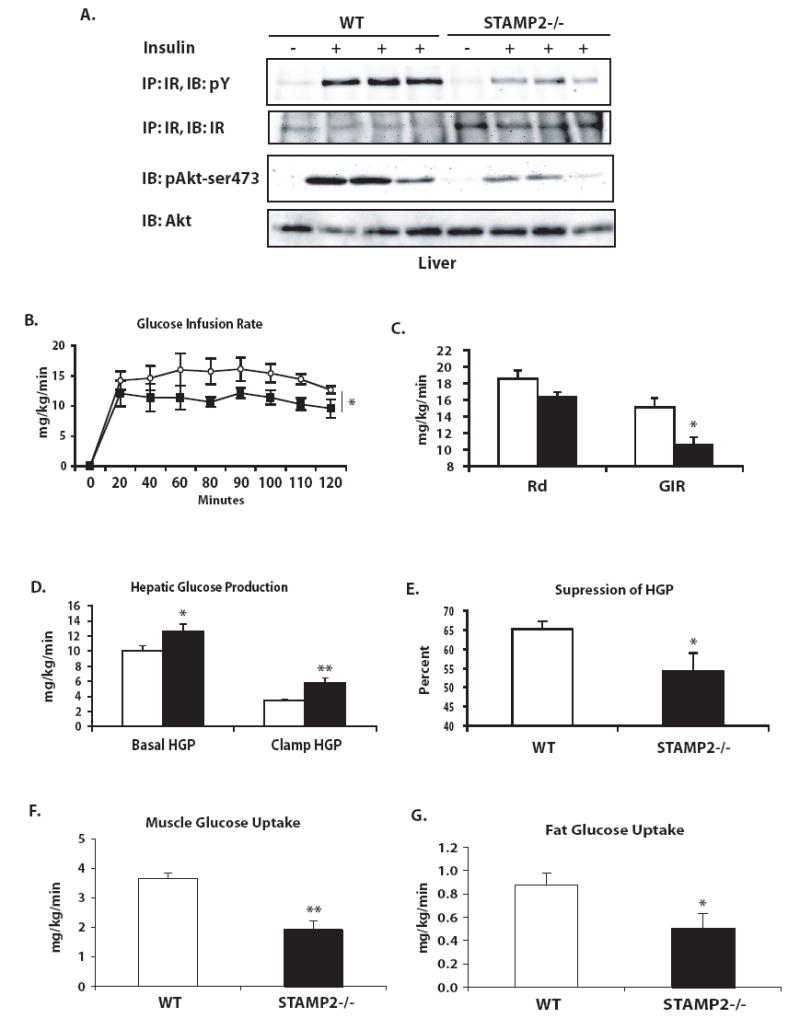
(A) Insulin action in the liver following insulin injection into the portal vein of anesthetized mice. Each lane represents one animal. (B) Hyperinsulinemic-euglycemic clamp experiments. Rate of glucose infusion was higher in wild type than in STAMP2-/- mice over the 2 h course of the clamp. (C) Average GIR and Rd were calculated. (D) Hepatic glucose production at basal and clamp conditions, as well as (E) percent suppression of hepatic glucose production by hyperinsulinemic clamp were calculated. (F) Muscle and (G) adipose tissue glucose uptake during the clamp were assessed by measuring uptake of a 14C-2-deoxyglucose tracer. * p<0.05; ** p<0.005. Data graphed as mean ± s.e.m. For parts C-G, open bars- wt; closed bars- STAMP2-/-. For part B, open circles- wt; closed squares- STAMP2-/-.
Our results indicate that insulin action is impaired in STAMP2-deficient mice in at least two metabolically relevant tissues, visceral adipose tissue and liver. An important question for understanding the role of STAMP2 in regulation of systemic metabolism is which tissues are critical in mediating the development of systemic insulin resistance. To elucidate the organs responsible for the systemic metabolic phenotype we performed hyperinsulinemic-euglycemic clamp experiments in WT and STAMP2-/- mice. As expected, no differences in body weight were observed between genotypes in the animals used for the clamp experiments, either at the time of catheterization surgery or experiment (Supplementary Fig. 5a). Experiments were performed with 4 month old STAMP2-/- mice in the fasted state, and blood glucose values were normalized during the clamp (Supplementary Fig. 5b). Glucose infusion rate was significantly lower in STAMP2-/- mice than WT controls throughout the duration of the clamp, confirming systemic insulin resistance (Fig. 6b). The rate of glucose disposal was also lower in STAMP2-/- animals, but did not achieve statistical significance (p=0.06, Fig. 6c). Hepatic glucose production was significantly higher in STAMP2-/- mice in both basal and clamp conditions, and ability to suppress hepatic glucose production in hyperinsulinemic conditions was significantly compromised, demonstrating the presence of liver insulin resistance (Fig. 6d,e). We also tested whether insulin-stimulated glucose uptake into muscle and fat were altered in these mice by determining tissue content of 14C-2-deoxyglucose tracer. As expected and in agreement with the rest of our data, glucose uptake into adipose tissue was impaired in the absence of STAMP2 (Fig. 6g). Muscle glucose uptake was also significantly reduced in STAMP2-/- animals (Fig. 6f). These results suggest that the moderate reduction observed in the rate of glucose disposal in STAMP2-/- mice is likely to be biologically significant, since both muscle and fat are significantly impaired in glucose uptake capacity. Overall, the results of these clamp experiments indicate that both liver glucose production and peripheral glucose disposal contribute to the systemic insulin resistance in STAMP2-/- animals.
In STAMP2-/- mice, liver sections exhibited notable fatty accumulation, particularly as the animals aged (Fig. 7a). At 6 months of age total liver triglyceride content in STAMP2-/- mice was significantly elevated (Fig. 7b). Expression of fatty acid synthase (FAS) and stearoyl CoA desaturase (SCD-1), enzymes critical in fatty acid and triglyceride synthesis respectively, were significantly elevated in the livers of STAMP2-/- mice (Fig. 7c). As the signs of insulin resistance preceed the time of marked steatosis, we next asked whether the defective insulin signaling in liver might be the result an effect mediated by altered endocrine activity of adipose tissue in STAMP2-deficiency. To explore this possibility, rat Fao liver cells were treated with conditioned medium that was collected from 3T3-L1 adipocytes transfected with either control or STAMP2 siRNA. Liver cells cultured with conditioned medium from STAMP2-deficient adipocytes exhibited reduced insulin signaling compared to controls, suggesting that the absence of STAMP2 in adipocytes may regulate insulin sensitivity in liver cells (Supplementary Fig. 2b). We next examined plasma levels of various adipokines, reasoning that increased inflammatory gene expression in adipose tissue may be reflected in increased plasma levels thus contributing to systemic effects. Although elevated adipose expression of some inflammatory cytokines did not translate into detectably higher levels in circulation in these experiments, both leptin and resistin were found to be significantly elevated in STAMP2-/- mice (Table 1). Resistin has been implicated in impairing glucose homeostasis, particularly through regulation of hepatic glucose production (Steppan and Lazar 2004); hence, it is possible that elevated resistin levels may contribute to some of the liver phenotypes of the STAMP2-/- mouse.
Figure 7. Liver lipid accumulation in STAMP2-/- mice, and absence of STAMP2 exacerbates metabolic phenotype of ob/ob mice.
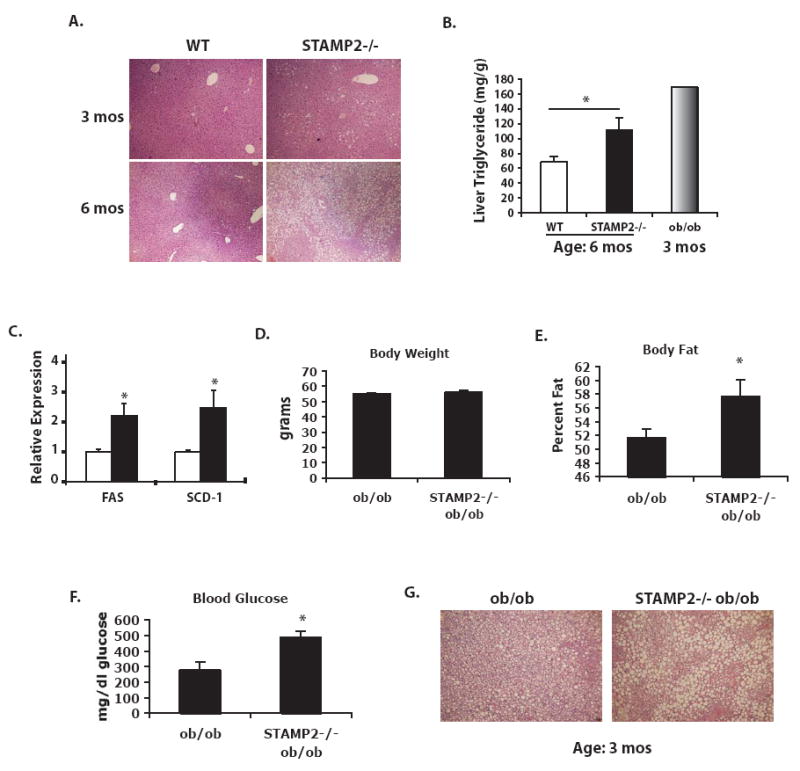
(A) Liver sections were stained with hemotoxylin and eosin. (B) Quantitation of liver triglyceride, with ob/ob liver used as a control. (C) FAS and SCD-1 expression determined by qPCR in liver at 6 months of age. (D) Generation of ob/ob (n=4) and STAMP2-/-ob/ob (n=5) mice. In 12-week-old mice, (D) body weight was similar between genotypes, though (E) body fat was significantly higher in mice lacking STAMP2. (F) Blood glucose after a 6 hour fast was significantly higher in the STAMP2-/-ob/ob mice. (G) H & E staining of liver sections showed higher lipid accumulation with larger lipid droplets in the mice lacking STAMP2. All bar graph data represents mean ± s.e.m.
Table1.
Adipokine levels (ng/ml) in 12 week-old wild type and STAMP2-/- mice.
| WT | STAMP2-/- | |
|---|---|---|
| Adiponectin | 9182 ± 423 | 8375 ± 461 |
| Leptin | 6577 ± 1461 | 17040 ± 4265* |
| Resistin | 1271 ± 165 | 1826 ± 177* |
| TNFα | 8.52 ± 0.38 | 8.77 ± 0.21 |
| IL-6 | nd | nd |
| MCP-1 | nd | nd |
p < 0.05; nd = not detectable
If STAMP2 indeed serves as a regulatory factor to preserve metabolic function, we would predict that under conditions of metabolic stress, such as obesity, that the absence of STAMP2 would exacerbate the phenotype. Alternatively, and particularly considering the loss of regulation of STAMP2 expression in obesity (Fig. 1g), it is possible that STAMP2 action is only relevant during relatively short-term or acute challenges. To evaluate this, we decided to examine the function of STAMP2 in ob/ob mice, a model of severe obesity with moderate hyperglycemia. We succeeded in generating a small group of STAMP2-/-ob/ob mice and compared them to age-matched ob/ob controls. Although the two groups were similar in total body weight at 12 weeks of age (Fig. 7d), the ob/ob mice lacking STAMP2 had significantly higher body fat percentage (Fig. 7e). On the C57/Bl6 genetic background, ob/ob mice develop only mild hyperglycemia. Remarkably however, STAMP2-/-ob/ob mice had extremely high blood glucose levels, averaging nearly 500 mg/dl after a 6 hour fast (Fig. 7f). Comparison of liver sections also indicated even more pronounced lipid accumulation in the STAMP2-/-ob/ob mice (Fig. 7g).
Taken together, these results demonstrate that STAMP2-deficiency is sufficient to spontaneously recapitulate many cardinal features of the metabolic syndrome, including insulin resistance, glucose intolerance, mild hyperglycemia, dyslipidemia, and fatty infiltration of liver and markedly exacerbate the metabolic abnormalities of the ob/ob model of severe obesity.
DISCUSSION
The results of this study position STAMP2 in a critical role of modulating inflammatory responses and protecting metabolic function in adipocytes. Recent studies have indicated the relevance of nutrients in activating inflammatory pathways (Hotamisligil 2006). Much evidence has shown the role of hyperglycemia in mediating diabetic complications, and recently the ability of glucose to activate oxidative stress and inflammatory pathways in adipocytes has also been shown (Brownlee 2001; Lin et al. 2004). Additionally, free fatty acids can activate inflammatory responses and impair insulin action in adipocytes (Nguyen et al. 2005). Thus, excess nutrients can be damaging, and we suggest that STAMP2 may play an important role in the adipocyte defense arsenal against nutrient surplus. Our results demonstrate not only that acute nutritional challenges can cause excessive inflammation in the adipose tissue of STAMP2-/- mice, but that even in conditions of ad lib feeding on a standard diet, STAMP2 is essential for prevention of excessive inflammation and protection of adipocyte insulin sensitivity and systemic glucose homeostasis. A critical objective for the future will be to elucidate the mechanisms by which STAMP2 mediates these effects. We suggest that over time, the accumulation of small cellular stresses due to daily changes and fluctuations in nutrients in STAMP2-/- mice may lead to the activation of inflammatory pathways and inhibition of insulin action resulting in systemic metabolic deterioration over the long term.
The findings that STAMP2 both protects against excessive inflammation and is also upregulated under inflammatory and nutrient-rich conditions may appear paradoxical at first. Our results suggest that STAMP2 acts in a regulatory role, not to block activation of inflammatory pathways, but to restrict the degree of their activity. This is exemplified in the regulation of STAMP2 by TNFα. TNFα induces both STAMP2 and inflammatory cytokine expression; yet, in the absence of STAMP2, the ability of TNFα to promote IL-6 expression is more potent. We suggest that the STAMP2 acts in a similar regulatory capacity in response to acute nutritional challenges or chronic hyperglycemia. In strong support of our model, ob/ob mice lacking STAMP2 exhibit an exacerbated metabolic phenotype as compared to ob/ob mice with intact STAMP2 function. It is important to note however that ob/ob mice experience much more rapid and severe onset of obesity than would be typical for either mice fed a high fat diet or for most human obesity. It remains possible that in a more gradual onset of obesity, that STAMP2 may play a less important or different role, and hence, additional and more extensive studies in other mouse obesity and diabetes models are warranted.
High adipose tissue expression of STAMP2 also fits well with this model, since adipocytes are critical in the management of excess nutrients. It is noteable that the tissue distribution that we observe in mice is somewhat different than the published rat tissue distribution, which show high STAMP2 expression in liver and kidney in addition to adipose tissue (Moldes et al. 2001). In humans, STAMP2 is known to be expressed highly in heart, placenta, lung, liver, and prostate, though adipose tissue has not been examined (Korkmaz et al. 2005). In applying these data to other models or humans, it will be important to consider possible differences between species in terms of STAMP2 expression and function.
STAMP2 belongs to a family of four mammalian proteins, which have been described within recent years under several different names, including STAMP1 (STEAP2), STAMP2 (TIARP; STEAP4), STEAP, and STEAP3 (pHyde; TSAP6) (Hubert et al. 1999; Steiner et al. 2000; Moldes et al. 2001; Korkmaz et al. 2002; Passer et al. 2003; Korkmaz et al. 2005; Ohgami et al. 2005). While all members have been characterized in the prostate, STAMP2 is the only family member that has been previously reported to be expressed in adipocytes and adipose tissue (Moldes et al. 2001). All of these proteins contain six transmembrane domains and, except for STEAP, a long N-terminal tail predicted to have NADP+/NADPH oxidoreductase activity. These proteins have recently been characterized as metalloreductases, capable of facilitating cellular uptake of both iron and copper (Ohgami et al. 2006). The relevance of STEAP3 in the physiological regulation of iron metabolism has been confirmed in vivo, and mice lacking STEAP3 suffer from anemia (Ohgami et al. 2005). A critical question for future studies is, what role, if any, does the metalloreductase domain play in STAMP2’s metabolic effects. One attractive hypothesis could be that STAMP2 as a ferrireductase may be facilitating iron uptake into the adipocyte for use in intermediary metabolism, since a number of metabolic components involved in glucose and lipid metabolism require iron for their activity, including lipid desaturases, aconitases, and cytochromes. An intriguing possibility may be that STAMP2 action might be involved in providing iron to the mitochondria for the production of iron-sulfur clusters required for the respiratory complexes of the electron transport chain. Deficient electron transport chain function could result in ROS production, which is known to impact both inflammatory pathways and insulin signaling. Much additional work will be required to evaluate these possibilities.
We find that STAMP2 deficiency in mice results in impaired insulin action at tissues critical for glucose homeostasis, fat, liver, and muscle. Although STAMP2 expression is highest in WAT in mice, it is also present in liver and muscle and may have primary effects at all three locations. Of course, changes in the endocrine function of adipose tissue may also contribute to or even entirely mediate the liver and systemic phenotypes, and thus, further studies addressing the role of STAMP2 in the regulation of adipocyte secretory function are also warranted. Much evidence has been documented to indicate that factors secreted from adipocytes play critical roles in the regulation of liver and systemic metabolism (Rajala and Scherer 2003). Prior studies have suggested that STAMP family members may have direct roles in secretory processes. STAMP1 and STAMP2 colocalize with markers for Golgi and early endosomes, and live cell imaging reveals that these proteins cycle between the plasma membrane and an internal compartment (Korkmaz et al. 2002; Korkmaz et al. 2005). In addition, STEAP3 has been shown to faciliate the secretion of translationally controlled tumor protein (TCTP) through a non-classical pathway (Amzallag et al. 2004). If STAMP2 also serves such a function, it might impact other organs, particularly liver due to the proximity of visceral adipose depots to this organ. Thus, it will be worthwhile to investigate whether STAMP2 may regulate the endocrine function of the adipocyte both at the levels of gene expression and protein secretion.
Finally, this study also highlights the differences in biology between visceral and subcutaneous WAT and the unique involvement of STAMP2 in this distinction. Clearly, the visceral depot has a much stronger phenotype than the subcutaneous depot in STAMP2 deficiency. This suggests that the visceral depot is either more susceptible to environmental insults such as hyperglycemia, due to fundamental metabolic differences between the depots, or more exposed to such stressors, due perhaps to differences in vascularization or circulation. In addition to the clinical association between visceral obesity and metabolic syndrome, there are differences in gene expression patterns between the visceral and subcutaeous depots (Lefebvre et al. 1998; Despres and Lemieux 2006). Interestingly, a recent study has also shown that upon exposure to nutrients, visceral adipose tissue is much more responsive than the subcutaneous depot for expression of secreted molecules (Einstein et al. 2005). Our data provide a potential molecular locus critical in the differential regulation of these depot-specific responses.
We suggest that the findings presented in this manuscript identify STAMP2 as a novel player in the coordination of inflammation and metabolism and contribute a critical molecular component to our understanding of metabolic homeostasis and its relationship with inflammation.
EXPERIMENTAL PROCEDURES
Mice
STAMP2-/- mice were purchased from Deltagen, Inc. (San Carlos, CA) (Deltagen tracking number ZBB519) where they were generated by gene targeting into embryonic stem cells derived from 129P2/OlaHsd mice and injected into C57Bl/6 blastocysts. We obtained 2 heterozygous breeding pairs from Deltagen, which we used to generate WT and STAMP2-/- mice. Mice were given free access to the standard rodent diet (PicoLab Mouse Diet 20, containing 9% fat by weight [21.6% kcal from fat]). Age-matched lean and obese ob/ob male mice used in feeding/ fasting experiment were obtained from Jackson Labs. To generate STAMP2-/-ob/ob mice, STAMP2-/- mice were intercrossed with ob+/- mice and F1 double heterozygotes were then used to generate the STAMP2-/-ob/ob and ob/ob genotypes. The Institutional Animal Care and Use Committee (Harvard School of Public Health) approved all studies.
Metabolic studies
For glucose tolerance tests, male 12-week-old wild type (n=9) and STAMP2-/- (n=10) mice were fasted overnight (14 hours) and injected intraperitoneally (i.p.) with 2 g/kg glucose. For insulin tolerance tests, male 17-week-old wild type (n=4) and STAMP2-/- (n=5) mice were fasted for 6 hours and injected i.p. with 0.75 IU/kg insulin. For both, blood was collected from the tail vein at the indicated times and glucose measured using an Ascensia glucometer. Body fat was measured in mice anethesthetized with ketamine/xylazine using duel energy X-ray absorbitometry (DEXA) (age 2 months: n=4 wt, n=6 KO; age 5 mos: n=6 wt, n=7 KO).
Injections of insulin and lipid/ glucose administration
3-month-old male mice were anesthetized with tribromoethanol, and 2 IU/kg insulin or PBS infused into the portal vein. After 3 minutes, liver, VWAT, and SWAT were collected, in that order, and immediately frozen in liquid nitrogen. Lysates were prepared and used for Western blotting. Lipid and glucose administrations were done in 2 month old WT and STAMP2-/- mice. After overnight fasting, mice were injected i.p. with either 2 ml PBS or 2 ml 20% intralipid (gift of Baxter Healthcare, Deerfield, IL). After 4 hours, either PBS or 2 mg/kg glucose was injected i.p., and 90 minutes later animals were sacrificied. Tissues were removed and immediately frozen in liquid nitrogen. Data is pooled from 2 independent experiments, with total 4 mice/ genotype receiving PBS and 6 mice/ genotype receiving lipid and glucose.
Cell culture and reporter experiments
3T3-L1 preadipocytes were maintained in DMEM supplemented with 10% calf serum. To differentiate, cells were grown to confluence and placed into induction medium (DMEM, 10% cosmic calf serum, 5 μg/ml insulin, 0.5 mM IBMX, 1 μM Dexamethazone, and 10 μM TZD. After 2 days, cells were switched into differentiation medium (DMEM, 10% cosmic calf serum, 5 μg/ml insulin) until used for experimentation. For insulin signaling experiments, cells were serum-starved overnight, treated with insulin for 100 seconds, and immediately frozen in liquid nitrogen prior to preparation of protein lysate. For RNAi experiments, siRNA specific to STAMP2 (target sequence: AAGCAGCATCCAAGTCTGACA) and non-specific control were synthesized by Qiagen. An Amaxa Nucleofector was used to electroporate siRNA into 3T3-L1 adipocytes 5 days after inducing differentiation. Experiments were performed 36-48 hours after electroporation. For reporter assays, a 2kb fragment of 5’ STAMP2 promoter region was cloned into a reporter plasmid. Promoter activity was evaluated in Hela cells (ATCC) cultured in DMEM supplemented with 10% fetal calf serum. Cells were seeded in 6-well plates, grown to ~50% confluency and transfected with plasmid DNA with the indicated trnascription factors and ligands for LXR (T0901317, 10μM), PPARγ (pioglitazone, 1.5μM), or DMSO followed by luciferase assays, as described previously (Slagsvold et al. 2001). Further details are provided in the supplement.
Quantitative PCR
RNA was isolated from tissues and cells using Trizol (Invitrogen). cDNA was synthesized using either Thermoscript (Invitrogen) or iScript (BioRad). Q-PCR was performed using a BioRad iCycler. Primer sequences were may be found in the supplement.
Liver triglycerides
Lipid extraction was performed using the Bligh-Dyer method (Bligh and Dyer 1959). Briefly, livers were homogenized in chloroform: MeOH: H2O (1:2:0.8) at room temperature. Samples were spun and supernatants saved. Equal amounts of chloroform and water were added to supernatant. Samples were vortexed and centrifuged. Chloroform layer was collected and samples dried completely in vacuum oven. Samples were resuspended in 90% isopropanol: 10% Triton-X. Triglyceride concentration was measured using Sigma Kit TR0100, as per manufacturers’ instructions.
Hyperinsulinemic-euglycemic clamp studies
Surgery was performed to catheterize the jugular vein of 4-month-old wild type (n=8) and STAMP2-/- (n=7) mice. After four days recovery period, clamp experiments were performed as previously described (Ozcan et al. 2006). To determine [3H]-glucose and 2-[14C]-DG concentrations, plasma was deproteinized with ZnSO4 and Ba(OH)2, dried to remove 3H2O, re-suspended in water, and counted in scintillation fluid for detection of 3H and 14C. The plasma concentration of 3H2O was calculated by the difference between 3H counts with and without drying. Tissue 2-[14C]-DG-6-phosphate (2-DG-6-P) content was determined in homogenized samples that were subjected to an ion-exchange column to separate 2-DG-6-P from 2-[14C]-DG. Calculations and experimental details are described in the supplement.
Supplementary Material
Acknowledgments
This study is supported by a grant from NIH to GSH (DK52539) and grants to FS from Norwegian Research Council and Norwegian Cancer Society. We thank V. Babaev and M. Linton (Vanderbilt University) for performing FPLC analysis of lipoprotein distribution and U. Ozcan for help in in vivo insulin signaling experiments. KEW and MFG are supported by NIH Roadmap predoctoral fellowships (T90 DK070078). CM is supported by a joint fellowship from Ellison Foundation and International Nutrition Foundation.
Footnotes
Publisher's Disclaimer: This is a PDF file of an unedited manuscript that has been accepted for publication. As a service to our customers we are providing this early version of the manuscript. The manuscript will undergo copyediting, typesetting, and review of the resulting proof before it is published in its final citable form. Please note that during the production process errors may be discovered which could affect the content, and all legal disclaimers that apply to the journal pertain.
References
- Amzallag N, Passer BJ, Allanic D, Segura E, Thery C, Goud B, Amson R, Telerman A. TSAP6 facilitates the secretion of translationally controlled tumor protein/histamine-releasing factor via a nonclassical pathway. J Biol Chem. 2004;279(44):46104–12. doi: 10.1074/jbc.M404850200. [DOI] [PubMed] [Google Scholar]
- Arkan MC, Hevener AL, Greten FR, Maeda S, Li ZW, Long JM, Wynshaw-Boris A, Poli G, Olefsky J, Karin M. IKK-beta links inflammation to obesity-induced insulin resistance. Nat Med. 2005;11(2):191–8. doi: 10.1038/nm1185. [DOI] [PubMed] [Google Scholar]
- Bligh EG, Dyer WJ. A rapid method of total lipid extraction and purification. Can J Biochem Physiol. 1959;37(8):911–7. doi: 10.1139/o59-099. [DOI] [PubMed] [Google Scholar]
- Brownlee M. Biochemistry and molecular cell biology of diabetic complications. Nature. 2001;414(6865):813–20. doi: 10.1038/414813a. [DOI] [PubMed] [Google Scholar]
- Cai D, Yuan M, Frantz DF, Melendez PA, Hansen L, Lee J, Shoelson SE. Local and systemic insulin resistance resulting from hepatic activation of IKK-beta and NF-kappaB. Nat Med. 2005;11(2):183–90. doi: 10.1038/nm1166. [DOI] [PMC free article] [PubMed] [Google Scholar]
- Despres JP, Lemieux I. Abdominal obesity and metabolic syndrome. Nature. 2006;444(7121):881–7. doi: 10.1038/nature05488. [DOI] [PubMed] [Google Scholar]
- Einstein FH, Atzmon G, Yang XM, Ma XH, Rincon M, Rudin E, Muzumdar R, Barzilai N. Differential responses of visceral and subcutaneous fat depots to nutrients. Diabetes. 2005;54(3):672–8. doi: 10.2337/diabetes.54.3.672. [DOI] [PubMed] [Google Scholar]
- Emanuelli B, Peraldi P, Filloux C, Sawka-Verhelle D, Hilton D, Van Obberghen E. SOCS-3 is an insulin-induced negative regulator of insulin signaling. J Biol Chem. 2000;275(21):15985–91. doi: 10.1074/jbc.275.21.15985. [DOI] [PubMed] [Google Scholar]
- Fasshauer M, Kralisch S, Klier M, Lossner U, Bluher M, Chambaut-Guerin AM, Klein J, Paschke R. Interleukin-6 is a positive regulator of tumor necrosis factor alpha-induced adipose-related protein in 3T3-L1 adipocytes. FEBS Lett. 2004;560(13):153–7. doi: 10.1016/S0014-5793(04)00096-1. [DOI] [PubMed] [Google Scholar]
- Furukawa S, Fujita T, Shimabukuro M, Iwaki M, Yamada Y, Nakajima Y, Nakayama O, Makishima M, Matsuda M, Shimomura I. Increased oxidative stress in obesity and its impact on metabolic syndrome. J Clin Invest. 2004;114(12):1752–61. doi: 10.1172/JCI21625. [DOI] [PMC free article] [PubMed] [Google Scholar]
- Hirosumi J, Tuncman G, Chang L, Gorgun CZ, Uysal KT, Maeda K, Karin M, Hotamisligil GS. A central role for JNK in obesity and insulin resistance. Nature. 2002;420(6913):333–6. doi: 10.1038/nature01137. [DOI] [PubMed] [Google Scholar]
- Hotamisligil GS. Inflammation and metabolic disorders. Nature. 2006;444(7121):860–7. doi: 10.1038/nature05485. [DOI] [PubMed] [Google Scholar]
- Houstis N, Rosen ED, Lander ES. Reactive oxygen species have a causal role in multiple forms of insulin resistance. Nature. 2006;440(7086):944–8. doi: 10.1038/nature04634. [DOI] [PubMed] [Google Scholar]
- Howard JK, Cave BJ, Oksanen LJ, Tzameli I, Bjorbaek C, Flier JS. Enhanced leptin sensitivity and attenuation of diet-induced obesity in mice with haploinsufficiency of Socs3. Nat Med. 2004;10(7):734–8. doi: 10.1038/nm1072. [DOI] [PubMed] [Google Scholar]
- Hubert RS, Vivanco I, Chen E, Rastegar S, Leong K, Mitchell SC, Madraswala R, Zhou Y, Kuo J, Raitano AB, Jakobovits A, Saffran DC, Afar DE. STEAP: a prostate-specific cell-surface antigen highly expressed in human prostate tumors. Proc Natl Acad Sci U S A. 1999;96(25):14523–8. doi: 10.1073/pnas.96.25.14523. [DOI] [PMC free article] [PubMed] [Google Scholar]
- Korkmaz CG, Korkmaz KS, Kurys P, Elbi C, Wang L, Klokk TI, Hammarstrom C, Troen G, Svindland A, Hager GL, Saatcioglu F. Molecular cloning and characterization of STAMP2, an androgen-regulated six transmembrane protein that is overexpressed in prostate cancer. Oncogene. 2005 doi: 10.1038/sj.onc.1208677. [DOI] [PubMed] [Google Scholar]
- Korkmaz KS, Elbi C, Korkmaz CG, Loda M, Hager GL, Saatcioglu F. Molecular cloning and characterization of STAMP1, a highly prostate-specific six transmembrane protein that is overexpressed in prostate cancer. J Biol Chem. 2002;277(39):36689–96. doi: 10.1074/jbc.M202414200. [DOI] [PubMed] [Google Scholar]
- Lefebvre AM, Laville M, Vega N, Riou JP, van Gaal L, Auwerx J, Vidal H. Depot-specific differences in adipose tissue gene expression in lean and obese subjects. Diabetes. 1998;47(1):98–103. doi: 10.2337/diab.47.1.98. [DOI] [PubMed] [Google Scholar]
- Lin Y, Berg AH, Iyengar P, Lam TK, Giacca A, Combs TP, Rajala MW, Du X, Rollman B, Li W, Hawkins M, Barzilai N, Rhodes CJ, Fantus IG, Brownlee M, Scherer PE. The hyperglycemia-induced inflammatory response in adipocytes: The role of reactive oxygen species. J Biol Chem. 2004 doi: 10.1074/jbc.M411863200. [DOI] [PubMed] [Google Scholar]
- Moldes M, Lasnier F, Gauthereau X, Klein C, Pairault J, Feve B, Chambaut-Guerin AM. Tumor necrosis factor-alpha-induced adipose-related protein (TIARP), a cell-surface protein that is highly induced by tumor necrosis factor-alpha and adipose conversion. J Biol Chem. 2001;276(36):33938–46. doi: 10.1074/jbc.M105726200. [DOI] [PubMed] [Google Scholar]
- Mooney RA, Senn J, Cameron S, Inamdar N, Boivin LM, Shang Y, Furlanetto RW. Suppressors of cytokine signaling-1 and -6 associate with and inhibit the insulin receptor. A potential mechanism for cytokine-mediated insulin resistance. J Biol Chem. 2001;276(28):25889–93. doi: 10.1074/jbc.M010579200. [DOI] [PubMed] [Google Scholar]
- Nguyen MT, Satoh H, Favelyukis S, Babendure JL, Imamura T, Sbodio JI, Zalevsky J, Dahiyat BI, Chi NW, Olefsky JM. JNK and tumor necrosis factor-alpha mediate free fatty acid-induced insulin resistance in 3T3-L1 adipocytes. J Biol Chem. 2005;280(42):35361–71. doi: 10.1074/jbc.M504611200. [DOI] [PubMed] [Google Scholar]
- Ohgami RS, Campagna DR, Greer EL, Antiochos B, McDonald A, Chen J, Sharp JJ, Fujiwara Y, Barker JE, Fleming MD. Identification of a ferrireductase required for efficient transferrin-dependent iron uptake in erythroid cells. Nat Genet. 2005;37(11):1264–9. doi: 10.1038/ng1658. [DOI] [PMC free article] [PubMed] [Google Scholar]
- Ohgami RS, Campagna DR, McDonald A, Fleming MD. The Steap proteins are metalloreductases. Blood. 2006;108(4):1388–94. doi: 10.1182/blood-2006-02-003681. [DOI] [PMC free article] [PubMed] [Google Scholar]
- Ozcan U, Yilmaz E, Ozcan L, Furuhashi M, Vaillancourt E, Smith RO, Gorgun CZ, Hotamisligil GS. Chemical chaperones reduce ER stress and restore glucose homeostasis in a mouse model of type 2 diabetes. Science. 2006;313(5790):1137–40. doi: 10.1126/science.1128294. [DOI] [PMC free article] [PubMed] [Google Scholar]
- Passer BJ, Nancy-Portebois V, Amzallag N, Prieur S, Cans C, Roborel de Climens A, Fiucci G, Bouvard V, Tuynder M, Susini L, Morchoisne S, Crible V, Lespagnol A, Dausset J, Oren M, Amson R, Telerman A. The p53-inducible TSAP6 gene product regulates apoptosis and the cell cycle and interacts with Nix and the Myt1 kinase. Proc Natl Acad Sci U S A. 2003;100(5):2284–9. doi: 10.1073/pnas.0530298100. [DOI] [PMC free article] [PubMed] [Google Scholar]
- Rajala MW, Scherer PE. Minireview: The adipocyte--at the crossroads of energy homeostasis, inflammation, and atherosclerosis. Endocrinology. 2003;144(9):3765–73. doi: 10.1210/en.2003-0580. [DOI] [PubMed] [Google Scholar]
- Rosen ED, Walkey CJ, Puigserver P, Spiegelman BM. Transcriptional regulation of adipogenesis. Genes Dev. 2000;14(11):1293–307. [PubMed] [Google Scholar]
- Slagsvold T, Kraus I, Fronsdal K, Saatcioglu F. DNA binding-independent transcriptional activation by the androgen receptor through triggering of coactivators. J Biol Chem. 2001;276(33):31030–6. doi: 10.1074/jbc.M104310200. [DOI] [PubMed] [Google Scholar]
- Steiner MS, Zhang X, Wang Y, Lu Y. Growth inhibition of prostate cancer by an adenovirus expressing a novel tumor suppressor gene, pHyde. Cancer Res. 2000;60(16):4419–25. [PubMed] [Google Scholar]
- Steppan CM, Lazar MA. The current biology of resistin. J Intern Med. 2004;255(4):439–47. doi: 10.1111/j.1365-2796.2004.01306.x. [DOI] [PubMed] [Google Scholar]
- Weisberg SP, McCann D, Desai M, Rosenbaum M, Leibel RL, Ferrante AW., Jr Obesity is associated with macrophage accumulation in adipose tissue. J Clin Invest. 2003;112(12):1796–808. doi: 10.1172/JCI19246. [DOI] [PMC free article] [PubMed] [Google Scholar]
- Wellen KE, Hotamisligil GS. Inflammation, stress, and diabetes. J Clin Invest. 2005;115(5):1111–9. doi: 10.1172/JCI25102. [DOI] [PMC free article] [PubMed] [Google Scholar]
- Wellen KE, Uysal KT, Wiesbrock S, Yang Q, Chen H, Hotamisligil GS. Interaction of tumor necrosis factor-alpha- and thiazolidinedione-regulated pathways in obesity. Endocrinology. 2004;145(5):2214–20. doi: 10.1210/en.2003-1580. [DOI] [PubMed] [Google Scholar]
- Xu H, Barnes GT, Yang Q, Tan G, Yang D, Chou CJ, Sole J, Nichols A, Ross JS, Tartaglia LA, Chen H. Chronic inflammation in fat plays a crucial role in the development of obesity-related insulin resistance. J Clin Invest. 2003;112(12):1821–30. doi: 10.1172/JCI19451. [DOI] [PMC free article] [PubMed] [Google Scholar]
- Yuan M, Konstantopoulos N, Lee J, Hansen L, Li ZW, Karin M, Shoelson SE. Reversal of obesity- and diet-induced insulin resistance with salicylates or targeted disruption of Ikkbeta. Science. 2001;293(5535):1673–7. doi: 10.1126/science.1061620. [DOI] [PubMed] [Google Scholar]
Associated Data
This section collects any data citations, data availability statements, or supplementary materials included in this article.