

Abstract
COM stones are often resistant to breakage using shock wave (SW) lithotripsy. It would be useful to identify by computed tomography (CT) those COM stones that are susceptible to SW’s. For this study, 47 COM stones (4-10 mm in diameter) were scanned with micro CT to verify composition and also for assessment of heterogeneity (presence of pronounced lobulation, voids, or apatite inclusions) by blinded observers. Stones were then placed in water and scanned using 64-channel helical CT. As with micro CT, heterogeneity was assessed by blinded observers, using high-bone viewing windows. Then stones were broken in a lithotripter (Dornier Doli-50) over 2 mm mesh, and SW’s counted. Results showed that classification of stones using micro CT was highly repeatable among observers (κ=0.81), and also predictive of stone fragility. Stones graded as homogeneous required 1874±821 SW/g for comminution, while stones with visible structure required half as many SW/g, 912±678. Similarly, when stones were graded by appearance on helical CT, classification was repeatable (κ=0.40), and homogeneous stones required more SW’s for comminution than did heterogeneous stones (1702±993 SW/g, compared to 907±773). Stone fragility normalized to stone size did not correlate with Hounsfield units (p=0.85). In conclusion, COM stones of homogeneous structure require almost twice as many SW’s to comminute than stones of similar mineral composition that exhibit internal structural features that are visible by CT. This suggests that stone fragility in patients could be predicted using pre-treatment CT imaging. The findings also show that Hounsfield unit values of COM stones did not correlate with stone fragility. Thus, it is stone morphology, rather than x-ray attenuation, which correlates with fragility to SW’s in this common stone type.
Keywords: kidney calculi, tomography, x-ray computed, micro CT
Introduction
Urinary calculi made of calcium oxalate monohydrate (COM) are among the most common stones affecting the populations of industrialized countries [1,2], and can be especially resistant to shock wave (SW) lithotripsy [3,4]. However, study of stone breakage in vitro has shown that COM stones vary dramatically in their fragility to SW’s, with some stones being very resistant, and others quite fragile [5,6], and this variability is consistent with clinical experience [4]. Lithotripter SW’s can produce adverse effects [7], so it is important to consider ways to reduce dosage of SW’s when possible. If the level of susceptibility of a given COM stone to SW lithotripsy could be established at diagnosis, SW dosage could be tailored to that case.
Helical computed tomography (CT) has been proposed as a means to predict the success or failure of lithotripsy [6,8], and a number of studies have attempted to utilize CT numbers (in Hounsfield units, which are related to x-ray attenuation values) as a predictor of stone fragility [9-14]. However, given the resolution of clinical CT and the effects of volume averaging, the simple measure of Hounsfield units in stones is most likely to correlate with stone size [15,16], and stone size correlates with the number of SW’s required for comminution [5]. Thus, the use of Hounsfield units alone for predicting stone fragility in lithotripsy becomes little more than an expensive way to measure stone size. What is needed is a way to distinguish COM stones that will break easily with SW’s from stones of the same size that will be SW-resistant.
By normalizing Hounsfield unit values to stone diameter, it has been shown that the volume-averaging error can be corrected to some extent, so as to yield attenuation values that are specific for stone type. In this way, uric acid can be distinguished from calcium oxalate [17]. However, such an approach has not been shown to be of value for predicting which COM stones will be resistant to SW’s.
A more useful strategy may be to exploit the ability of helical CT to visualize structure within stones [6,18,19]. In the present study, COM stones were scanned in vitro by micro CT and helical CT, with independent observers grading stones according to heterogeneity of structure, and these observations were correlated with stone fragility. The results show that visible internal structure within COM calculi is an accurate predictor of increased fragility to lithotripter SW’s.
Methods
COM stones (4-10 mm in diameter) were obtained as discards from a stone analysis laboratory (Beck Analytical Services, Indianapolis, IN); each had been labeled as ≥94% COM by analysis either of a cohort stone or a portion of the stone used for this study. Each stone was scanned with a Scanco mCT20 micro CT system (voxel size from 18 to 34 μm) to verify composition [20] (found to be 98±4% pure COM, mean ±s.d., for 47 stones) and also for assessment of heterogeneity (presence of pronounced lobulation, voids, or apatite inclusions) by four blinded observers (method described below). Stones were weighed dry, and a mean diameter of each stone was calculated from the stone volume found by micro CT, assuming a spherical shape for the stone. Stones were then packed in degassed water in plastic tubes, separated by absorbent paper, and further degassed under vacuum to help prevent the inclusion of bubbles. After three days of hydration the stones were scanned using helical CT (Phillips Brilliance 64, 80 kV, 297 mA, 0.67 mm slice width, with reconstruction at 0.33 mm intervals), with bags of saline surrounding the plastic tubes to reduce beam hardening artifact. As with micro CT, heterogeneity was assessed by two blinded observers, using viewing windows freely selected by each observer; however, 5 stones were chosen by the first observer to demonstrate to the second observer the definitions of ‘homogeneous’ and ‘structured,’ and these stones were not included in the analysis for helical CT. Regions of interest were drawn using the center slice of each stone, within a region thresholded at 75% of the maximum value [21], and maximum, minimum, and average Hounsfield unit values were recorded. Examples of a homogeneous stone and stones consistently graded as containing structure are shown in Figure 1.
Figure 1.

Examples of COM calculi judged by all observers to be homogeneous (leftmost column) or showing internal structure (other columns). Each column shows one stone, with the topmost image a surface rendering from micro CT, the middle image a slice from micro CT, and the bottom image a slice from helical CT. Grayscale of images was adjusted for maximum viewing detail, and does not accurately reflect x-ray attenuation values.
Stones were broken in randomized order in a lithotripter (Dornier Doli-50, power level 4, 2 Hz) over 2 mm mesh, and SW’s counted. In previous studies in which we had broken stones over a 2 mm mesh, we noticed that many natural stones tended to have a single, last fragment that persisted for many SW’s before finally falling through the mesh, and sometimes persisting until the maximum number of SW’s was delivered. Because these last fragments were quite small, it seemed that the additional SW’s required to break a last, tiny fragment would lead to an overestimation of the resistance of the stone to SW’s. In the present study, we tracked this phenomenon, and recorded the SW number at which the stone was reduced to a single, last fragment, producing for each stone a number of SW’s to last fragment, and a number of SW’s to completion (when the last fragment broke or fell through the mesh). A high-definition video camera was used to magnify the image of the stone-basket interface to help visualize the last fragment and precisely the moment when it fell through the mesh. In one stone, the last fragment persisted through 2000 SW’s, which was the predetermined endpoint for the experiment, and that fragment was collected for further study. The fragment was scanned using a Skyscan 1072 micro CT system (Skyscan, Antwerp, Belgium; 100 kV with no filter) and reconstructed at 13.7μm voxel size. It was then analyzed by transmission infrared spectroscopy in KBr pellets using a Nicolet Avatar 330 FT-IR spectrometer (Thermo Scientific, Waltham, MA, USA).
Statistics
Observer agreement was assessed using the kappa statistic, calculated as Cohen’s κ for two observers using the software JMP IN 5.1 (SAS, Cary, NC), or as Fleiss’ κ for more than two observers [22]. For the κ statistic, the strength of agreement beyond chance is ranked as fair for 0.2<κ≤0.4, moderate for 0.4<κ≤0.6, substantial for 0.6<κ≤0.8, and almost perfect for 0.8<κ≤1.0 [23]. For SW number and other data, correlation was assessed using least squares regression, and groups were compared by analysis of variance, using the t-test or the Tukey-Kramer HSD test for means comparisons, as appropriate. A probability value of less than 0.05 was considered significant.
Results
Use of SW’s to last fragment as appropriate measure of stone fragility
When the stones were broken with SW lithotripsy, over half required a substantial number of SW’s after the last fragment was the only piece left on the 2 mm mesh; the median number of additional SW’s required for the last fragment was 35.4% of the number administered before that point. However, some stones required over ten times as many SW’s for the last fragment to fall as for the fragmentation of the bulk of the stone, such that the mean value for percent of SW’s for the last fragment was skewed to 108.4%. When comparing SW’s to last fragment with stone size, the number of SW’s correlated significantly both with stone weight (p<0.0001) and stone diameter (p<0.0004). In contrast, the total number of SW’s for all fragments to fall through the mesh correlated poorly with stone size (p=0.05 for weight, p=0.06 for diameter). Thus, SW’s-to-last-fragment was determined to be the more useful measure of stone fragility for this study, and is the number shown for comminution below.
In one stone, the last fragment was still retained on the mesh after 2000 SW’s had been delivered. By micro CT, the fragment was homogeneous in x-ray attenuation, consistent with a composition of COM, and IR spectroscopy showed the fragment to be composed entirely of COM. There was no indication of an unusual composition (such as a content of fibers) that would make this fragment difficult to break. It measured approximately 2 mm across, with a total volume of 4.2 mm3 (Figure 2).
Figure 2.
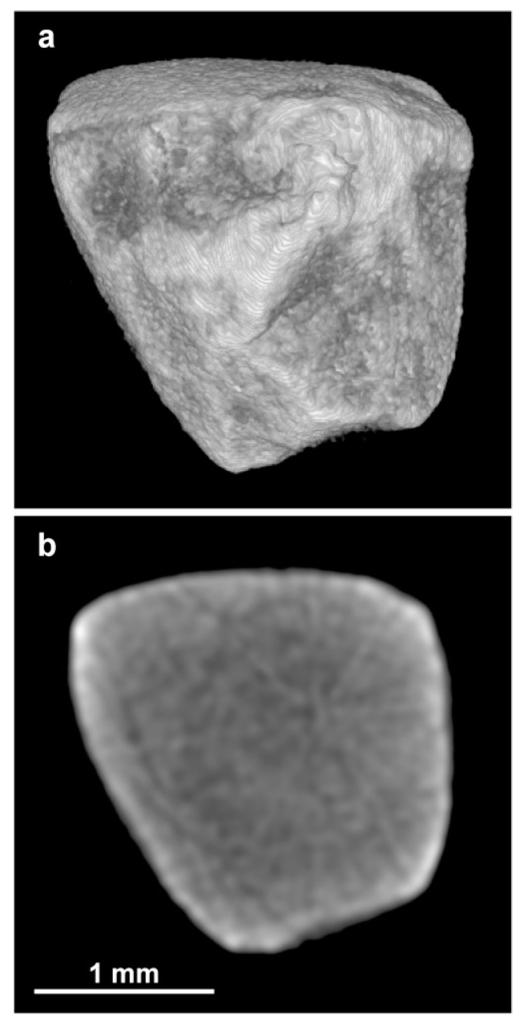
Fragment of COM stone that did not fall through 2 mm mesh even after 2000 SW’s. Shown is surface rendering of micro CT images (a) and slice through middle of stone (b). The radial shadows through the middle of the slice image are reconstruction artifact, and the brightness at the edge of the stone is due to beam hardening artifact. Careful examination of the serial slices showed no evidence of content other than COM in this fragment.
Stone structure and stone fragility
About a third of the COM stones (34%) were judged to be homogeneous in composition/structure (see Figure 1). The rest of the stones were judged by one or more observers to show internal structure, such as regions of apatite or radiolucent voids, or both apatite and voids (Figure 1, right three columns). Classification of stone structure using micro CT was highly repeatable among observers (κ=0.81), and also predictive of stone fragility (Figure 3a). Stones graded as homogeneous required 1874±821 SW/g for comminution (n=16), while heterogeneous stones required half as many SW/g, 912±678 (n=25, p<0.001). When observers did not agree as to stone heterogeneity, fragility was intermediate between these groups (1249±598, n=6). Stones were also graded as to presence of internal cracks (probably due to previous handling) and as to whether they appeared to be intact or a fragment of a larger stone; neither the presence of cracks (in 5 stones of 47 total, p=0.20), nor the appearance of being intact (10 stones of 47 total, p=0.37) had a significant effect on stone fragility.
Figure 3.

Number of SW’s-to-last-fragment, normalized to stone weight, for stones judged to be homogeneous in composition/structure (no internal structure) and when stones were seen to have internal structure. a: Micro CT images of stones were used for judging composition/structure. b: Helical CT images were used. Each circle represents a single stone; columns show mean SW count to last fragment for each group. Significance of differences between ‘No internal structure’ and ‘Internal structure’ was tested using Tukey-Kramer HSD test, with data from all three groups included.
When stones were graded by appearance on helical CT, classification was repeatable (κ=0.40), and homogeneous stones required more SW’s for comminution than did heterogeneous stones (1702±993 SW/g, compared to 907±773, p<0.03, Figure 3b). Again, when observers did not agree, the number of SW’s to comminution was intermediate in value (1340±482, n=13). Stone fragility normalized to stone size did not correlate with simple measurement of average Hounsfield units measured by helical CT (Figure 4). Similarly, neither minimum nor maximum Hounsfield unit values correlated with stone fragility (p=0.59 and p=0.76, respectively).
Figure 4.

Number of SW’s-to-last-fragment for COM stones plotted against the average Hounsfield unit values for each stone, as measured by helical CT. Stone fragility showed no correlation with Hounsfield unit values.
Discussion
The concept of viewing urinary stones by x-ray to evaluate their ability to be treated by SW’s dates back to the earliest days of lithotripsy [4]. At that time it was already known that some stones could be SW-resistant, and it was thought that x-ray at diagnosis could be used to avoid subjecting the patient to an ineffective procedure. It is now known that lithotripter SW’s can cause significant renal injury [7], and that SW trauma may be contributory to subsequent development of other disorders [24,25]. Thus, the application of unnecessary SW’s should be considered a risk to the patient, and it would be of value to determine in advance the dose of SW’s required for a given stone.
Dretler and Polykoff sought to distinguish the relative fragility of different calcium oxalate stones by their appearance on plain x-ray [26]. The present study is a refinement of this approach, utilizing the powerful ability of CT to display the internal structure of urinary stones [18,20]. The results demonstrate that COM stones that show visible structure on CT are more fragile to SW’s than COM stones that appear to be homogeneous in their structure (Figure 3). For some stones, the stone shape may also have been seen by observers to indicate internal structure (see especially the highly lobulated stone in Figure 1). This correlation between stone appearance by CT and susceptibility to SW’s is consistent with results from numerical modeling showing that irregularities in the structure of the stone can act as sites for focusing of SW energy [27], so that the stone may break more easily. Stone shape can also have profound effects on the interaction of SW’s with a stone [28,29].
In the present study, the Hounsfield unit values of COM stones did not correlate with their fragility to SW’s (Figure 4). This result differs from several published studies [9-11,13,14]. The likely explanation for this discrepancy is that the fragility data in the present study were normalized to stone size, a procedure that was not done in any of the previous studies. As has been described elsewhere, the resolution of clinical CT is such that the x-ray attenuation values correlate well with stone size [15,16], and thus the number of SW’s to comminution can correlate with Hounsfield unit values as a simple prediction of the larger stones requiring more SW’s [5,16]. The approach in the present study avoids that error, and the result is that Hounsfield units are not a predictor of stone fragility.
A methodological note of importance involves the choice in the present study of using the number of SW’s required to reach a single, small fragment as the end-point for assessing stone comminution. These last fragments were all quite small (2 mm or smaller, Figure 2) and their small size may have contributed to their resistance to SW’s, as the mechanism of spallation operates poorly on fragments smaller than the spatial thickness of the SW [30]. Counting the number of SW’s to complete breakage is viewed as a clinically relevant measure of stone comminution [31]. The adjustment of this protocol used in the present study may make the assessment of stone fragility more realistic, as it avoids overestimation of SW number due to the SW-resistance of fragments that are so small as to be clinically insignificant.
In summary, COM stones of homogeneous composition required almost twice as many SW’s to comminute than COM stones that showed internal stone structure by CT. This suggests that stone fragility in patients could be predicted using pre-treatment CT imaging. The findings also show that Hounsfield unit values of COM stones did not correlate with stone fragility. Thus, it is stone morphology, rather than apparent x-ray attenuation, which correlates with fragility to SW’s in this common stone type.
Acknowledgements
Thanks to Josh Neucks for help with the lithotripsy; Jonathan VonDerHaar, Naseem Khan, and T.J. Zancanero for help with grading images; and to Cary Pritchard for assistance with FT-IR. Supported by NIH R01 DK59933 and P01 DK43881.
Contributor Information
Chad A. Zarse, Department of Anatomy and Cell Biology, 635 Barnhill Drive, Indianapolis, IN 46202, USA
Tariq A. Hameed, Department of Radiology, Indiana University School of Medicine, 550 N. University Boulevard, Indianapolis, IN 46202, USA
Molly E. Jackson, Department of Anatomy and Cell Biology, 635 Barnhill Drive, Indianapolis, IN 46202, USA
Yuri A. Pishchalnikov, Department of Anatomy and Cell Biology, 635 Barnhill Drive, Indianapolis, IN 46202, USA
James E. Lingeman, Methodist Hospital Institute for Kidney Stone Disease, 1801 North Senate Boulevard, Suite 220, Indianapolis, IN 46207, USA
James A. McAteer, Department of Anatomy and Cell Biology, 635 Barnhill Drive, Indianapolis, IN 46202, USA
James C. Williams, Jr., Department of Anatomy and Cell Biology, 635 Barnhill Drive, Indianapolis, IN 46202, USA
References
- 1.Schubert G. Stone analysis. Urol Res. 2006;34:146–150. doi: 10.1007/s00240-005-0028-y. [DOI] [PubMed] [Google Scholar]
- 2.Daudon M, Donsimoni R, Hennequin C, Fellahi S, Le Moel G, Paris M, Troupel S, Lacour B. Sex and age-related composition of 10617 calculi analyzed by infrared-spectroscopy. Urol Res. 1995;23:319–326. doi: 10.1007/BF00300021. [DOI] [PubMed] [Google Scholar]
- 3.Bon D, Dore B, Irani J, Marroncle M, Aubert J. Radiographic prognostic criteria for extracorporeal shock-wave lithotripsy: a study of 485 patients. Urology. 1996;48:556–560. doi: 10.1016/s0090-4295(96)00251-8. discussion 560-551. [DOI] [PubMed] [Google Scholar]
- 4.Dretler SP. Stone fragility—a new therapeutic distinction. J Urol. 1988;139:1124–1127. doi: 10.1016/s0022-5347(17)42801-1. [DOI] [PubMed] [Google Scholar]
- 5.Williams JC, Jr., Saw KC, Paterson RF, Hatt EK, McAteer JA, Lingeman JE. Variability of renal stone fragility in shock wave lithotripsy. Urology. 2003;61:1092–1096. doi: 10.1016/s0090-4295(03)00349-2. [DOI] [PubMed] [Google Scholar]
- 6.Williams JC, Jr., Kim SC, Zarse CA, McAteer JA, Lingeman JE. Progress in the use of helical CT for imaging urinary calculi. J Endourol. 2004;18:937–941. doi: 10.1089/end.2004.18.937. [DOI] [PubMed] [Google Scholar]
- 7.Evan AP, Willis LR, Lingeman JE, McAteer JA. Renal trauma and the risk of longterm complications in shock wave lithotripsy. Nephron. 1998;78:1–8. doi: 10.1159/000044874. [DOI] [PubMed] [Google Scholar]
- 8.Dretler SP, Spencer BA. CT and stone fragility. J Endourol. 2001;15:31–36. doi: 10.1089/08927790150500926. [DOI] [PubMed] [Google Scholar]
- 9.Joseph P, Mandal AK, Singh SK, Mandal P, Sankhwar SN, Sharma SK. Computerized tomography attenuation value of renal calculus: can it predict successful fragmentation of the calculus by extracorporeal shock wave lithotripsy? A preliminary study. J Urol. 2002;167:1968–1971. doi: 10.1016/s0022-5347(05)65064-1. [DOI] [PubMed] [Google Scholar]
- 10.Pareek G, Armenakas NA, Fracchia JA. Hounsfield units on computerized tomography predict stone-free rates after extracorporeal shock wave lithotripsy. J Urol. 2003;169:1679–1681. doi: 10.1097/01.ju.0000055608.92069.3a. [DOI] [PubMed] [Google Scholar]
- 11.Gupta NP, Ansari MS, Kesarvani P, Kapoor A, Mukhopadhyay S. Role of computed tomography with no contrast medium enhancement in predicting the outcome of extracorporeal shock wave lithotripsy for urinary calculi. BJU Int. 2005;95:1285–1288. doi: 10.1111/j.1464-410X.2005.05520.x. [DOI] [PubMed] [Google Scholar]
- 12.Magnuson WJ, Tomera KM, Lance RS. Hounsfield unit density accurately predicts ESWL success. Alaska Med. 2005;47:6–9. [PubMed] [Google Scholar]
- 13.Wang L-J, Wong Y-C, Chuang C-K, Chu S-H, Chen C-S, See L-C, Chiang Y-J. Predictions of outcomes of renal stones after extracorporeal shock wave lithotripsy from stone characteristics determined by unenhanced helical computed tomography: a multivariate analysis. Eur Radiol. 2005;15:2238–2243. doi: 10.1007/s00330-005-2742-9. [DOI] [PubMed] [Google Scholar]
- 14.Yoshida S, Hayashi T, Ikeda J, Yoshinaga A, Ohno R, Ishii N, Okada T, Osada H, Honda N, Yamada T. Role of volume and attenuation value histogram of urinary stone on noncontrast helical computed tomography as predictor of fragility by extracorporeal shock wave lithotripsy. Urology. 2006;68:33–37. doi: 10.1016/j.urology.2006.01.052. [DOI] [PubMed] [Google Scholar]
- 15.Saw KC, McAteer JA, Fineberg NS, Monga AG, Chua GT, Lingeman JE, Williams JC., Jr. Calcium stone fragility is predicted by helical CT attenuation values. J Endourol. 2000;14:471–474. doi: 10.1089/end.2000.14.471. [DOI] [PubMed] [Google Scholar]
- 16.Williams JC, Jr., Zarse CA, Jackson ME, Lingeman JE, McAteer JA. In: Evan AP, Lingeman JE, Williams JC Jr., editors. Using helical CT to predict stone fragility in shock wave lithotripsy (SWL); Renal Stone Disease: Proceedings of the First International Urolithiasis Research Symposium; Melville, NY: American Institute of Physics; 2007. [Google Scholar]
- 17.Nakada SY, Hoff DG, Attai S, Heisey D, Blankenbaker D, Pozniak M. Determination of stone composition by noncontrast spiral computed tomography in the clinical setting. Urology. 2000;55:816–819. doi: 10.1016/s0090-4295(00)00518-5. [DOI] [PubMed] [Google Scholar]
- 18.Williams JC, Jr., Paterson RF, Kopecky KK, Lingeman JE, McAteer JA. High resolution detection of internal structure in renal calculi by helical computerized tomography. J Urol. 2002;167:322–326. [PubMed] [Google Scholar]
- 19.Bellin M-F, Renard-Penna R, Conort P, Bissery A, Meric JB, Daudon M, Mallet A, Richard F, Grenier P. Helical CT evaluation of the chemical composition of urinary tract calculi with a discriminant analysis of CT-attenuation values and density. Eur Radiol. 2004;14:2134–2140. doi: 10.1007/s00330-004-2365-6. [DOI] [PubMed] [Google Scholar]
- 20.Zarse CA, McAteer JA, Sommer AJ, Kim SC, Hatt EK, Lingeman JE, Evan AP, Williams JC., Jr. Nondestructive analysis of urinary calculi using micro computed tomography. BMC Urology. 2004;4:15. doi: 10.1186/1471-2490-4-15. [DOI] [PMC free article] [PubMed] [Google Scholar]
- 21.Saw KC, McAteer JA, Monga AG, Chua GT, Lingeman JE, Williams JC., Jr. Helical CT of urinary calculi: Effect of stone composition, stone size, and scan collimation. AJR Am J Roentgenol. 2000;175:329–332. doi: 10.2214/ajr.175.2.1750329. [DOI] [PubMed] [Google Scholar]
- 22.Fleiss JL. Measuring nominal scale agreement among many raters. Psychol Bull. 1971;76:378–381. [Google Scholar]
- 23.Kundel HL, Polansky M. Measurement of observer agreement. Radiology. 2003;228:303–308. doi: 10.1148/radiol.2282011860. [DOI] [PubMed] [Google Scholar]
- 24.Lingeman JE, Delius M, Evan AP, Gupta M, Sarica K, Strohmaier W, McAteer JA, Williams JC., Jr. Committee 8: Bioeffects and Physical Mechanisms of SW Effects in SWL. In: Segura J, Conort P, Khoury S, Pak C, Preminger GM, Tolley D, editors. Stone Disease 1st International Consultation in Stone Disease. Health Publications; Paris: 2003. [Google Scholar]
- 25.Krambeck AE, Gettman MT, Rohlinger AL, Lohse CM, Patterson DE, Segura JW. Diabetes Mellitus and Hypertension Associated with Shock Wave Lithotripsy of Renal and Proximal Ureteral Stones at 19 Years Follow-up. J Urol. 2006;175:1742–1747. doi: 10.1016/S0022-5347(05)00989-4. [DOI] [PubMed] [Google Scholar]
- 26.Dretler SP, Polykoff G. Calcium oxalate stone morphology: Fine tuning our therapeutic distinctions. J Urol. 1996;155:828–833. doi: 10.1016/s0022-5347(01)66319-5. [DOI] [PubMed] [Google Scholar]
- 27.Cleveland RO, Tello JS. Effect of the diameter and the sound speed of a kidney stone on the acoustic field induced by shock waves. Acoustic Research Letters Online. 2004;5:37–43. [Google Scholar]
- 28.Cleveland RO, Sapozhnikov OA. Modeling elastic wave propagation in kidney stones with application to shock wave lithotripsy. J Acoust Soc Am. 2005;118:2667–2676. doi: 10.1121/1.2032187. [DOI] [PubMed] [Google Scholar]
- 29.Sapozhnikov OA, Maxwell AD, MacConaghy B, Bailey MR. A mechanistic analysis of stone fracture in lithotripsy. J Acoust Soc Am. 2007;121:1190–1202. doi: 10.1121/1.2404894. [DOI] [PubMed] [Google Scholar]
- 30.Zhu S, Cocks FH, Preminger GM, Zhong P. The role of stress waves and cavitation in stone comminution in shock wave lithotripsy. Ultrasound Med Biol. 2002;28:661–671. doi: 10.1016/s0301-5629(02)00506-9. [DOI] [PubMed] [Google Scholar]
- 31.McAteer JA, Williams JC, Jr., Cleveland RO, Van Cauwelaert J, Bailey MR, Lifshitz DA, Evan AP. Ultracal-30 gypsum artificial stones for research on the mechanisms of stone breakage in shock wave lithotripsy. Urol Res. 2005;33:429–434. doi: 10.1007/s00240-005-0503-5. [DOI] [PubMed] [Google Scholar]