Abstract
Rationale and Objectives
We sought to demonstrate the viability of microcomputed tomographic colonography (µCTC) as a tool for monitoring tumorigenesis in mouse models of human colorectal cancer during prospective longitudinal studies. The precision and accuracy of volumetric measurements were determined to assess whether changes in tumor volume over time were readily detectable.
Materials and Methods
All animal studies were conducted under the guidelines set forth by the Institutional Animal Care and Use Committee of the American Association for Assessment and Accreditation of Laboratory Animal Care. µCTC was performed on C57BL/6J (B6) mice carrying the Min allele of Apc, ultimately yielding 18 scans. Assessments of scan quality and tumor volume were both performed once a week over a period of eight weeks.
Results
Scans with a good quality rating had a mean standard deviation in tumor volume measurement of 8%. By contrast, scans with a poor quality rating had a mean standard deviation in tumor volume measurement of 35%. Variables affecting µCTC scan quality in living mice included bowel preparation, motion artifact, and tumor morphology. Tumor volume measurements were highly correlated with tumor weight (r2=0.87).
Conclusion
The reproducibility of tumor volume measurement at µCTC in living mice makes prospective longitudinal evaluation of colonic tumor response feasible. For µCTC scans of good quality, a 16% change in tumor volume can be detected at the 95% confidence level.
Keywords: microCT virtual colonoscopy, Min mouse, colorectal cancer, tumor volume
Introduction
Colorectal cancer is the second leading cause of cancer-related mortality in the United States. The American Cancer Society projects 153,760 new cases of colon and rectal cancer for 2007 (1). Importantly, colorectal cancer is largely preventable if detected early. The five-year survival rate for a stage I diagnosis is 90% (1). Unfortunately, only 39% of cases are detected at this stage, owing to low rates of screening and patient compliance (1). While optical colonoscopy is the current gold standard for the detection of colorectal neoplasia, computed tomographic colonography (CTC) is rapidly emerging as a viable less invasive alternative. CTC touts the noteworthy advantage of not requiring sedation or pain control. In addition, one study has reported sensitivity comparable to that of optical colonoscopy (2).
Pickhardt, Halberg and colleagues described the ability to reliably detect colonic tumors in living mice using microcomputed tomographic colonography (µCTC) (3). They found that µCTC has good sensitivity (93.3%) and specificity (98.5%) for in vivo detection of polyps with a maximum diameter greater than 2 mm. This experimental platform permits prospective longitudinal evaluation of tumorigenesis in the mammalian colon and has two major advantages over a cross-sectional study design. First, individual tumors can be monitored serially, eliminating animal-to-animal variation and ultimately reducing the number of mice needed to achieve high statistical power (4). Second, specific tumors can be identified as either responders or non-responders and then studied ex vivo to assess differences at the molecular level.
Noting these major advantages of prospective longitudinal evaluation with µCTC, we sought to address the issue of reader precision for measurement of tumor volume as a potential limitation of this experimental platform. For example, if a tumor volume changes by 20% from one week to the next, it is conceivable that the change might simply reflect variability in the volume measured by the reader. Precision is different from accuracy, which measures correctness. Strictly speaking, only precision is necessary to monitor tumor volume change. If the reader consistently overestimates the volume by 10%, the relative change measured would be the same as if the reader was perfectly accurate.
Two major evolutions in µCTC enhance the methodology of this study. First, we benefited from second generation microCT technology with faster scan times, better resolution and higher energy x-rays. Second, we used 3D isosurface renderings to aid in volumetric measurements. A recent clinical study found that volumes are superior to linear measurements for monitoring the growth of colorectal polyps in humans (5).
Materials and Methods
Mouse Model
All animal studies were conducted under the guidelines set forth by the Institutional Animal Care and Use Committee of the American Association for Assessment and Accreditation of Laboratory Animal Care. The strain used in this study was created by backcrossing the Multiple intestinal neoplasia (Min) allele of the Apc gene (6) from the C57BL/6J background onto the C57BL/6J Tyr2c/2c genetic background (3). This strain was a particularly useful model for our study because the incidence of colonic tumors is relatively high compared with other mouse models of human colorectal cancer.
Bowel Preparation
Min mice were maintained on the defined AIN-93G diet (Harlan Teklad, Madison, WI) and water ad libitum. In our experience, a defined diet obviates beam hardening artifacts resulting from bone meal that is often present in standard rodent chow. At 16 hours prior to scanning, water was replaced with PEG-3350 NuLYTELY (Braintree Labs, Braintree, MA) to facilitate colonic cleansing. Mice were anesthetized with pentobarbital and given an enema (3–6 ml) of phosphate buffered saline (PBS). The enema was done with a gavage needle while holding the mouse head-up to allow the PBS to drain. Care was taken to prevent PBS from passing the loop of the proximal colon, where it cannot drain. Residual PBS in the colon increases risk of reflux and aspiration during insufflation. The colon was then insufflated with air (2–4 ml) for contrast. Too little air is insufficient for good contrast and too much air inflates the cecum to the point of crowding the adjacent colon. Over-insufflation can also increase pressure on the diaphragm, making it difficult for the mouse to breathe. The syringe used for insufflation was tipped with enough surgical lubricant (Fougera, Melville, NY) to create an air-tight seal. The syringe was kept in place during the scan by securing it to the tail with surgical tape.
MicroCT Technique
In a retrospective review of 62 scans, 18 were chosen as the raw data for this study based on the criteria of having exactly one colonic tumor in the field of view. Acquisitions were performed with mice in the prone position using a MicroCAT II (Siemens, Knoxville, TN) at 80 kVp, 500 uA, and 360 degree rotation. The flat panel detector was opened to 3072 × 3072 detector elements which yielded data sets ~400 MB in size. Scans were not gated and were collected over a period of 10 minutes, which is typical for microCT. Reconstruction was done in real time by filtered back projection using a Shepp-Logan filter. The resulting isotropic volume voxel size was 91×91×91 microns, which was more than adequate to resolve polyps over 2–3 cubic millimeters in size.
µCTC Scan Analysis
Each of the 18 scans from three mice was analyzed once a week over an eight-week period for a total of 144 data points. The reader (B.Y.D) was blinded to his previous results and any preexisting gross measurements made ex vivo. Reading order for each weekly analysis was randomized. All scans were read and analyzed in Amira 4.1 (Mercury Computer Systems, Chelmsford, MA). Scans were assessed based on transverse, coronal, and sagittal planes, and using a 3D isosurface rendering. The use of back-face isosurface rendering was a practical and somewhat novel approach which permitted “fly-arounds” previously described for clinical virtual colonoscopy (7). Fly-arounds were used extensively for detection of small lesions (< 10 mm3) and for segmentation in cases where the in-plane view did not adequately capture the morphology of the tumor. It has been demonstrated in human clinical trials that primary 3D polyp detection at CTC screening may be more accurate than primary 2D polyp detection (2). Although clinical studies implement fly-throughs, we found fly-arounds to be much more efficacious. To our knowledge, this is the first use of 3D renderings as an integral part of µCTC.
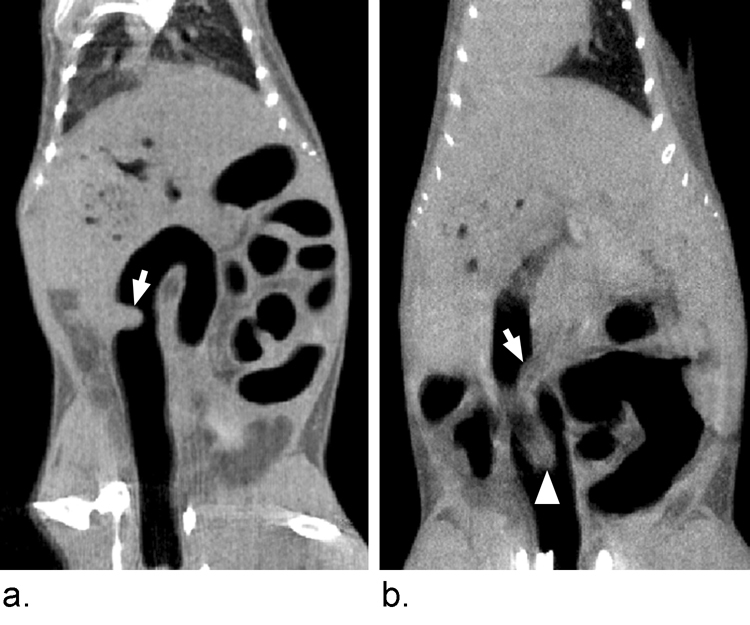
Window level and threshold settings were optimized on a case-by-case basis since the grayscale was arbitrary rather than calibrated to Hounsfield units. The first reader (B.Y.D.) had significant prior µCTC experience, having viewed hundreds of scans. Each reading consisted of rating the scan quality on a scale of good-fair-poor according to the criteria listed in Table 1, and then segmenting the tumor region of interest. While scan quality is known to be variable with instrumentation, tube current and voltage, these hardware parameters were held constant in our protocol. In this study, we specifically addressed scan quality as a function of animal preparation, motion artifact, and tumor morphology (Table 1; Figure 1).
TABLE 1.
Criteria for scan quality rating of µCTC studies.
| Rating | Criteria |
|---|---|
| Good | Meets at least three of the four criteria: good colon distension, no motion artifact, typical polypoid tumor shape, and well-defined tumor margins. |
| Fair | Meets two of the four criteria. |
| Poor | Meets only one of the four criteria, or else reproducible segmentation is deemed not possible. |
Figure 1.
Scan quality is variable. Image A was consistently rated as good due to good colonic distension, low motion artifact, typical shape and well-defined tumor margins. Image B was consistently rated poor due to motion artifact, ill-defined tumor margins and proximity of a fecal pellet (arrowhead) to the tumor (arrow). Approximately 78% of microCT colonoscopies currently done in our lab are good or better.
To determine robustness of the segmentation process, two inexperienced readers (S.R.M. and C.N.R.) analyzed six good scans once a week over a six-week period for a total of 72 data points. The precision of their tumor volume measurements was compared to each other and to that of the experienced reader.
Tumor Volume Measurement
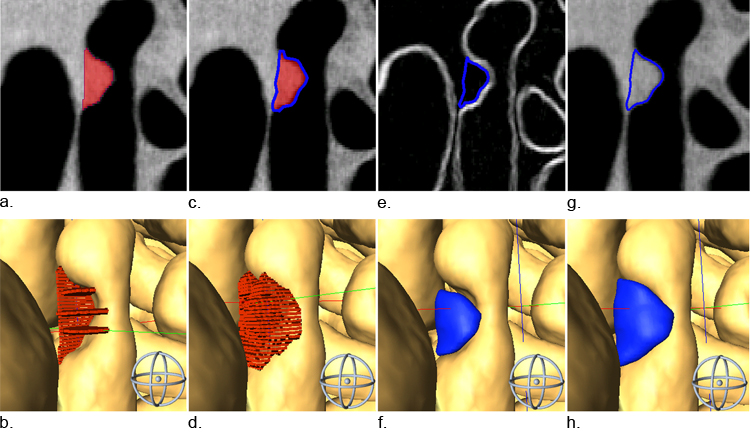
The process of measuring tumor volume was rigorously designed to minimize reader subjectivity (Figure 2). Segmentation was done by partitioning the digital image into tumor and non-tumor regions. We began by manually outlining the tumor in select planes of each orthogonal view. These outlines served as the skeleton for Amira’s “wrap” filter (Figure 2, Panels A and B), which is an algorithm based on scattered data interpolation with radial basis functions. Using a wrap filter was advantageous because the reader was not forced to delineate nebulous boundaries. Instead, the reader picked the least ambiguous 2D boundaries as samples of the entire volume and left interpolation to the computer algorithm (Figure 2, Panels C and D).
Figure 2.
The segmentation process is rigorously designed to minimize reader subjectivity. One or several slices in each orthogonal plane are selected to use as the skeleton for our segmentation volume (A, B). Next a wrap filter is applied (C, D) using an algorithm based on scattered data interpolation with radial basis functions. The volume is trimmed using a gradient image (E, F). Finally, a morphological 3D dilation filter is applied (G, H). Images in the bottom row are 3D renderings of 2D segmentations in the top row.
To further constrain the volume to objective boundaries, the volume was trimmed using a gradient image (Sobel 3D filter) where high-intensity pixels delineate boundaries (Figure 2, Panel E). Trimming often resulted in satellite segments called “islands” that were not contiguous with the main tumor. Residual islands of 15 pixels or less were automatically removed. Larger islands required verification by the reader before they were removed. The result of gradient trimming was often an underestimate of the apparent volume (Figure 2, Panels E and F). Therefore, the final step of the segmentation process was the application of a 3D morphological dilation filter, which expanded the volume by one voxel in every direction (Figure 2, Panels G and H). The entire volume segmentation process took 5 to 20 minutes depending on the particular data set.
Correlation Coefficient
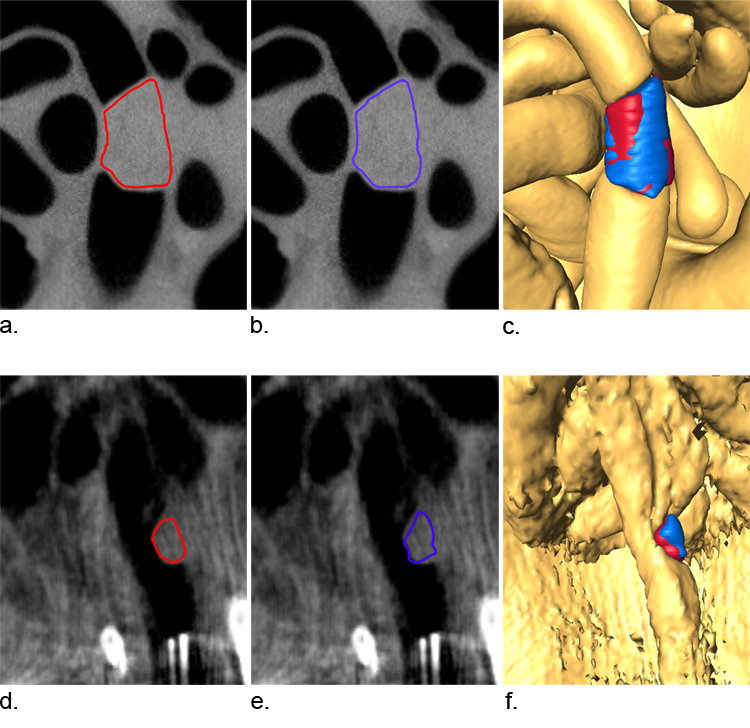
Scan quality ratings and tumor volume measurements are the most basic figures of merit. While consistent volume measurements may indicate a high level of precision, tumor volume alone is not sufficient to assess reproducibility since two determinations of a single tumor could have similar volumes, but actually share modest overlap in three dimensional space (Figure 3). For this reason, we used region-of-interest correlation as an additional figure of merit to verify consistent position and morphology. The segmented volumes were loaded simultaneously and correlation coefficients were calculated for each possible combination to access intra- and inter-reader reliability. For this, we used the Pearson product-moment correlation coefficient, ρ, which is the ratio of the covariance of two segmented volumes to the product of their standard deviations.
The random variables, X and Y, are volumes defined by two distinct segmentation attempts. The covariance of X and Y is defined by,
The product of the sample standard deviations σX and σY is defined by,
where the sum is from i=1 to n voxels. The correlation coefficient was an indication of the relative number of voxels in common between two segmented volumes, i.e., how well the two volumes match up. A correlation coefficient of 0 indicated no overlap between two volumes in space and a coefficient of 1 indicated perfect alignment with respect to morphology and position.
Figure 3.
The importance of measuring 3D correlation is illustrated by two segmentation attempts shown in blue and red. Panels A and B show two segmentation attempts of a tumor in a good scan. The reader made similar decisions regarding tumor boundary and the 3D rendering shows a significant amount of volume in common (C). The volumes were 49.3 mm3 (A) and 49.9 mm3 (B) and the correlation in 3D space was 95.4%. Panels D and E show two segmentation attempts of a tumor in a poor scan. The reader had difficulty with precise segmentation and the result was less volume in common (F). The volumes measured for these scans were coincidently both 3.5 mm3 but the correlation in 3D space was only 73.5%. This example demonstrates why volume measurements alone are not sufficient to evaluate precision.
Reader Drift
Reader drift is a phenomenon whereby, over time, the reader becomes more or less stringent in delineating tumor margins (8). To test for this, we plotted the mean tumor volume Vbar as a function of trial number,
where t is the trial number or segmentation attempt ranging from 1 through 8, m is the particular mouse, and Δ is the scan number ranging 1 through 18.
Recall Bias
We addressed the possibility of recall bias, whereby the reader is inadvertently affected by previous experience. Improved reading ability over time might indicate recall bias of segmentation patterns from one trial to the next. If this were the case, we would expect a trend of increasing correlation coefficients, Rbar,
where t is the segmentation attempt or trial number ranging 1 through 8, m is the particular mouse, and Δ is the scan number ranging 1 through 18.
Accuracy
Tumor volume measurements were compared to tumor weights to determine accuracy. Four mice were scanned and then sacrificed. The colon was removed from each animal, laid out on bibulous paper, splayed open longitudinally, fixed for 16 hours in 10% buffered formalin, and stored in 70% ethanol. Each tumor was photographed to document gross morphology and position, air-dried for 10 minutes, and weighed on a Mettler analytical balance. A total of seven tumors were observed. Tumor volumes that were measured from µCTC scans by the experienced reader (B.Y.D) were plotted versus the tumor weights that had been determined by a different investigator (R.B.H). Linear regression analysis was performed to determine the correlation between the two types of measurements.
Statistical Methods
All distributions for scan quality ratings, volume measurements and correlation coefficients were assumed to be Gaussian. Distribution means for reader drift and recall bias were compared by one- and two-sided Wilcoxon rank sum tests, respectively. The probability distribution of scan ratings and volume measurements used to estimate positive predictive values were calculated using a cumulative distribution function.
Results
We sought to evaluate the limits of µCTC as a tool for measuring tumor response in living mice during prospective longitudinal studies. This analysis included an assessment of scan quality and the determination of tumor volume.
Consistency of Scan Rating
The readings that were performed by the experienced reader (B.Y.D.) were binned into three categories by quality rating (Table 1): 56 received a rating of good, 48 fair, and 40 poor. The average standard deviation for all scan ratings was 0.39, indicating consistent assessment of quality. Good scans had a mean tumor volume of 16.08 mm3, whereas poor scans had a mean tumor volume of 8.05 mm3 (Table 2; p=0.04). Thus, scans with larger tumors tend to be rated higher because segmentation of these volumes is easier.
TABLE 2.
Summary of reader consistency in assessing scan quality, tumor volume and tumor morphology.
| Assessment, Mean ± SD |
||||
|---|---|---|---|---|
| Scan Quality | N | Quality Rating | Tumor Volume (mm3) | Correlation Coefficient |
| Good | 56 | 3.7 ± 0.4 | 16.1 ± 1.3 | 0.89 ± 0.03 |
| Fair | 48 | 2.6 ± 0.4 | 11.4 ± 1.6 | 0.82 ± 0.05 |
| Poor | 40 | 1.1 ± 0.3 | 8.1 ± 2.6 | 0.64 ± 0.08 |
Consistency of Tumor Volume Measurement
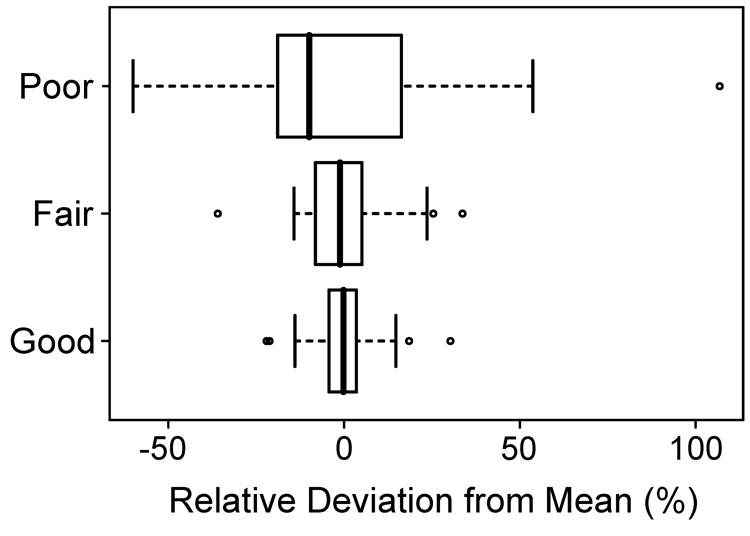
Tumor volume was determined using a semi-automated approach, aided by computer algorithms to minimize reader subjectivity (Figure 2). The precision of tumor volume assessment was highly dependent on scan quality. Good, fair, and poor values had a standard deviation in their measured values of 8%, 14%, and 32%, respectively (Figure 4). This information is particularly useful to making decisions during image acquisition. For example, a scan that is fair is still valid if the change in tumor volume is greater than the standard deviation in the tumor measurement. For good scans, similar results were obtained by both inexperienced readers.
Figure 4.
Precision in volume measurements is related to scan quality. The box plot depicts the smallest observation, lower quartile, median, upper quartile, largest observation and outliers. The standard deviation for all 144 measurements was 19%. The standard deviations for good, fair and poor were 8%, 14% and 32%, respectively.
Since the majority of our scans are of good quality, we address the statistics of these scans in more detail. The cumulative distribution function was used to evaluate the probability of a change in tumor volume, given that a change in volume was detected (Table 3). For example, if the reader measures a volume change of 20%, the probability that the volume has actually changed is 98%, i.e., the reader is confident a change has occurred. However, as the measured change in volume decreases, the reader is less certain that the change is real.
TABLE 3.
Probability that a measured change in tumor volume with good scans is real.
| Measured Change in Tumor Volume | Certainty that Change is Real |
|---|---|
| 5% | 45% |
| 10% | 76% |
| 15% | 92% |
| 20% | 98% |
Consistency of Tumor Volume Correlation
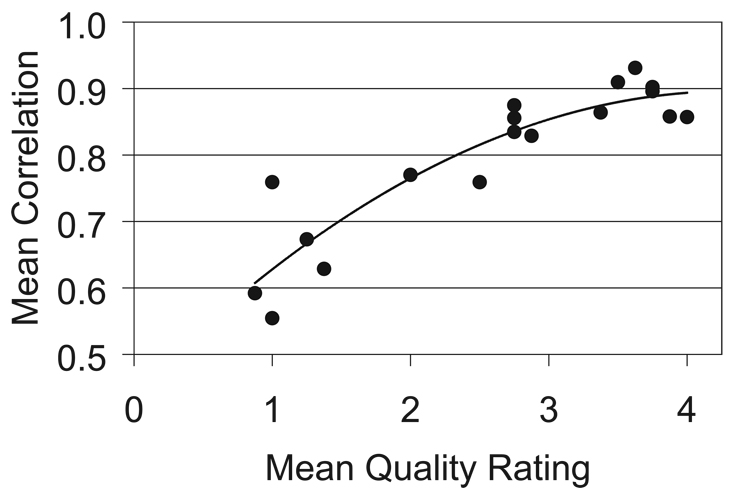
Each tumor was segmented multiple times by either the experienced reader or all three readers. The volumes measured by an individual reader were overlaid to assess whether tumor margins were reproducibly delineated (Figure 3). The correlation coefficient was very high for good scans; the means were 0.89, 0.88, and 0.83 for the experienced reader and the two inexperienced readers, respectively. Thus, the segmentation process is very robust. In fact, volumes measured by different readers overlap in three dimensional space to the same extent as those measured by an individual reader. The correlation coefficients ranged between 0.81 and 0.88. However, the reproducibility of measured volumes depends on scan quality (Table 2; Figure 5). The correlation coefficient was low for poor scans; the mean was 0.64 for the experienced reader. Together, these results confirm the expectation that tumor boundaries from high quality scans are consistently defined, whereas boundary definitions from poor scans vary dramatically.
Figure 5.
Correlation coefficients increase with scan quality. The correlation coefficient is an indication of consistent delineation of tumor margins. Each data point represents the mean of eight segmentations. Quality ratings are >3 for good scans, 2–3 for fair scans, and <2 for poor scans.
Reader Drift
If measurements were affected by reader drift, volumes would have changed over time. Tumor volume measurements are not significantly different between the first and last trials (p=0.77; Wilcoxon rank sum test, two-sided). Thus, reader drift was not a factor.
Recall Bias
We also tested whether the reader was inadvertently influenced by the previous reading. The correlation coefficients from adjacent weeks were compared to the mean correlation coefficients. If the reader were unintentionally recalling volumes, the coefficients between adjacent weeks should be higher on average. The coefficients from adjacent weeks were 1.48% higher on average, which was not statistically significant (p=0.40, Wilcoxon rank sum, one-sided). Thus, recall bias was not a factor.
Accuracy of Tumor Volume Measurements
Tumor volume measurements were accurate in addition to being precise. Tumor volumes correlated with tumor weights (r2=0.87). Tumors with volumes of 1.1, 3.8, 5.5, 5.6, 12.2, 14.3, and 20.7 mm3 weighed 2.8, 3.0, 7.6, 4.7, 13.3, 10.0, 15.3 mg, respectively. Thus, measured volumes are accurate for tumors of various sizes.
Discussion
The resolution of microcomputed tomography is better than 100 microns and it is therefore tempting to assume that the resolvability of in vivo structures is the same. This is not necessarily the case. Reproducibility of tumor measurements is dependent on both scan quality and reader ability. We now have a protocol whereby confidence in tumor volume measurements can be estimated prospectively. Volume measurements from good scans have a standard deviation of 8% (Figure 4), such that 16% changes in tumor volume can be detected at the 95% confidence level. This observation indicates that tumor response during a longitudinal study can be effectively monitored using µCTC. By contrast, fair and poor scans had standard deviations of 14% and 32%, respectively. The relative distributions are summarized in Figure 4. This information is an essential foundation for any longitudinal study using µCTC to monitor tumorigenesis in the mammalian colon.
It is worth noting that our mouse preparation and scanning technique have improved considerably since starting this study. Of the 59 µCTC studies recently performed in the three months following the current study, 46 have been good, 11 fair and 2 poor in scan quality. To increase the overall number of good scans, we have adopted the practice of reviewing images immediately and re-scanning when necessary.
This study has three limitations. First, our analysis addresses only the case of a single colonic tumor. In many situations, high tumor multiplicities complicate the segmentation process due to contiguous margins. Second, the mice are exposed to radiation during each scan which could potentially affect intestinal tumorigenesis. However, the whole-body dose is approximately 0.2 Gy per scan. Third, the results are specific to our methodology and our readers. We do not presume these findings to be universally applicable, even though our inter-reader reliability was very good.
Despite these limitations, this study is a necessary foundation for non-invasive prospective longitudinal studies using µCTC. Investigators using this experimental platform to study therapeutic agents should be aware of the limitations. The high precision of volume measurement at µCTC indicates a specific advantage of longitudinal evaluation over cross-sectional methodology: specific tumors can be identified as partial responders, complete responders or non-responders. These distinctions are especially relevant for investigating therapeutic agents like 5-fluorouracil, which is palliative but not curative (9). Thus, µCTC may be an excellent tool for monitoring tumor response to therapeutic agents during prospective longitudinal studies.
Acknowledgments
This study was supported by a grant to Jamey Weichert from the University of Wisconsin Comprehensive Cancer Center, R37 grant CA63677 to William F. Dove from the National Cancer Institute, and NCDDG grant U19 CA113297-03 to Ben Shen from the National Cancer Institute.
Footnotes
Publisher's Disclaimer: This is a PDF file of an unedited manuscript that has been accepted for publication. As a service to our customers we are providing this early version of the manuscript. The manuscript will undergo copyediting, typesetting, and review of the resulting proof before it is published in its final citable form. Please note that during the production process errors may be discovered which could affect the content, and all legal disclaimers that apply to the journal pertain.
Reference List
- 1.American Cancer Society. Cancer Facts & Figures 2007. Atlanta, GA: American Cancer Society; 2007. [Google Scholar]
- 2.Pickhardt PJ, Choi JR, Hwang I, et al. Computed tomographic virtual colonoscopy to screen for colorectal neoplasia in asymptomatic adults. New England Journal of Medicine. 2003;349:2191–2200. doi: 10.1056/NEJMoa031618. [DOI] [PubMed] [Google Scholar]
- 3.Pickhardt PJ, Halberg RB, Taylor AJ, et al. Microcomputed tomography colonography for polyp detection in an in vivo mouse tumor model. Proc Natl Acad Sci U S A. 2005;102:3419–3422. doi: 10.1073/pnas.0409915102. [DOI] [PMC free article] [PubMed] [Google Scholar]
- 4.Ware JH. Linear Models for the Analysis of Longitudinal Studies. American Statistician. 1985;39:95–101. [Google Scholar]
- 5.Yeshwant SC, Summers RM, Yao J, et al. Polyps: linear and volumetric measurement at CT colonography. Radiology. 2006;241:802–811. doi: 10.1148/radiol.2413051534. [DOI] [PubMed] [Google Scholar]
- 6.Su LK, Kinzler KW, Vogelstein B, et al. Multiple intestinal neoplasia caused by a mutation in the murine homolog of the APC gene. Science. 1992;256:668–670. doi: 10.1126/science.1350108. [DOI] [PubMed] [Google Scholar]
- 7.Quon A, Napel S, Beaulieu CF, et al. "Flying through" and "flying around" a PET/CT scan: Pilot study and development of 3D integrated 18F-FDG PET/CT for virtual bronchoscopy and colonoscopy. J Nucl Med. 2006;47:1081–1087. [PubMed] [Google Scholar]
- 8.Magnotta VA, Heckel D, Andreasen NC, et al. Measurement of brain structures with artificial neural networks: Two- and three-dimensional applications. Radiology. 1999;211:781–790. doi: 10.1148/radiology.211.3.r99ma07781. [DOI] [PubMed] [Google Scholar]
- 9.Heidelberger C, Ansfield FJ. Experimental and clinical use of fluorinated pyrimidines in cancer chemotherapy. Cancer Res. 1963;23:1226–1243. [PubMed] [Google Scholar]


