Abstract
Phosphatidylinositol (PI) 4,5-bisphosphate (PIP2) plays a pivotal role in insulin-stimulated glucose transport as an important precursor to PI 3,4,5-trisphosphate (PIP3) and a key regulator of actin polymerization. Since endothelin (ET)-1 impairs insulin sensitivity and PIP2 is a target of ET-1–induced signaling, we tested whether a change in insulin-stimulated PIP3 generation and signaling, PIP2-regulated actin polymerization, or a combination of both accounted for ET-1–induced insulin resistance. Concomitant with a time-dependent loss of insulin sensitivity, ET-1 caused a parallel reduction in plasma membrane PIP2. Despite decreased insulin-stimulated PI 3-kinase activity and PIP3 generation, ET-1 did not diminish downstream signaling to Akt-2. Furthermore, addition of exogenous PIP2, but not PIP3, restored insulin-regulated GLUT4 translocation and glucose transport impaired by ET-1. Microscopic and biochemical analyses revealed a PIP2-dependent loss of cortical filamentous actin (F-actin) in ET-1–treated cells. Restoration of insulin sensitivity by PIP2 add-back occurred concomitant with a reestablishment of cortical F-actin. The corrective effect of exogenous PIP2 in ET-1–induced insulin-resistant cells was not present in cells where cortical F-actin remained experimentally depolymerized. These data suggest that ET-1–induced insulin resistance results from reversible changes in PIP2-regulated actin polymerization and not PIP2-dependent signaling.
In muscle and adipose tissues, insulin stimulates glucose transport by increasing the level of the glucose transporter protein GLUT4 (1) at the plasma membrane (1,2). Extensive study demonstrates that insulin binding to the insulin receptor (IR) causes tyrosine autophosphorylation of the IR-β subunit, increasing the intrinsic tyrosine kinase activity of the receptor (3). A key target of the activated IR is the insulin receptor substrate-1 (IRS-1) protein, which provides docking sites for phosphatidylinositol (PI) 3-kinase (PI3K). This enzyme plays a critical role in stimulating GLUT4 translocation by catalyzing the phosphorylation of PI 4,5-bisphosphate (PIP2) to PI 3,4,5-trisphosphate (PIP3) (4). Increased PIP3 activates a kinase cascade involving PIP3-dependent kinases (PDK1/2), which activate Akt isoforms 1, 2, and 3, as well as the atypical protein kinase isoforms λ and ζ (PKC-λ/ζ) (5,6). Although distal Akt/PKC signaling parameters remain to be determined, studies have identified Akt-2, but not Akt-1, as the likely Akt isoform connecting the PI3K pathway to GLUT4 translocation and glucose transport (7–10).
In addition to serving as a precursor to PIP3, PIP2 also stimulates actin polymerization, which is important for optimal movement and/or fusion of GLUT4-containing vesicle membranes to the cell surface (11–15). Interestingly, we recently observed that hyperinsulinemia-induced insulin resistance was coupled to defects in PIP2-regulated cortical filamentous actin (F-actin), but not PIP3-regulated signaling events (12). This new appreciation for the importance of PIP2 in maintaining insulin sensitivity begets questioning if other conditions prominent in individuals with insulin resistance result from abnormalities in cellular PIP2, PIP3, actin, and their interrelationships. In particular, it is known that elevated levels of endothelin (ET)-1, a peptide promoting vasoconstriction via a PIP2-dependent signal (16,17), leads to states of insulin resistance. For example, in addition to hypertensive individuals displaying insulin resistance and elevated circulatory levels of ET-1 (18,19), plasma ET-1 levels are elevated in individuals with impaired glucose tolerance (18) and type 2 diabetes (18,20).
Experimentally, ET-1 exposure induces insulin resistance in rat adipocytes (21), rat arterial smooth muscle cells (22), and 3T3-L1 adipocytes (23). Furthermore, the ET-1–induced insulin-resistant state develops in both conscious rats (24) and healthy humans administered the peptide (25). Importantly, the reduced insulin-dependent glucose uptake in skeletal muscle in vivo does not result from a vasoconstrictive decrease in skeletal muscle blood flow (25), implying the existence of a direct ET-1 effect on one or more mechanisms involved in insulin-stimulated glucose transport. Since PIP2 is at a molecular intersection of both insulin and ET-1 signaling, we tested whether changes in insulin-stimulated PIP3 generation and/or signaling, PIP2-regulated actin polymerization, or a combination of these possibilities accounted for ET-1–induced insulin resistance. The subsequent report provides a detailed account of these studies.
RESEARCH DESIGN AND METHODS
Murine 3T3-L1 preadipocytes were from American Type Culture Collection (Manassas, VA). Dulbecco’s modified Eagle’s medium (DMEM) was from Invitrogen (Grand Island, NY). Fetal bovine serum and bovine calf serum were from Hyclone Laboratories (Logan, UT). Phosphatidylinositides [PtsIns(4,5)P2, cat no. P-4516, PtsIns(3,4,5)P3, cat no. P-3916] and histone carrier were purchased from Echelon Biosciences (Salt Lake City, UT). The Akt Kinase Assay Kit was from Cell Signaling Technology (Beverly, MA). Unless otherwise indicated, all other chemicals were from Sigma (St. Louis, MO).
Cell culture and treatments
Preadipocytes were cultured and differentiated to adipocytes as previously described (26). Studies were performed on adipocytes between 8 and 12 days postdifferentiation. ET-1 induction of insulin resistance was performed by treating the cells in 10 nmol/l ET-1/DMEM for 24 h, unless otherwise indicated as previously described (23). Selective endothelin type-A (ET-A) receptor antagonism was accomplished by pretreating cells with 1 μmol/l BQ-610/DMEM for 30 min before 24-h ET-1 incubation, carried out in the continual presence of BQ-610. Cells were either untreated or treated for 60 min with 20 μmol/l latrunculin B and incubated for 30 min with different concentrations of phosphatidylinositide:histone complex. Unless otherwise indicated, cells were acutely stimulated for 30 min with 10 nmol/l insulin after pretreatments.
Transient transfection
Differentiated adipocytes were electroporated as previously described (27). Transfection experiments were performed with 50 μg enhanced green fluorescence protein (EGFP)-tagged Grp1 or EGFP-tagged PH–phospholipase C (PLC)-δ plasmid DNAs (provided by Dr. Jeffrey Pessin, SUNY, Stony Brook, NY) for analysis of EGFP. After electroporation, adipocytes were replated on glass coverslips and allowed to recover for 16–18 h before use.
PI3K activity assay
Lysates were immunoprecipitated overnight (12–16 h) at 4°C with agarose-conjugated phosphotyrosine antibody (PT-66) or with IRS-1 antibody (Santa Cruz Biotechnology, Santa Cruz, CA). Immunoprecipitated lipid kinase activity was determined as previously described (28,29).
Plasma membrane sheet assay
Plasma membrane sheets was prepared as previously described (26) with minor modifications. Briefly, following treatments, cells were placed on ice (GLUT4 trafficking analyses) and fixed as previously described (26), or cells were kept at 37°C and fixed at room temperature (PI lipid analyses). Sheets were fixed for 20 min at 25°C in 2% paraformaldehyde/PBS, then blocked in 5% donkey serum for 60 min at 25°C, incubated for 1 h at 25°C with a 1:1,000 dilution of polyclonal rabbit GLUT4 antibody (provided by Dr. Jeffrey Pessin, SUNY, Stony Brook, NY), or for 60 min at 25°C with a 1:50 dilution of mouse PI 4,5-P2 antibody (Assay Designs, Ann Arbor, MI) or 1:100 mouse anti–PI 3,4,5-P3 antibody (Molecular Probes, Eugene, OR, and Echelon Biosciences, Salt Lake City, UT) followed by incubation at 25°C with 1:50 rhodamine red-X–conjugated anti-rabbit or anti-mouse antibody (Jackson Immunoresearch, West Grove, PA) for 60 or 45 min, respectively.
Whole-cell immunofluorescence and phalloidin staining
Following treatment, adipocytes were fixed for 20 min at 25°C in 2% paraformaldehyde/Tris-buffered saline (PIP labeling) or 4% paraformaldehyde/0.2% Triton X-100/PBS (actin labeling). For labeling of PIP after fixation, cells were incubated in 0.1% Triton X-100/Tris-buffered saline for 20 min at 25°C. These cells were then labeled as in the plasma membrane sheet assay. For labeling of actin after fixation, cells were incubated with 1:1,000 fluorescein isothiocyanate–conjugated phalloidin for 2 h at 25°C. Samples were examined via a Zeiss LSM 510 NLO Confocal Microscope (Thornwood, NY) or a fluorescence microscope with SPOT Advanced Imaging Software v. 3.4.5. All microscopic and camera settings were identical within experiments, and representative images are shown.
Cell and plasma membrane immunofluorescence quantification
Whole cells or plasma membrane sheets were prepared and probed with primary antibodies to GLUT4, PIP2, and PIP3, as described above. Caveolin-1 antibodies (Upstate, Waltham, MA, and Santa Cruz Biotechnology, Santa Cruz, CA) were used to normalize for protein. Caveolin-1 immunofluorescence was not statistically different between groups in any experiment (data not shown). Near infrared IRDye 800- and 700-conjugated anti-goat, anti-mouse, and anti-rabbit IgG secondary antibodies were purchased from Rockland (Gilbertsville, PA), and Alexafluor 680 anti-mouse IgM antibody was purchased from Molecular Probes (Eugene, OR). Images were collected and quantitated with the Odyssey infrared imaging system (LI-COR, Lincoln, NE) as previously described (30,31).
Preparation of total cell extracts and immunoprecipitation
Total-cell extracts were prepared, and samples were either subjected directly to SDS-PAGE (see ELECTROPHORESIS AND IMMUNOBLOTTING) or first immunoprecipitated with antibodies to Akt-1 (Upstate), Akt-2 (provided by Dr. Morris J. Birnbaum, University of Pennsylvania, Philadelphia, PA), IR-β or IRS-1 (IR-β and IRS-1 antibodies were from Santa Cruz Biotechnology) as we have previously described (26).
Preparation of F-actin and globular actin extracts
After overnight incubations, F- and globular actin (G-actin) fractions were obtained using the G-actin/F-actin in vivo assay as we have previously described (12). After dissociation, the F-actin fraction was centrifuged and F-actin and G-actin preparations were then assayed for protein, analyzed via electrophoresis and immunoblotting (see ELECTROPHORESIS AND IMMUNOBLOTTING), and quantitated as %F-actin (F-actin × [F-actin + G-actin]−1 × 100%).
Electrophoresis and immunoblotting
Actin fractions were separated by 12% SDS-PAGE, and whole-cell lysates and immunoprecipitated fractions were separated by 7.5% SDS-PAGE. The resolved actin fractions were transferred to nitrocellulose (BioRad, Hercules, CA), while all other resolved proteins were transferred to Immobilon P membrane (Millipore, Bedford, MA). Proteins were immunoblotted with either a monoclonal phosphotyrosine antibody (PY20:HRPO; Transduction Laboratories, San Diego, CA), a phosphoserine-specific Akt antibody (New England Biolabs, Beverly, MA), an Akt-2–specific antibody, or an IR-β, IRS-1, or GLUT4 antibody. All immunoblots were subjected to enhanced chemiluminescence detection (Amersham, Piscataway, NJ) and densitometry (ImageJ v. 1.33u; National Institutes of Health, Bethesda, MD).
Statistical analysis
All values are means ± SE. ANOVA was used to determine differences among groups. Where a significant difference was indicated, the Fisher’s Exact test was used to determine significant differences between groups. P < 0.05 was considered statistically significant.
RESULTS
ET-1 induces a time-dependent decrease in the plasma membrane levels of PIP2 and insulin-stimulated GLUT4
Exposure of 3T3-L1 adipocytes to 10 nmol/l ET-1 for 24 h resulted in a time-dependent decrease in plasma membrane PIP2 levels (Fig. 1A, panels 1–5) and a time-dependent decrease in the insulin-stimulated level of plasma membrane GLUT4 (Fig. 1B, panels 1–5). We continued examination of the ET-1 effect on insulin-stimulated GLUT4 translocation using the 24-h time point, as longer incubation periods produced no additional decrease in plasma membrane PIP2 or insulin-stimulated GLUT4 translocation to the plasma membrane (data not shown). In the absence of ET-1, insulin stimulated a characteristic increase in GLUT4 translocation (Fig. 2A, compare panels 1 and 5). The inhibitory effect of ET-1 exposure seen in Fig. 1B and in Fig. 2A (Fig. 2A, compare panels 5 and 6) was prevented in cells treated with BQ-610, a specific ET-A receptor antagonist (Fig. 2A, compare panels 6 and 8). ET-1 treatment, BQ-610 treatment, or both treatments in combination did not affect the basal-state plasma membrane level of GLUT4 (Fig. 2A, panels 1–4). Total cellular GLUT4 protein amount was not affected (P > 0.8) by chronic ET-1 exposure (data not shown). As expected, insulin treatment in the absence of ET-1 resulted in an increase in 2-deoxyglucose uptake (Fig. 2B). Consistent with an ET-1–induced loss of insulin-stimulated GLUT4 translocation, insulin-stimulated 2-deoxyglucose uptake was reduced 47% (P < 0.002) and BQ-610 prevented this reduction (Fig. 2B).
FIG. 1.
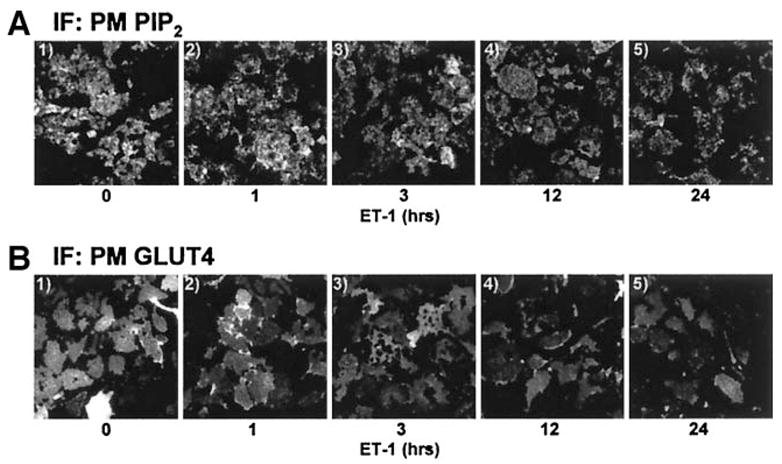
ET-1 lowers plasma membrane PIP2 and impairs insulin action. 3T3-L1 adipocytes were exposed to 10 nmol/l ET-1 for the indicated times and left untreated (A) or treated (B) with 10 nmol/l insulin for 30 min. Representative plasma membrane PIP2 (A) and GLUT4 (B) images from three experiments are shown. IF, immunofluorescence; PM, plasma membrane.
FIG. 2.
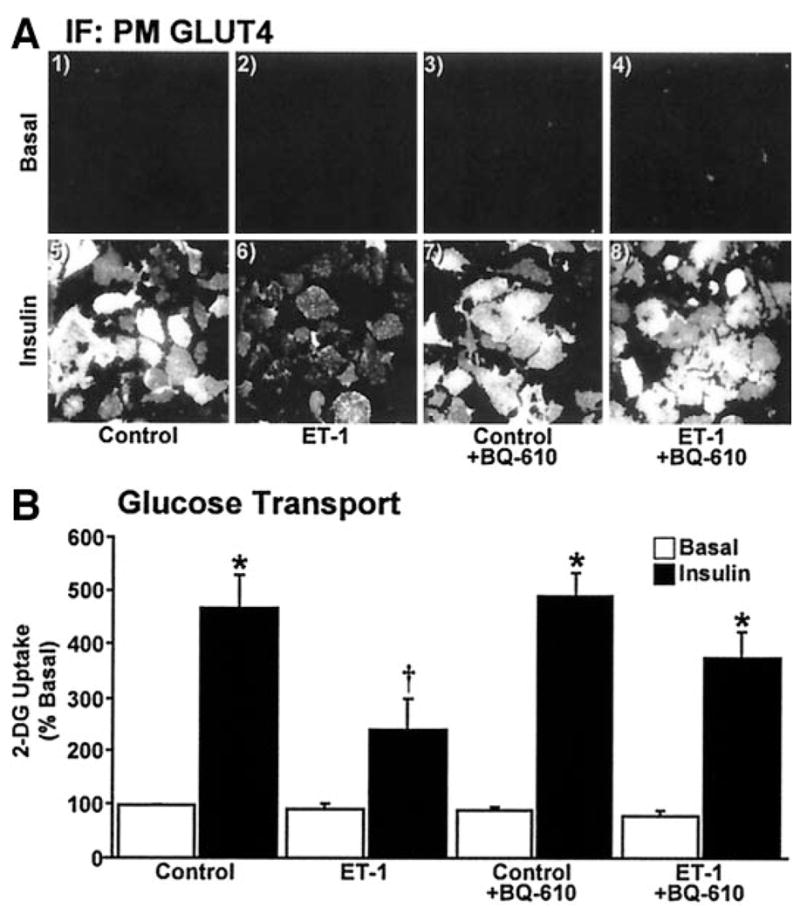
Insulin-stimulated glucose transport is diminished by ET-1. Cells were treated as detailed in RESEARCH DESIGN AND METHODS. Representative GLUT4 images (A) and means ± SE of 2-deoxyglucose (2-DG) uptake (B) from 3–5 experiments are shown (*P < 0.05 vs. control, †P < 0.002 vs. all groups). IF, immunofluorescence; PM, plasma membrane.
To confirm the loss of PIP2 from the plasma membrane, we first tested whether this effect was apparent in whole cells. Immunofluorescent PIP2 labeling of whole cells revealed that the majority of this lipid was localized at the cell surface (Fig. 3A, panel 1). In agreement with our plasma membrane sheet data, ET-1 treatment markedly diminished cell surface PIP2 (Fig. 3A, compare panels 1 and 2) and this loss was prevented by BQ-610 (Fig. 3A, compare panels 2 and 4). To further assure ourselves of this effect, we expressed the PLCδ/PH domain as an EGFP fusion protein (PLCδ/PH-EGFP) that has a high affinity and specificity for PI (4,5)P2 (32,33). Because PIP2 is localized primarily to the plasma membrane, the PLCδ/PH-EGFP reporter was also confined to the plasma membrane in control cells (Fig. 3B, panel 1). As expected, ET-1–treated cells displayed a clear loss of the plasma membrane accumulation of the PLCδ/PH-EGFP fusion protein, and this was prevented by BQ-610 (Fig. 3B, compare panels 3 and 4). To aid our efforts in quantification, we used the LI-COR Odyssey with simultaneous two-channel detection in the near infrared to measure the amount of plasma membrane PIP2 normalized to caveolin-1. Following primary antibody labeling of PIP2 and caveolin-1, we used near infrared-conjugated secondary antibodies to detect the labeled PIP2 and caveolin-1. Caveolin-1 fluorescence intensity was unaltered by any treatment condition (P > 0.5, data not shown). Acute insulin treatment (30 min) or sustained ET-1 exposure (24 h) decreased plasma membrane PIP2 compared with untreated control by 27 and 29% (P < 0.002), respectively (Fig. 3C). These decreases most likely reflect insulin activation of PI3K and ET-1 engagement of PLCβ. Interestingly, insulin did not further decrease plasma membrane PIP2 in ET-1–treated cells (Fig. 3C).
FIG. 3.
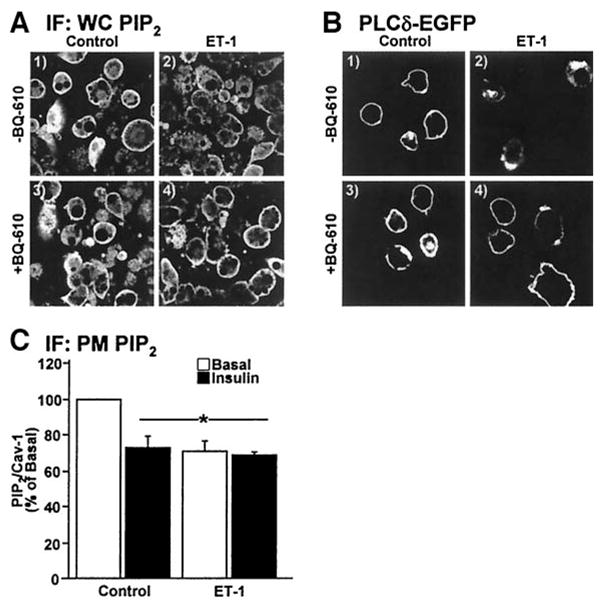
Cellular PIP2 resides at the plasma membrane. Nontransfected (A and C) or PH-PLCδ-EFGP–expressing (B) cells were treated and analyzed. Cell (A and B) or membrane (C) images, labeled with PIP2 and/or caveolin-1 antibodies (A and C) or EGFP (B) show PIP2. Values are means ± SE of PIP2/caveolin-1 from three experiments (*P < 0.002 vs. control). IF, immunofluorescence; PM, plasma membrane; WC, whole cell.
ET-1 impairs insulin-stimulated PI3K activity, but this loss of function does not readily account for the inability of insulin to regulate the glucose transport system
Certainly, the ET-1–induced lack of plasma membrane PIP2 would be expected to dampen insulin signaling at PI3K. However, the complete failure of insulin to further lower PIP2 levels in ET-1–treated cells suggested a secondary direct effect of ET-1 on PI3K activity independent of substrate deprivation. To test this, we immunoprecipitated phosphotyrosine– and IRS-1–associated PI3K from control and ET-1–treated cells and assayed the isolated enzyme’s ability to phosphorylate exogenous phosphoinositide substrate in the presence of ATP. As expected, the in vitro phosphotyrosine-associated PI3K activity isolated from insulin-treated control cells was markedly increased (Fig. 4A). This in vitro kinase activity was 22% (P < 0.003) lower in immunoprecipitates derived from ET-1–treated cells (Fig. 4A). Chronic ET-1 treatment was not associated with any change in the phosphotyrosine-isolated basal PI3K activity (Fig. 4A), and parallel assays using IRS-1 immunoprecipitates showed similar ET-1–induced reductions in insulin-stimulated PI3K activity (data not shown). In agreement with these PI3K data, plasma membrane PIP3 levels were increased 20% (P < 0.03) by insulin treatment in control cells (Fig. 4B). ET-1 pretreatment resulted in a 27% reduction (P < 0.02) in basal and a 35% reduction (P < 0.0001) in insulin-stimulated plasma membrane PIP3 levels (Fig. 4B). These findings are consistent with ET-1 having two distinct effects on insulin signaling. One that results from PIP2 deprivation (Figs. 1–3) and another that arises from a moderate PIP2-independent inhibitory effect of ET-1 on insulin-stimulated PI3K activity (Fig. 4A).
FIG. 4.
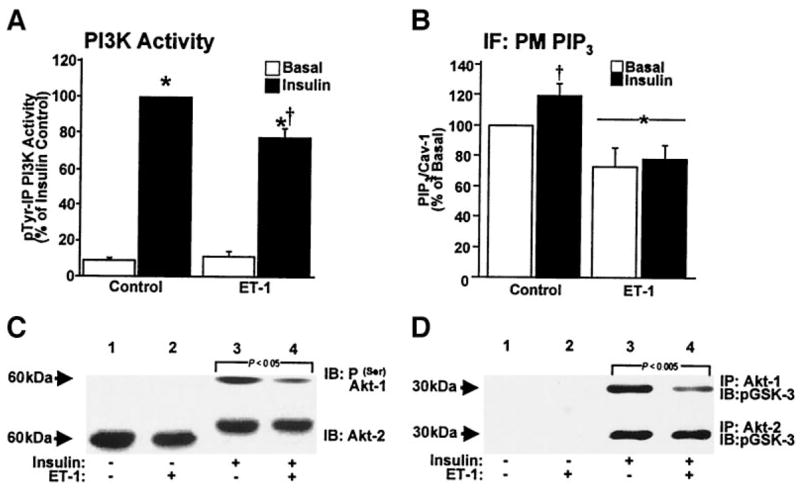
ET-1 induces signal transduction defects. Phosphotyrosine-immunoprecipitated PI3K activities (A), quantification of PIP3/caveolin-1 labeling (B), phosphoserine (upper) or mobility-shifted (lower) Akt immunoblots (C), and phosphor–glycogen synthase kinase (GSK)-3 immunoblots from Akt-1 (upper) and Akt-2 (lower) activity assays (D). Values are means ± SE from 3–5 experiments (A: *P < 0.0001 vs. basal, †P < 0.003 vs. insulin alone) (B: *P < 0.02 and †P < 0.03 vs. all groups). IF, immunofluorescence; PM, plasma membrane.
Consistent with an impairment of insulin-stimulated PI3K activity and PIP3 generation in ET-1–treated cells, distal serine phosphorylation of Akt-1 was significantly reduced (Fig. 4C, upper immunoblot, compare lanes 3 and 4). In contrast, ET-1 treatment did not affect the insulin-stimulated phosphorylation (assessed by reduced mobility) of Akt-2 (Fig. 4C, lower immunoblot, compare lanes 3 and 4). ET-1 treatment was not associated with a change (P > 0.8) in total cellular Akt-1 and Akt-2 protein levels (data not shown). To validate the differential effect of ET-1, we measured the in vitro activity of both isoforms. In agreement with the phosphorylation data, ET-1 reduced insulin-stimulated Akt-1 activity (Fig. 4D, upper immunoblot) but not Akt-2 activity (Fig. 4D, lower immunoblot), as assessed by the ability of immunoprecipitated enzyme to phosphorylate glycogen synthase kinase-3. Although others have reported induction of a PI3K/Akt signaling defect by ET-1 (22,23), these data reveal a specific effect of ET-1 on insulin-stimulated Akt-1 and not Akt-2 activity, the isoform involved in insulin-regulated glucose transport (7–10).
The actin cytoskeleton is disrupted in cells exposed to ET-1
Several other signaling mechanisms could possibly account for the decreased insulin-stimulated GLUT4 translocation and glucose transport induced by chronic ET-1 treatment. However, consistent with previous work (22,23), known proximal insulin signal transduction events including immunoprecipitated IR autophosphorylation and immunoprecipitated IRS-1 tyrosine phosphorylation were not significantly different between 3T3-L1 adipocytes maintained in control medium with or without ET-1 (data not shown). Because insulin signaling through Akt-2 appeared intact and because PIP2 appears to be a general regulator of actin polymerization at the plasma membrane (34,35), we next examined F-actin structure. Chronic ET-1 treatment led to a visible reduction in cortical F-actin, assessed with phalloidin staining of fixed whole cells (Fig. 5A). Further, the ratio of F-actin to total actin, determined by Western immunoblot analysis, confirmed that cells incubated in ET-1 undergo a 47% decrease (P < 0.05) in F-actin (Fig. 5B). BQ-610 treatment prevented this ET-1–induced loss of cortical F-actin (Fig. 5C).
FIG. 5.
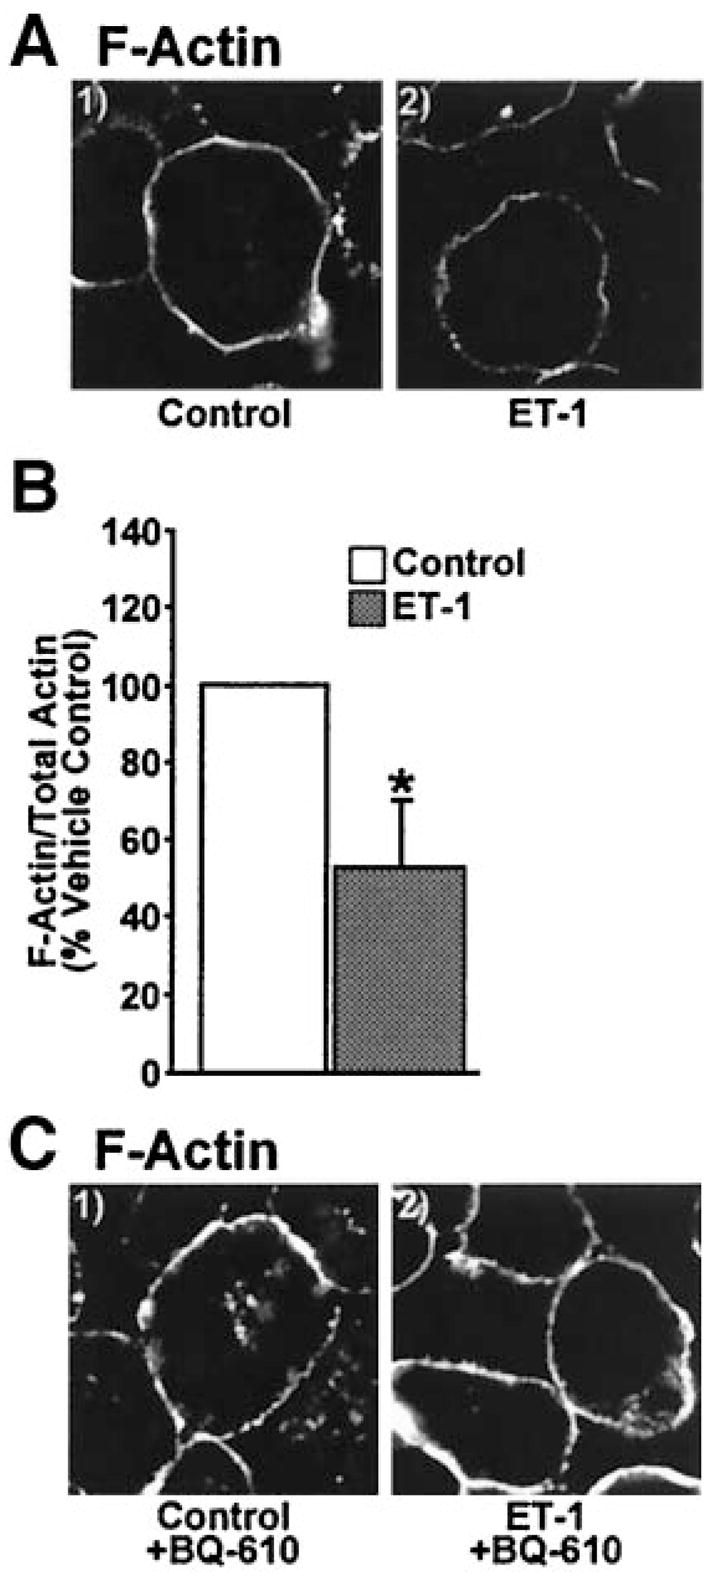
Cortical F-actin is disrupted by ET-1. Images of cells subjected to phalloidin labeling (A and C) or quantification of F- and G-actin fractions (B). Images and means ± SE are from three experiments (*P < 0.05 vs. control).
Exogenous PIP2 add-back, but not PIP3 add-back, restores cortical F-actin structure and insulin-stimulated glucose transport, but not the impaired insulin-stimulated activation of Akt
Using an established PIP2 replenishment procedure (12), we tested whether cortical F-actin structure and insulin responsiveness could be restored in ET-1–treated cells. As depicted in Fig. 6, carrier delivery of PIP2 into insulin-resistant adipocytes dose-dependently replenished plasma membrane PIP2 (Fig. 6A, panels 1–4). Concentrations of PIP2 > 1.25 μmol/l did not increase plasma membrane PIP2 greater than the basal-state plasma membrane level of this lipid, as we have previously reported (12). Figure 6B shows plasma membrane localization of the exogenously added lipid in control and ET-1–treated cells (Fig. 6B, panels 1–4). Consistent with phosphoinositide regulation of cortical F-actin, 1.25 μmol/l PIP2 add-back completely restored F-actin in ET-1–treated cells, whereas carrier alone had no effect (Fig. 6C).
FIG. 6.
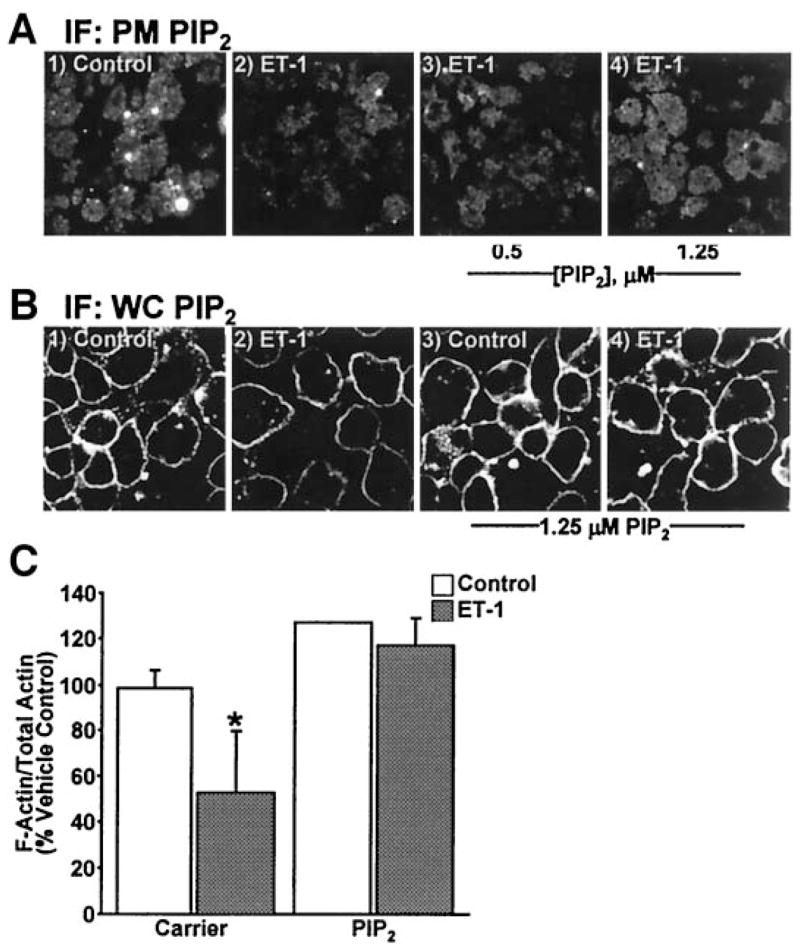
PIP2 replenishment restores PIP2 and F-actin decreased by ET-1. After ET-1 incubation, either Histone H1 (carrier; panels 1 and 2) or PIP2/Histone H1 (PIP2; panels 3 and 4) was added to the medium for 1 h. Membrane (A) or cells (B) labeled with PIP2 antibody or quantification of F- and G-actin fractions (C). Images and means ± SE are from three experiments (*P < 0.05 vs. all groups). IF, immunofluorescence; PM, plasma membrane; WC, whole cell.
Next, we evaluated whether PIP2 replenishment corrected the defect in insulin action. Remarkably, PIP2 add-back permitted the mobilization of GLUT4 by insulin in ET-1–treated cells, whereas carrier alone did not (Fig. 7A). In these studies, we also tested whether this restoration was dependent on F-actin by evaluating the effect of PIP2 in conjunction with the actin depolymerizing toxin latrunculin B. Consistent with the PIP2 effect being associated with F-actin regulation, replenishment of PIP2 did not restore insulin action in the presence of latrunculin B (Fig. 7A). Figure 7B shows that the corrective effect of PIP2 on GLUT4 recruitment to the plasma membrane also resulted in a restoration of insulin-stimulated glucose transport. Finally, we took advantage of the restorative effect of the add-back procedure to test whether it corrected ET-1–induced impairment of insulin-stimulated Akt-1 activation. As shown in Fig. 7C, neither carrier nor PIP2 restored insulin-stimulated Akt-1 phosphorylation in ET-1–treated cells. We predict that this lack of signal enhancement most likely reflects the inability of PIP2 to correct the previously shown ET-1–induced defect in PI3K activity (Fig. 4A). Given that the amount of exogenous lipid required to test this is excessive, an experimental approach we applied to circumvent this issue involved adding back exogenous PI3K lipid product PIP3.
FIG. 7.
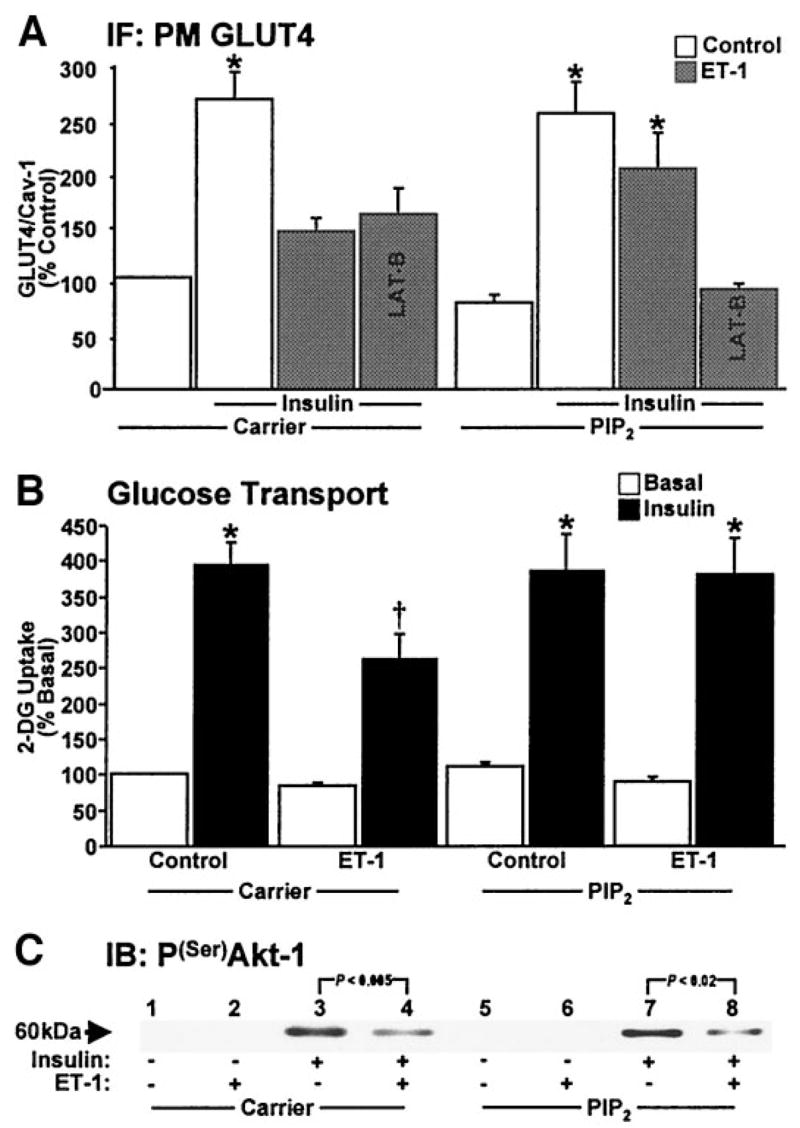
PIP2 corrects GLUT4 recruitment and glucose transport but not signaling to Akt-1. Quantification of GLUT4/caveolin-1 labeling (A), 2-deoxyglucose (2-DG) uptake (B), and a representative phosphoserine Akt immunoblot (C) are shown. Values are means ± SE from 3–5 experiments. (A: *P < 0.03 vs. control), (B: *P < 0.001 vs. basal, †P < 0.002 vs. all groups). IF, immunofluorescence; PM, plasma membrane.
Using a specific PIP3 antibody (36,37), microscopic analyses revealed very little endogenous PIP3 localized at the plasma membrane in the absence or presence of ET-1 treatment (Fig. 8A, panels 1 and 2). Strong nuclear PIP3 labeling was also observed in all cells (Fig. 8), as previously documented (38). This distribution was similar to that observed in studies with overexpression of the plek-strin homology domain from the Grp-1 protein fused to EGFP (data not shown). Consistent with PI3K activation by insulin, we detected a clear increase in plasma membrane PIP3 in control cells but not in ET-1–exposed cells (Fig. 8A, compare panels 5 and 6). Using the same effective phosphoinositide concentration we used for PIP2 replenishment, 1.25 μmol/l PIP3 add-back induced an insulin-like level of plasma membrane PIP3 in all of the experimental conditions (Fig. 8A, panels 3, 4, 7, and 8). Although this manipulation corrected insulin-stimulated Akt-1 phosphorylation in ET-1–treated cells (Fig. 8B), the ability of insulin to mobilize GLUT4 to the plasma membrane remained diminished (Fig. 8C). Consistent with the insulin resistance resulting from an ET-1–induced defect in the PIP2/actin system, PIP3 add-back also did not restore cortical F-actin structure (Fig. 8D).
FIG. 8.
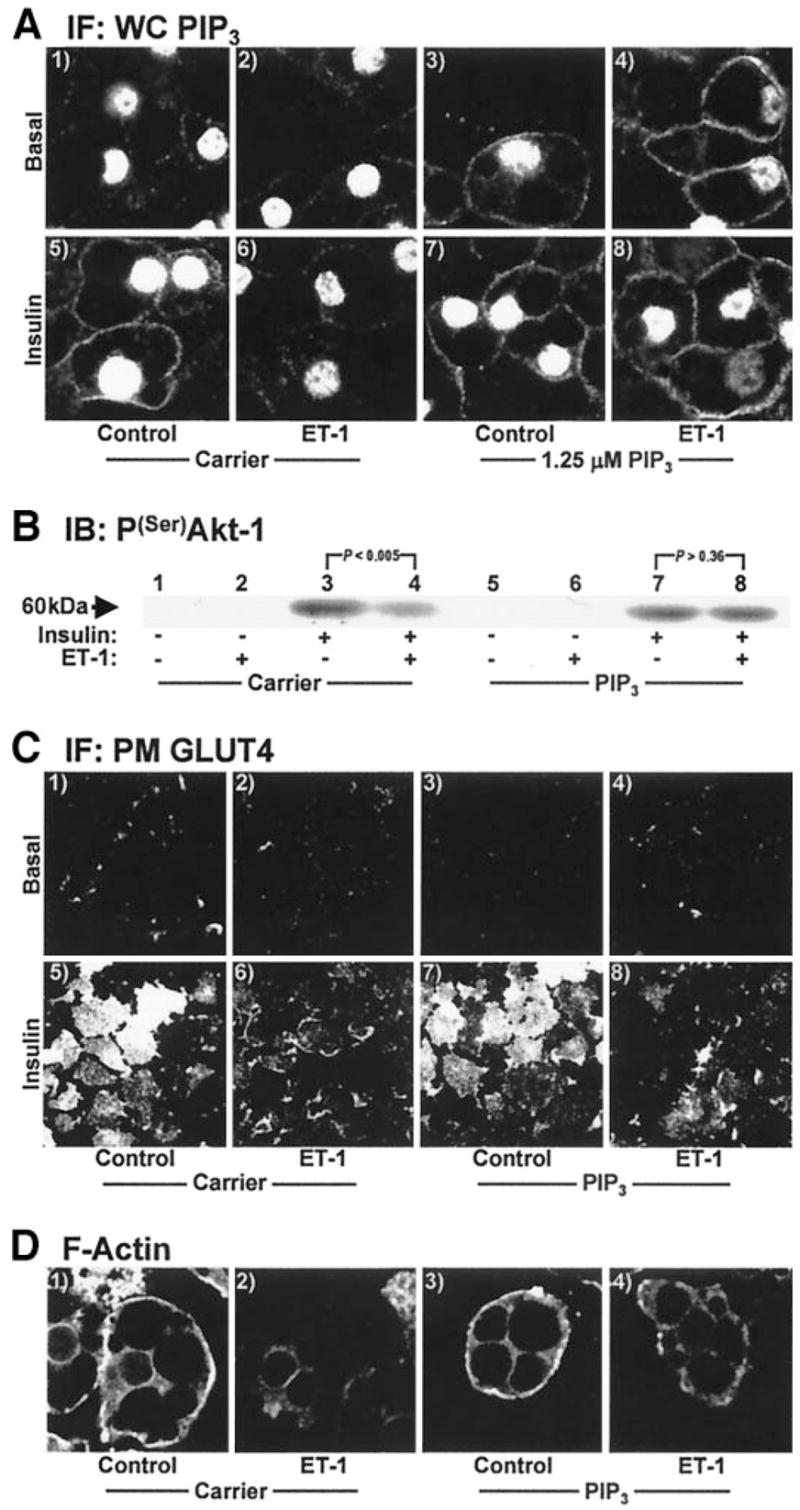
PIP3 corrects defects in Akt-1 but not GLUT4 or actin. PIP3 add-back was performed as described for PIP2 add-back in Fig. 6. Shown are cell PIP3 (A), membrane GLUT4 (C), cell F-actin (D), and a phosphoserine Akt immunoblot (B). All data shown are representative from 3–5 experiments. IF, immunofluorescence; PM, plasma membrane.
DISCUSSION
Recently, there has been increasing awareness of a potential role for ET-1 in insulin resistance. Studies from several laboratories report that circulatory ET-1 is elevated in insulin resistance associated with aging (39), metabolic syndrome (18), obesity (18,19), polycystic ovary syndrome (40), and type 2 diabetes (18,20). Furthermore, in vivo studies support these clinical observations by showing that ET-1 administration causes insulin resistance in rats (24) and humans (41). Additionally, ET-A receptor blockade prevents ET-1–induced insulin resistance in vitro (21–23,42) and in vivo (24,41), as well as in humans (25), and key mechanisms of insulin action in skeletal muscle (24,42), smooth muscle (22), and fat (21,23,42) cells are impaired following chronic ET-1 treatment. Our results are in full agreement with these observations and demonstrate for the first time that ET-1 markedly dysregulates cortical F-actin structure by diminishing plasma membrane PIP2. Normalization of insulin sensitivity occurred with a PIP2-associated correction of the ET-1–induced disturbance in cortical F-actin. Thus, these are the first data to reveal that insulin resistance induced by chronic ET-1 exposure results from loss of plasma membrane PIP2.
The PIP2-generated reversal of ET-1 action not being coupled with a normalization of Akt-1 signaling was interesting for several reasons. First, based on previous findings (23), we predicted that the PIP2 loss may contribute to the impairment of Akt activation via decreased substrate availability for PI3K action. However, our data demonstrate that PIP2 replenishment, though unable to correct Akt-1 activity, did restore cortical F-actin and insulin sensitivity. Importantly, our studies reveal that insulin activation of Akt-2 was not affected by ET-1. These findings are significant because defects in Akt-2, but not Akt-1, have been suggested to be more relevant in insulin resistance (7–10). Additionally, correction of Akt-1 activation with PIP3 add-back did not restore insulin sensitivity. Thus, ET-1–induced abnormalities in PI3K and Akt activation do not readily account for the insulin resistance induced by this peptide. Although it is unclear why Akt-2 activation is not impaired, this observation is consistent with a model whereET-1 utilizes a specific pool of PIP2 that regulates cortical F-actin structure and is used in the generation of PIP3 for Akt-1 activation but not Akt-2 activation. Compartmentalized pools of generated PIP3 have been postulated (10) and, thus, if true could explain our data. Certainly, further studies will be needed to test this possibility.
Although regulation of actin filament network by PIP2 is supported by several studies (34,35,43), Kanzaki et al. (34) reported that PIP2 generation from overexpression of a PIP5Kβ led to plasma membrane GLUT4 accumulation via decreased endocytosis. However, it is difficult to discern the relative amount of PIP2 accumulation in these studies, as the vast majority appears to be localized to vacuolar structures rather than the plasma membrane. Here, we show that exogenously added PIP2 localizes primarily at the plasma membrane and does not affect basal or insulin-stimulated GLUT4 translocation or glucose uptake. The lack of this reported effect of PIP2 (34) may simply reflect a difference in the amount of PIP2 added to the cell. For example, chronic generation of cellular PIP2 with PIP5Kβ may be considerably different from an acute 30-min addition of this lipid. Furthermore, it is likely that the location of PIP2 accumulation may differentially affect cellular trafficking. With regard to PIP3 add-back, a recent report demonstrated that exogenous PIP3 addition to adipocytes at concentrations 100-fold greater than those reported here induce GLUT4 to traffic to the plasma membrane in an Akt-1–independent but Akt-2–dependent manner (44). We did not observe the GLUT4 trafficking as a result of PIP3 addition but did note that replenishment of an amount of PIP3 that led to a similar extent of membrane immunofluorescence detected in insulin-stimulated cells restored Akt-1 engagement by insulin in the ET-1–induced insulin-resistant state.
Based on recent work demonstrating the importance of the actin cytoskeleton in insulin action (45,46), we asked whether the PIP2-based effects of ET-1 action extended to the actin cytoskeleton. While we did not observe insulin-stimulated changes in PIP2 distribution or cortical F-actin structure in insulin-sensitive and insulin-resistant cells, our findings revealed a clear loss of these components in ET-1–treated adipocytes. This loss may be the basis of the altered signal propagation from the insulin receptor and, thus, a mechanism of ET-1–induced insulin resistance. The fact that PIP2 add-back was insufficient in restoring insulin-stimulated GLUT4 translocation, when actin structure remained experimentally disrupted, supports this possibility. Since a PIP2/actin-dependent change in known early insulin-signaling events does not readily account for ET-1 action, it remains possible that defects in undefined signaling steps distal to Akt-2 exist. Alternatively, disturbance of the cortical F-actin meshwork may disturb some mechanical aspect of GLUT4-containing vesicle docking and fusion. Whether the loss of cortical F-actin contributes to or is the cause of a signaling and/or mechanical defect in insulin-stimulated GLUT4 translocation is not known. Despite the findings from future work addressing those key questions, our data clearly reveal a novel aspect of ET-1–induced insulin resistance.
In summary, PIP2-regulated cortical F-actin is targeted by ET-1, and remarkably, correction of this disturbance restores insulin responsiveness. Consistent with other published findings, we also show that ET-1 inhibited insulin-stimulated PI3K activity, but this defect only impaired signal propagation to Akt-1 and not Akt-2. Whereas exogenous PIP3 addition fixed signal propagation through Akt-1, it did not correct the disturbances in the cytoskeletal and glucose transport systems. The importance of actin cytoskeletal regulation by PIP2 in ET-1–induced insulin resistance is highlighted by the present work. The involvement of the PIP2/actin system in the adverse effects of ET-1 necessitates further studies to provide additional insights into how disturbances in the plasma membrane and cytoskeleton contribute to the development of insulin resistance.
Acknowledgments
This work was supported in part by National Center for Complementary and Alternative Medicine Grant R01-AT001846 (to J.S.E.), American Diabetes Foundation Career Development Award 60779 (to J.S.E.), and American Heart Association Midwest Affiliate Predoctoral Fellowship #0410042Z (to A.B.S.).
We are grateful to Drs. Ping Liu and Guoli Chen and Lixuan Tackett for their excellent technical assistance.
Footnotes
DMEM, Dulbecco’s modified Eagle’s medium; EGFP, enhanced green fluorescence protein; ET, endothelin; F-actin, filamentous actin; G-actin, globular actin; IR, insulin receptor; IRS, IR substrate; PI, phosphatidylinositol; PI3K, PI 3-kinase; PIP2, PI 4,5-bisphosphate; PIP3, PI 3,4,5-trisphosphate; PLC, phospholipase C.
References
- 1.Kandror KV, Pilch PF. Compartmentalization of protein traffic in insulin-sensitive cells. Am J Physiol. 1996;271:E1–E14. doi: 10.1152/ajpendo.1996.271.1.E1. [DOI] [PubMed] [Google Scholar]
- 2.Rea S, James DE. Moving GLUT4: the biogenesis and trafficking of GLUT4 storage vesicles. Diabetes. 1997;46:1667–1677. doi: 10.2337/diab.46.11.1667. [DOI] [PubMed] [Google Scholar]
- 3.White MF, Kahn CR. The insulin signaling system. J Biol Chem. 1994;269:1–4. [PubMed] [Google Scholar]
- 4.Watson RT, Pessin JE. Subcellular compartmentalization and trafficking of the insulin-responsive glucose transporter, GLUT4. Exp Cell Res. 2001;271:75–83. doi: 10.1006/excr.2001.5375. [DOI] [PubMed] [Google Scholar]
- 5.Kohn AD, Summers SA, Birnbaum MJ, Roth RA. Expression of a constitutively active Akt Ser/Thr kinase in 3T3–L1 adipocytes stimulates glucose uptake and glucose transporter 4 translocation. J Biol Chem. 1996;271:31372–31378. doi: 10.1074/jbc.271.49.31372. [DOI] [PubMed] [Google Scholar]
- 6.Bandyopadhyay G, Standaert ML, Zhao L, Yu B, Avignon A, Galloway L, Karnam P, Moscat J, Farese RV. Activation of protein kinase C (alpha, beta, and zeta) by insulin in 3T3/L1 cells: transfection studies suggest a role for PKC-zeta in glucose transport. J Biol Chem. 1997;272:2551–2558. doi: 10.1074/jbc.272.4.2551. [DOI] [PubMed] [Google Scholar]
- 7.Cho H, Mu J, Kim JK, Thorvaldsen JL, Chu Q, Crenshaw EB, 3rd, Kaestner KH, Bartolomei MS, Shulman GI, Birnbaum MJ. Insulin resistance and a diabetes mellitus-like syndrome in mice lacking the protein kinase Akt2 (PKB beta) Science. 2001;292:1728–1731. doi: 10.1126/science.292.5522.1728. [DOI] [PubMed] [Google Scholar]
- 8.Cho H, Thorvaldsen JL, Chu Q, Feng F, Birnbaum MJ. Akt1/PKBalpha is required for normal growth but dispensable for maintenance of glucose homeostasis in mice. J Biol Chem. 2001;276:38349–38352. doi: 10.1074/jbc.C100462200. [DOI] [PubMed] [Google Scholar]
- 9.Bae SS, Cho H, Mu J, Birnbaum MJ. Isoform-specific regulation of insulin-dependent glucose uptake by Akt/PKB. J Biol Chem. 2003;278:49530–49536. doi: 10.1074/jbc.M306782200. [DOI] [PubMed] [Google Scholar]
- 10.Brozinick JT, Jr, Roberts BR, Dohm GL. Defective signaling through Akt-2 and -3 but not Akt-1 in insulin-resistant human skeletal muscle: potential role in insulin resistance. Diabetes. 2003;52:935–941. doi: 10.2337/diabetes.52.4.935. [DOI] [PubMed] [Google Scholar]
- 11.Brozinick JT, Jr, Hawkins ED, Strawbridge AB, Elmendorf JS. Disruption of cortical actin in skeletal muscle demonstrates an essential role of the cytoskeleton in glucose transporter 4 translocation in insulin-sensitive tissues. J Biol Chem. 2004;279:40699–40706. doi: 10.1074/jbc.M402697200. [DOI] [PMC free article] [PubMed] [Google Scholar]
- 12.Chen G, Raman P, Bhonagiri P, Strawbridge AB, Pattar GR, Elmendorf JS. Protective effect of phosphatidylinositol 4,5-bisphosphate against cortical filamentous actin loss and insulin resistance induced by sustained exposure of 3T3–L1 adipocytes to insulin. J Biol Chem. 2004;279:39705–39709. doi: 10.1074/jbc.C400171200. [DOI] [PMC free article] [PubMed] [Google Scholar]
- 13.Kanzaki M, Pessin JE. Insulin-stimulated GLUT4 translocation in adipocytes is dependent upon cortical actin remodeling. J Biol Chem. 2001;276:42436–42444. doi: 10.1074/jbc.M108297200. [DOI] [PubMed] [Google Scholar]
- 14.Kanzaki M, Watson RT, Hou JC, Stamnes M, Saltiel AR, Pessin JE. Small GTP-binding protein TC10 differentially regulates two distinct populations of filamentous actin in 3T3L1 adipocytes. Mol Biol Cell. 2002;13:2334–2346. doi: 10.1091/mbc.01-10-0490. [DOI] [PMC free article] [PubMed] [Google Scholar]
- 15.Kanzaki M, Watson RT, Khan AH, Pessin JE. Insulin stimulates actin comet tails on intracellular GLUT4-containing compartments in differentiated 3T3L1 adipocytes. J Biol Chem. 2001;276:49331–49336. doi: 10.1074/jbc.M109657200. [DOI] [PubMed] [Google Scholar]
- 16.Takuwa N, Takuwa Y, Yanagisawa M, Yamashita K, Masaki T. A novel vasoactive peptide endothelin stimulates mitogenesis through inositol lipid turnover in Swiss 3T3 fibroblasts. J Biol Chem. 1989;264:7856–7861. [PubMed] [Google Scholar]
- 17.Opgenorth TJ. Endothelin receptor antagonism. Adv Pharmacol. 1995;33:1–65. doi: 10.1016/s1054-3589(08)60665-1. [DOI] [PubMed] [Google Scholar]
- 18.Ferri C, Bellini C, Desideri G, Baldoncini R, Properzi G, Santucci A, De Mattia G. Circulating endothelin-1 levels in obese patients with the metabolic syndrome. Exp Clin Endocrinol Diabetes. 1997;105:38–40. doi: 10.1055/s-0029-1211794. [DOI] [PubMed] [Google Scholar]
- 19.Ferri C, Bellini C, Desideri G, Di Francesco L, Baldoncini R, Santucci A, De Mattia G. Plasma endothelin-1 levels in obese hypertensive and normotensive men. Diabetes. 1995;44:431–436. doi: 10.2337/diab.44.4.431. [DOI] [PubMed] [Google Scholar]
- 20.Takahashi K, Ghatei MA, Lam HC, O’Halloran DJ, Bloom SR. Elevated plasma endothelin in patients with diabetes mellitus. Diabetologia. 1990;33:306–310. doi: 10.1007/BF00403325. [DOI] [PubMed] [Google Scholar]
- 21.Chou YC, Perng JC, Juan CC, Jang SY, Kwok CF, Chen WL, Fong JC, Ho LT. Endothelin-1 inhibits insulin-stimulated glucose uptake in isolated rat adipocytes. Biochem Biophys Res Commun. 1994;202:688–693. doi: 10.1006/bbrc.1994.1985. [DOI] [PubMed] [Google Scholar]
- 22.Jiang ZY, Zhou QL, Chatterjee A, Feener EP, Myers MG, White MF, King GL. Endothelin-1 modulates insulin signaling through phosphatidylinositol 3-kinase pathway in vascular smooth muscle cells. Diabetes. 1999;48:1120–1130. doi: 10.2337/diabetes.48.5.1120. [DOI] [PubMed] [Google Scholar]
- 23.Ishibashi KI, Imamura T, Sharma PM, Huang J, Ugi S, Olefsky JM. Chronic endothelin-1 treatment leads to heterologous desensitization of insulin signaling in 3T3–L1 adipocytes. J Clin Invest. 2001;107:1193–1202. doi: 10.1172/JCI11753. [DOI] [PMC free article] [PubMed] [Google Scholar]
- 24.Wilkes JJ, Hevener A, Olefsky J. Chronic endothelin-1 treatment leads to insulin resistance in vivo. Diabetes. 2003;52:1904–1909. doi: 10.2337/diabetes.52.8.1904. [DOI] [PubMed] [Google Scholar]
- 25.Ottosson-Seeberger A, Lundberg JM, Alvestrand A, Ahlborg G. Exogenous endothelin-1 causes peripheral insulin resistance in healthy humans. Acta Physiol Scand. 1997;161:211–220. doi: 10.1046/j.1365-201X.1997.00212.x. [DOI] [PubMed] [Google Scholar]
- 26.Kralik SF, Liu P, Leffler BJ, Elmendorf JS. Ceramide and glucosamine antagonism of alternate signaling pathways regulating insulin- and osmotic shock-induced glucose transporter 4 translocation. Endocrinology. 2002;143:37–46. doi: 10.1210/endo.143.1.8606. [DOI] [PubMed] [Google Scholar]
- 27.Thurmond DC, Ceresa BP, Okada S, Elmendorf JS, Coker K, Pessin JE. Regulation of insulin-stimulated GLUT4 translocation by Munc18c in 3T3L1 adipocytes. J Biol Chem. 1998;273:33876–33883. doi: 10.1074/jbc.273.50.33876. [DOI] [PubMed] [Google Scholar]
- 28.Elmendorf JS, Damrau-Abney A, Smith TR, David TS, Turinsky J. Phosphatidylinositol 3-kinase and dynamics of insulin resistance in denervated slow and fast muscles in vivo. Am J Physiol. 1997;272:E661–E670. doi: 10.1152/ajpendo.1997.272.4.E661. [DOI] [PubMed] [Google Scholar]
- 29.Yang C, Watson RT, Elmendorf JS, Sacks DB, Pessin JE. Calmodulin antagonists inhibit insulin-stimulated GLUT4 (glucose transporter 4) translocation by preventing the formation of phosphatidylinositol 3,4,5-trisphosphate in 3T3L1 adipocytes. Mol Endocrinol. 2000;14:317–326. doi: 10.1210/mend.14.2.0425. [DOI] [PubMed] [Google Scholar]
- 30.Wong SK. A 384-well cell-based phospho-ERK assay for dopamine D2 and D3 receptors. Anal Biochem. 2004;333:265–272. doi: 10.1016/j.ab.2004.05.011. [DOI] [PubMed] [Google Scholar]
- 31.Razidlo GL, Kortum RL, Haferbier JL, Lewis RE. Phosphorylation regulates KSR1 stability, ERK activation, and cell proliferation. J Biol Chem. 2004;279:47808–47814. doi: 10.1074/jbc.M406395200. [DOI] [PubMed] [Google Scholar]
- 32.Kavran JM, Klein DE, Lee A, Falasca M, Isakoff SJ, Skolnik EY, Lemmon MA. Specificity and promiscuity in phosphoinositide binding by pleckstrin homology domains. J Biol Chem. 1998;273:30497–30508. doi: 10.1074/jbc.273.46.30497. [DOI] [PubMed] [Google Scholar]
- 33.Varnai P, Balla T. Visualization of phosphoinositides that bind pleckstrin homology domains: calcium- and agonist-induced dynamic changes and relationship to myo-[3H]inositol-labeled phosphoinositide pools. J Cell Biol. 1998;143:501–510. doi: 10.1083/jcb.143.2.501. [DOI] [PMC free article] [PubMed] [Google Scholar]
- 34.Kanzaki M, Furukawa M, Raab W, Pessin JE. Phosphatidylinositol-4, 5-bisphosphate (PI4,5P2) regulates adipocyte actin dynamics and GLUT4 vesicle recycling. J Biol Chem. 2004;279:30622–30633. doi: 10.1074/jbc.M401443200. [DOI] [PubMed] [Google Scholar]
- 35.Sechi AS, Wehland J. The actin cytoskeleton and plasma membrane connection: PtdIns(4,5)P(2) influences cytoskeletal protein activity at the plasma membrane. J Cell Sci. 2000;113(Pt 21):3685–3695. doi: 10.1242/jcs.113.21.3685. [DOI] [PubMed] [Google Scholar]
- 36.Chen R, Kang VH, Chen J, Shope JC, Torabinejad J, DeWald DB, Prestwich GD. A monoclonal antibody to visualize PtdIns(3,4,5)P(3) in cells. J Histochem Cytochem. 2002;50:697–708. doi: 10.1177/002215540205000511. [DOI] [PubMed] [Google Scholar]
- 37.Niswender KD, Morrison CD, Clegg DJ, Olson R, Baskin DG, Myers MG, Jr, Seeley RJ, Schwartz MW. Insulin activation of phosphatidylinositol 3-kinase in the hypothalamic arcuate nucleus: a key mediator of insulin-induced anorexia. Diabetes. 2003;52:227–231. doi: 10.2337/diabetes.52.2.227. [DOI] [PubMed] [Google Scholar]
- 38.Tanaka K, Horiguchi K, Yoshida T, Takeda M, Fujisawa H, Takeuchi K, Umeda M, Kato S, Ihara S, Nagata S, Fukui Y. Evidence that a phosphatidylinositol 3,4,5-trisphosphate-binding protein can function in nucleus. J Biol Chem. 1999;274:3919–3922. doi: 10.1074/jbc.274.7.3919. [DOI] [PubMed] [Google Scholar]
- 39.Sayama H, Nakamura Y, Saito N, Konoshita M. Does the plasma endothelin-1 concentration reflect atherosclerosis in the elderly? Gerontology. 1999;45:312–316. doi: 10.1159/000022111. [DOI] [PubMed] [Google Scholar]
- 40.Diamanti-Kandarakis E, Spina G, Kouli C, Migdalis I. Increased endothelin-1 levels in women with polycystic ovary syndrome and the beneficial effect of metformin therapy. J Clin Endocrinol Metab. 2001;86:4666–4673. doi: 10.1210/jcem.86.10.7904. [DOI] [PubMed] [Google Scholar]
- 41.Teuscher AU, Lerch M, Shaw S, Pacini G, Ferrari P, Weidmann P. Endothelin-1 infusion inhibits plasma insulin responsiveness in normal men. J Hypertens. 1998;16:1279–1284. doi: 10.1097/00004872-199816090-00009. [DOI] [PubMed] [Google Scholar]
- 42.Idris I, Patiag D, Gray S, Donnelly R. Tissue- and time-dependent effects of endothelin-1 on insulin-stimulated glucose uptake. Biochem Pharmacol. 2001;62:1705–1708. doi: 10.1016/s0006-2952(01)00815-2. [DOI] [PubMed] [Google Scholar]
- 43.Shibasaki Y, Ishihara H, Kizuki N, Asano T, Oka Y, Yazaki Y. Massive actin polymerization induced by phosphatidylinositol-4-phosphate 5-kinase in vivo. J Biol Chem. 1997;272:7578–7581. doi: 10.1074/jbc.272.12.7578. [DOI] [PubMed] [Google Scholar]
- 44.Sweeney G, Garg RR, Ceddia RB, Li D, Ishiki M, Somwar R, Foster LJ, Neilsen PO, Prestwich GD, Rudich A, Klip A. Intracellular delivery of phosphatidylinositol (3,4,5)-trisphosphate causes incorporation of glucose transporter 4 into the plasma membrane of muscle and fat cells without increasing glucose uptake. J Biol Chem. 2004;279:32233–32242. doi: 10.1074/jbc.M402897200. [DOI] [PubMed] [Google Scholar]
- 45.Jiang ZY, Chawla A, Bose A, Way M, Czech MP. A phosphatidylinositol 3-kinase-independent insulin signaling pathway to N-WASP/Arp2/3/F-actin required for GLUT4 glucose transporter recycling. J Biol Chem. 2002;277:509–515. doi: 10.1074/jbc.M108280200. [DOI] [PubMed] [Google Scholar]
- 46.Kanzaki M, Pessin JE. Caveolin-associated filamentous actin (Cav-actin) defines a novel F-actin structure in adipocytes. J Biol Chem. 2002;277:25867–25869. doi: 10.1074/jbc.C200292200. [DOI] [PubMed] [Google Scholar]


