

Abstract
Cell culture work suggests that signaling to polymerize cortical filamentous actin (F-actin) represents a required pathway for the optimal redistribution of the insulin-responsive glucose transporter, GLUT4, to the plasma membrane. Recent in vitro study further suggests that the actin-regulatory neural Wiskott-Aldrich syndrome protein (N-WASP) mediates the effect of insulin on the actin filament network. Here we tested whether similar cytoskeletal mechanics are essential for insulin-regulated glucose transport in isolated rat epitrochlearis skeletal muscle. Microscopic analysis revealed that cortical F-actin is markedly diminished in muscle exposed to latrunculin B. Depolymerization of cortical F-actin with latrunculin B caused a time- and concentration-dependent decline in 2-deoxyglucose transport. The loss of cortical F-actin and glucose transport was paralleled by a decline in insulin-stimulated GLUT4 translocation, as assessed by photolabeling of cell surface GLUT4 with Bio-LC-ATB-BMPA. Although latrunculin B impaired insulin-stimulated GLUT4 translocation and glucose transport, activation of phosphatidylinositol 3-kinase and Akt by insulin was not rendered ineffective. In contrast, the ability of insulin to elicit the cortical F-actin localization of N-WASP was abrogated. These data provide the first evidence that actin cytoskeletal mechanics are an essential feature of the glucose transport process in intact skeletal muscle. Furthermore, these findings support a distal actin-based role for N-WASP in insulin action in vivo.
Type II diabetes (noninsulin-dependent diabetes mellitus) is a major disease in the world today, afflicting over 90 million Americans. In its earliest phases, the major feature of this disease is resistance of skeletal muscle to insulin, which is of considerable importance, because it is responsible for the disposal of the majority of an exogenous glucose load (1). Insulin stimulation of glucose transport into skeletal muscle, as well as adipose tissue and heart, occurs via the GLUT4 1-facilitated glucose transporter, one of a family of glucose transporters in mammalian tissues (2, 3). In the basal state, GLUT4 cycles continuously between the plasma membrane and one or more intracellular compartments, with the vast majority of the transporter residing in the cell interior (4–6). Activation of the insulin receptor triggers a large increase in the rate of GLUT4 vesicle exocytosis and a smaller but important decrease in the rate of internalization by endocytosis (7–10). The overall insulin-dependent shift in the dynamics of GLUT4 trafficking results in a net increase of GLUT4 protein levels at the cell surface, and these plasma membrane-localized transporters subsequently facilitate the influx of glucose into the cell.
Activation of GLUT4 translocation by insulin requires a phosphatidylinositol 3-kinase (PI3K) signal involving the upstream insulin receptor and insulin receptor substrate activators and the downstream protein kinase B (Akt) and C target enzymes (5, 11). Recently, it has also been suggested in the 3T3-L1 adipocyte cell culture system that a second pathway occurs as a consequence of Cbl tyrosine phosphorylation, although the involvement of this pathway in skeletal muscle remains controversial (12–15). Cbl and the adaptor protein CAP (c-Cbl-associated protein (16)) are recruited to the insulin receptor by adaptor molecules containing pleckstrin homology and Srchomology 2 domains (17). Once tyrosine-phosphorylated by the receptor, Cbl can recruit the adaptor protein CrkII to lipid rafts, along with the guanyl nucleotide exchange factor C3G (18). C3G, in turn, can activate the GTP-binding protein TC10, which resides in lipid rafts (19). Recent investigation suggests a role of TC10 in the regulation of actin dynamics (20–25). In particular, the actin-regulatory neural Wiskott-Aldrich syndrome protein (N-WASP) (22) appears to be a downstream target of TC10.
Consistent with a functional role of this actin nucleation promoting factor in insulin action, a role for actin in insulin-stimulated GLUT4 translocation has been implicated by several studies. For example, treatment with the actin-depolymerizing agent cytochalasin D or the actin monomer binding Red Sea Sponge toxins latrunculin A or B inhibited insulin-stimulated GLUT4 translocation (26 –28). Importantly, it has been shown that insulin elicits actin filament (F-actin) formation in 3T3-L1 adipocytes and L6 myotubes (24, 26, 27, 29 –36). Thus, insulin signaling to polymerize cortical F-actin apparently represents a required pathway for optimal movement or fusion of GLUT4-containing vesicle membranes to the cell surface membrane. Nonetheless, data interpretation has to consider that adherent cultured cells possess significant numbers of actin stress fibers that may be more susceptible to these agents than cortical F-actin. Additionally, these cell systems differ from intact tissues from which they were originally derived in both their glucose transporter isoform expression and their responses to insulin (37, 38). Together, these data indicate that cell lines may not be completely representative of in vivo insulin signaling and the glucose transport process.
There is suggestive evidence in isolated rat fat cells that actin participates in insulin-stimulated GLUT4 translocation and glucose transport (39). However, the role of actin in skeletal muscle, a tissue that is responsible for ~80% of postprandial glucose disposal (40) and is regarded as a major peripheral site of insulin resistance in diabetes (41), has not been addressed. This is partially due to the difficulty in both working with skeletal muscle preparations, and in visualizing the cellular distribution of GLUT4 and the organization of cortical F-actin in a setting comprised mainly of contractile machinery. The isolated rat epitrochlearis muscle, a small flat muscle in the rat fore limb, has been extensively utilized for investigation of the regulation of glucose transport (42). In the present study we have used this preparation to address the role the actin cytoskeleton plays in the glucose transport process in skeletal muscle. We demonstrate for the first time that disruption of cortical F-actin in an intact muscle inhibits both insulin-stimulated GLUT4 translocation and glucose transport. Additionally, early insulin signal propagation remained intact in epitrochlearis muscle made insulin-resistant by cortical F-actin disassembly. Consistent with a more distal signal transduction disturbance, the loss of actin membrane skeleton was associated with the inability of insulin to spatially regulate N-WASP in the isolated epitrochlearis muscle preparation. The subsequent report provides a detailed account of these studies.
EXPERIMENTAL PROCEDURES
Animals
Specific pathogen-free male Wistar rats weighing 100 –125 g were obtained from Charles River Laboratories (Boston, MA). Upon arrival, rats were housed four to a cage in a temperature-controlled animal room maintained on a 12:12-h light-dark cycle. The rats were fed ad libitum National Institutes of Health standard chow and water.
Muscle Preparation and Incubation
Rats in the postprandial state were anesthetized with 5 mg/100 g of body weight sodium pentobarbital. Epitrochlearis muscles were dissected out, blotted on gauze, and transferred to 25-ml Erlenmeyer flasks containing 2 ml of Krebs-Hense-leit buffer (KHB) with 0.1% bovine serum albumin (BSA), 32 mM mannitol, and 8 mM glucose. The suitability of this muscle for incubation studies has been extensively described previously (42). The flasks were incubated in a shaking water bath maintained at 30 °C for 1 h and were continuously gassed with 95% O2/5% CO2. Muscles were initially incubated in the presence or absence of latrunculin A or B (20 μM) for various periods of time prior to incubation under basal conditions (no additions), or stimulation with insulin (13.3 nM). The muscles were then transferred to flasks containing 2 ml of KHB with 0.1% BSA, 40 mM mannitol, 2 mM pyruvate, and the same additions as in the previous incubation, and used for measurement of glucose transport, for photo-labeling of surface GLUT4, or frozen and used for Western blotting/signaling assays. The flasks were incubated for 10 min at 30 °C to wash out glucose, and the gas phase in the flasks was maintained at 95% O2/5% CO2. Following the wash step the muscles were used for measurement of glucose transport or GLUT4 photolabeling as described below.
Measurement of Glucose Transport Activity
Glucose transport activity was measured using 2-deoxyglucose as described in detail previously (43). Following the above incubations, muscles were blotted and transferred to flasks containing 1.5 ml of KHB with 1 mM 2-deoxy-[1,2-3H]glucose (1.5 mCi/mmol) and 39 mM [1-14C]mannitol (8 μCi/mmol) and the same additions as in the previous incubation. The flasks were incubated at 30 °C for 20 min and were continuously gassed with 95%O2/5%CO2. After the incubations, the muscles were frozen between tongs cooled to the temperature of liquid nitrogen, and stored at −80 °C until they were processed for measurement of 2-deoxyglucose transport. Frozen muscles were dissolved in 0.5 ml of 1 N KOH and were then neutralized with 0.5 ml of 1N HCl. The samples were mixed, and aliquots of the supernatant were counted for radioactivity in a liquid scintillation counter.
Photoaffinity Labeling of Isolated Epitrochlearis Muscles
Isolated muscles were photolabeled as described previously (44). Briefly, muscles were incubated in flasks containing 400 μM Bio-LC-ATB-BMPA for 4 min and then exposed to UV light in a Rayonet Photochemical reactor (Southern New England Ultraviolet, Branford, CT) for 4 min. Following the labeling, the muscles were trimmed of their tendons, blotted, and frozen between tongs cooled to the temperature of liquid nitrogen. Muscles were kept stored at −80 °C until processed.
Crude total membranes were prepared from the photolabeled muscles and solubilized, and GLUT4s were immunoprecipitated with streptavidin beads (Pierce) as described previously (44). Briefly, biotinylated GLUT4 was immunoprecipitated overnight from Thesit (Roche Applied Science)-solubilized crude membranes (equivalent amounts of protein) with 50 μl of streptavidin beads, and the beads were washed sequentially with 1% Thesit/PBS (4×), 0.1% Thesit/PBS (3×), and PBS (1×). Subsequent to immunoprecipitation, the immunocomplex was released from the streptavidin beads with Laemmli sample buffer and then subjected to SDS-PAGE. Resolved proteins were transferred to polyvinylidene difluoride membranes, blocked in 5% milk/Tris-buffered saline with 0.1% Tween 20 (TBST), and incubated with either affinity-purified GLUT4 (courtesy of Dr. Sam Cushman) or GLUT1 antiserum (courtesy of Dr. Larry Sliecker). Membranes were washed in TBST and incubated with alkaline phosphatase-coupled secondary antibody. Photolabeled GLUT4 or GLUT1 was detected via enhanced chemifluorescence and quantified by comparison to a plasma membrane standard that was run on each gel.
Tissue Lysate Preparation
Isolated muscles were incubated under the experimental conditions as described above. Following incubation, the muscles were trimmed of their tendons, blotted, and frozen between tongs cooled to the temperature of liquid nitrogen. Muscles were kept stored at −80 °C until processed.
Lysates were prepared from the incubated muscles essentially as described previously (43). Briefly, frozen muscles were homogenized in ice-cold lysis buffer (50 mM HEPES, pH 7.2, 2 mM EDTA, 30 mM sodium pyrophosphate, 1% Triton X-100, 10% glycerol, 10 mM NaF, 150 mM NaCl, 2 mMμg/ml leupeptin, 1.5 mg/ml benzamidine, 0.5 NaVO3, 5 mg/ml pepstatin A, 2 μg/ml aprotinin, 1 mM 4-(2-aminoethyl)benzene-sulfonylfluoride hydrochloride (Pefabloc, Roche Applied Science) and 10 μg/ml antipain) and mixed end over end for 30 min at 4 °C. Lysates were then spun at 20,000 × g for 30 min, and protein was determined on the supernatant via the bicinchoninic method (Pierce) using crystalline BSA as a standard.
Akt Western Blotting
Wistar epitrochlearis lysate protein samples (100 μg) were prepared for SDS-PAGE by the addition of 2× Laemmli sample buffer and boiled for 5 min. The samples, along with molecular weight markers (Amersham Biosciences) were loaded on a 7.5% SDS-PAGE gel. Resolved samples were transferred to polyvinylidene difluoride membrane (Bio-Rad). The membranes were rinsed in water and blocked in 5% nonfat dry milk in Tween Tris-buffered saline, pH 7.5 (TTBS), for 1 h. The membranes were then rinsed in TTBS and incubated overnight in affinity-purified anti-phospho-Akt (recognizing phosphoserine 473) (Cell Signaling, Beverly, MA). Following this step, the membranes were rinsed in TTBS and incubated in horseradish peroxidase-coupled goat anti-rabbit antibody for 2 h. The membranes were then rinsed in TTBS, and resolved bands were detected via enhanced chemifluorescence (Amersham Biosciences).
PI3K Kinase Assays
For phosphatidylinositol 3-kinase (PI3K) assays, 1 mg of lysate protein was immunoprecipitated overnight with 4 μg of α-IRS-1 antibody (UBI, Lake Placid, NY), and captured with protein G-agarose beads. The immunocomplexes were washed and incubated with 50 μl of the final wash buffer containing 20 μg of phosphatidylinositol, 100 mM MgCl2, 880 μM ATP, and 30 μCi of [γ-33P]ATP (PerkinElmer Life Sciences). The lipid products were resolved by TLC and quantified on an Amersham Biosciences PhosphorImager.
Immunofluorescent Labeling of Fixed Tissues
Following fixation in 2% paraformaldehyde/PBS for 2 h, tissues were washed with PBS and stored at 4 °C. A small section was excised from each tissue and incubated in 0.2% Triton X-100/0.05% Tween 20/PBS for 30 min at 25 °C. The sections were then rinsed three times in 0.05% Tween 20/PBS and blocked in 5% donkey serum/0.05% Tween 20/PBS (for caveolin-3 and dystrophin labeling) or 2% BSA/0.05% Tween 20/PBS (for actin and N-WASP labeling) for 60 min at 25 °C. Sections were then incubated overnight at 4 °C in mouse IgM anti-human F-actin (Serotech Oxford, UK), anti-N-WASP (Santa Cruz Biotechnology, Santa Cruz, CA), anti-dystrophin (Neomarkers, Inc., Fremont, CA), or anti-caveolin 3 (BD Biosciences) antibodies diluted 1:50 in blocking buffer. Samples were then washed extensively in 0.05% Tween 20/PBS. Sections were incubated for 45 min at 25 °C in 1:50 rhodamine-conjugated donkey anti-mouse IgM (for actin labeling), 1:50 fluorescein isothiocyanate-conjugated donkey anti-goat IgG (for caveolin-3 labeling), 1:50 fluorescein isothiocyanate-conjugated donkey anti-mouse IgG (for dystrophin labeling), and 1:50 rhodamine-conjugated donkey anti-rabbit IgG (for N-WASP labeling). All conjugated secondary antibodies were obtained from Jackson ImmunoResearch Laboratories, Inc. (West Grove, PA). Following secondary antibody incubation, samples were washed extensively with 0.05% Tween 20/PBS, rinsed with ddH2O, mounted to slides in Vectashield (Vector Laboratories, Inc., Burlingame, CA), and examined via confocal microscopy (Zeiss LSM 510 NLO Confocal Microscope). All images were taken in the same focal plane of the section and under identical microscopic parameters. Images shown are representative of three to five fields from each sample.
Statistical Analysis
The data were analyzed by analysis of variance to test the effect of treatment (insulin and latrunculin) on muscle glucose uptake, GLUT4 translocation, plasma membrane GLUT1 content, Akt phosphorylation, and PI3K kinase activity. When a significant F ratio was obtained, a Fisher’s post-least significant difference post hoc test was employed to identify statistically significant differences (p < 0.05) between the means.
RESULTS
Disruption of F-Actin Inhibits Insulin-stimulated Glucose Uptake
Previous studies (26, 27, 31, 45, 46) have reported that the actin-depolymerizing agent cytochalasin D and the actin monomer sequestering agents latrunculin A or latrunculin B can inhibit insulin-stimulated GLUT4 translocation in 3T3-L1 adipocytes and in primary adipocytes. Consistent with this effect on preventing GLUT4 mobilization to the cell surface, exposure of epitrochlearis muscles to increasing concentrations of latrunculin B for 2 h markedly reduced the ability of insulin to stimulate glucose uptake (Fig. 1, solid bars). Basal glucose transport was not affected at any concentration of latrunculin B tested (Fig. 1, open bars). Muscles exposed to 20 μM latrunculin B for 0.5, 1, or 2 h displayed a time-dependent decrease in insulin-stimulated glucose uptake (Fig. 2). Parallel studies performed with latrunculin A demonstrated a similar profile of impaired insulin-stimulated glucose transport (data not shown). Given the clear effect of 20 μM latrunculin B for 1 h on insulin-stimulated glucose transport, subsequent analyses were performed with this treatment parameter. Before evaluating the effect of latrunculin B on cortical F-actin, we studied the molecular architecture of the epitrochlearis muscle by using confocal immunofluorescence microscopy. To locate the position of the cell surface sarcolemma and the transverse tubular (t-tubule) membranes we used a specific antibody against caveolin-3, because the caveolae formed by homomultimers of this protein are located both at the sarcolemma and within the t-tubules (47). As shown in Fig. 3A (panel 1), both the sarcolemma (closed arrows) and t-tubule (open arrows) are labeled. To further clarify the observed staining pattern, we collected images of epitrochlearis muscle labeled with dystrophin, a protein that is part of a large oligomeric complex named the dystrophin-glycoprotein complex (DGC) (48 –51) that bridges across the sarcolemma and connects the extracellular matrix and the actin cytoskeleton. Our analyses revealed, as expected, marked cell surface sarcolemma membrane dystrophin staining (Fig. 3A, panel 2). Rhodamine-labeled phalloidin staining (data not shown) and anti-F-actin immunofluorescence (Fig. 3B) demonstrated that the muscles contained polymerized actin underneath and juxtaposed to the inner face of the sarcolemma membrane (Fig. 3B, panels 1 and 2). In parallel to the reduction in insulin-stimulated glucose transport activity, latrunculin B treatment resulted in a disruption of this cortical F-actin structure (Fig. 3, panels 3 and 4).
Fig. 1. Concentration dependence of latrunculin B on 2-deoxyglucose transport in isolated rat epitrochlearis muscles.
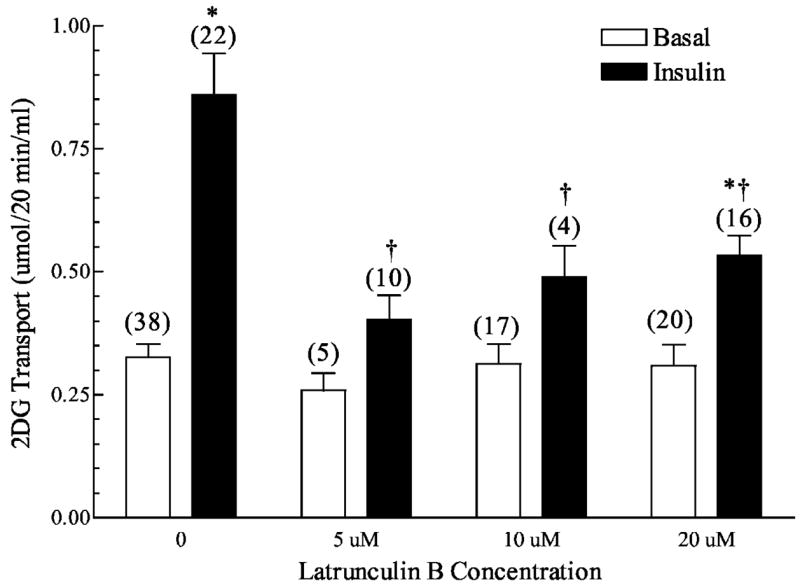
Wistar epitrochlearis muscles were removed and incubated in the presence or absence of 13.3 nM insulin and the indicated concentrations of latrunculin B. Numbers in parentheses indicate the number of observations. Values are the means ± S.E. *, significantly different from basal. †, significantly different from corresponding condition minus latrunculin B (p < 0.05).
Fig. 2. Time dependence of latrunculin B on 2-deoxyglucose transport in isolated rat epitrochlearis muscles.

Wistar epitrochlearis muscles were removed and incubated in the presence or absence of 13.3 nM insulin and 20 μM latrunculin B. Numbers in parentheses indicate number of observations. Values are the means ± S.E. *, significantly different from corresponding basal. †, significantly different from corresponding condition minus latrunculin B (p < 0.05). ‡, significantly different from corresponding 0.5-h incubation condition (p < 0.05).
Fig. 3. Effect of latrunculin B on cortical actin staining in isolated rat epitrochlearis muscles.

Wistar epitrochlearis muscles were removed and incubated in the presence or absence of 20 μM latrunculin B for 1 h. Muscles were then incubated in the presence or absence of 13.3 nM insulin and fixed in 2% paraformaldehyde/PBS for 2 h. Muscles were then processed and stained for: A, caveolin-3 (panel 1) and dystrophin (panel 2), or B, cortical actin as described under “Experimental Procedures.” Scale bar = 10 μm. Closed arrows denote sarcolemma, and open arrows indicate t-tubules.
Impaired Mobilization of GLUT4
To confirm that the inhibition of glucose uptake by the disruption of cortical actin was, in fact, because of a block in GLUT4 translocation, muscles were labeled with the Bio-LC-ATB-BMPA photolabeling technique (Fig. 4). As expected, cell surface GLUT4 content was considerably increased after insulin stimulation in control muscles when compared with basal (Fig. 4, open bars). Although the GLUT4 cell surface content in the basal state was not different in the absence or presence of latrunculin B, insulin-stimulated GLUT4 translocation was abolished in latrunculin B-treated muscles (Fig. 4, solid bars). It is unclear whether the extensive loss of cell surface GLUT4 in latrunculin B-treated muscle represents a complete blockade of translocation of this transporter. Because we do not observe a full loss of glucose transport, it is possible that the modest effect insulin has on GLUT1 is intact in latrunculin B-treated cells and/or an undetectable level of GLUT4 is present (e.g. t-tubule pool) and insulin stimulates the activity of those concealed transporters. With regard to the former possibility, additional GLUT1 photolabeling experiments revealed that neither insulin nor latrunculin demonstrated a significant effect on GLUT1 (Fig. 5). Thus, it remains formally possible that an undetectable level of GLUT4, possibly localized and concealed in t-tubules, is present and insulin stimulates the intrinsic activity of these transporters. Regardless, these data show for the first time in primary skeletal muscle that insulin-stimulated GLUT4 translocation and glucose uptake are dependent on cortical F-actin organization.
Fig. 4. Effect of latrunculin B on GLUT4 translocation in isolated rat epitrochlearis muscles.

Wistar epitrochlearis muscles were removed and incubated in the presence or absence of 13.3 nM insulin and 20 μM latrunculin B for 1 h. Muscles were then incubated in 400 μM Bio-LC-ATB-BMPA, which was then cross-linked to the transporters via exposure to UV light. Muscles were then processed as described under “Experimental Procedures.” A representative Western blot is shown above the graph. Numbers in parentheses indicate number of observations. Values are the means ± S.E. *, significantly different from basal. †, significantly different from corresponding condition minus latrunculin B (p < 0.05).
Fig. 5. Effect of latrunculin B on plasma membrane GLUT1 content in isolated rat epitrochlearis muscles.
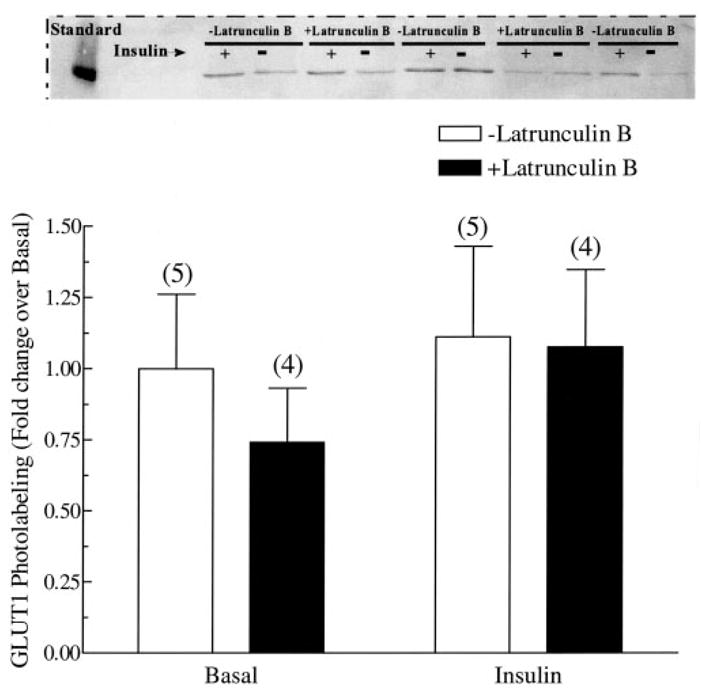
Wistar epitrochlearis muscles were removed and incubated in the presence or absence of 13.3 nM insulin and 20 μM latrunculin B for 1 h. Muscles were then incubated in 400 μM Bio-LC-ATB-BMPA, which was then cross-linked to the transporters via exposure to UV light. Muscles were then processed as described under “Experimental Procedures.” A representative Western blot is shown above the graph. Numbers in parentheses indicate number of observations. Values are the means ± S.E. *, significantly different from basal. †, significantly different from corresponding condition minus latrunculin B (p < 0.05).
Propagation of the Insulin Signal Regulating GLUT4 Translocation Is Intact in Latrunculin B-treated Muscle
There are several possible mechanisms that could account for the decreased insulin-stimulated GLUT4 translocation by disrupted cytoskeletal mechanics. However, consistent with previous work (23, 52), known proximal insulin signal transduction events, including the insulin receptor autophosphorylation and insulin receptor substrate protein tyrosine phosphorylation were not compromised in muscles treated with latrunculin B (data not shown). In full agreement, latrunculin B treatment did not affect PI3K activity in IRS1 immunoprecipitates from muscles treated with insulin for 30 or 60 min (Fig. 6). To assess whether latrunculin B inhibits the phosphorylation of Akt, we used an antiphospho-Ser-473 Akt antibody. Concomitant with the normal PI3K activity, phosphorylation of the distal effector of this enzyme was characteristic in latrunculin B-treated muscle (Fig. 7). Although a complete analysis of the novel PI3K-independent signaling route of insulin action involving TC10 was out of the scope of the present work, we did seek to enhance our understanding of whether an apparent distal effector of TC10, N-WASP, was responsive to insulin in the intact muscle preparation. Because previous cell culture studies show an insulin-stimulated localization of N-WASP from the cytoplasm to cortical F-actin in response to insulin (22), we used polyclonal antibodies against N-WASP to detect the localization of this endogenous protein in skeletal muscle. Fig. 8 shows that in the basal state N-WASP expression is diffuse in the cytoplasm, and the displayed immunofluorescence intensity was very weak, if at all noticeable (Fig. 8, panel 1). Consistent with findings in 3T3-L1 adipocytes (22), N-WASP labeling displayed a marked enhancement in intensity and an apparent enrichment at the region of cortical F-actin in response to insulin stimulation (Fig. 8, panel 2). Exposure of the muscle to latrunculin B abrogated the response of this protein to insulin treatment (Fig. 8, panel 4) with no apparent effect on the basal cellular distribution of N-WASP (Fig. 8, panel 3).
Fig. 6. Effect of latrunculin B on insulin stimulated IRS-1 precipitable PI3K activity in Wistar epitrochlearis muscles.
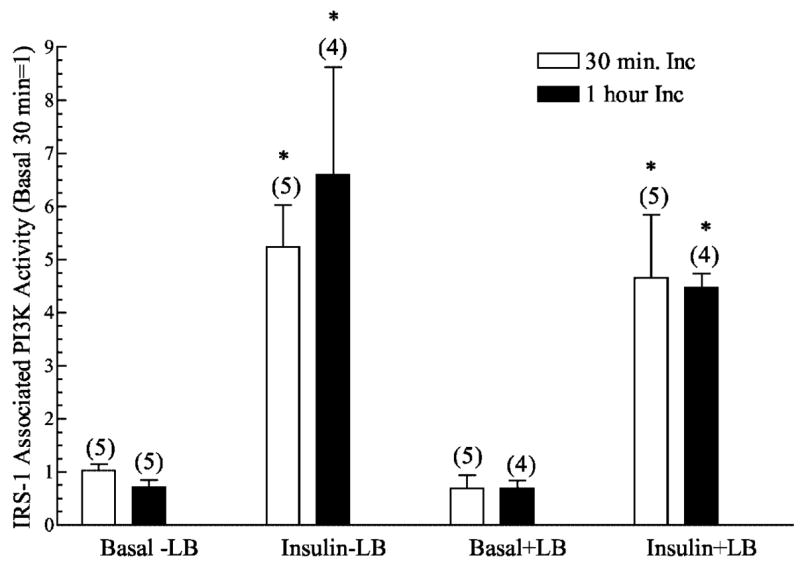
IRS-1-associated PI3K kinase activity was immunoprecipitated from lysates made from muscles that had bee incubated with latrunculin B for 30 min or 1 h and then stimulated or not with 13.3 nM insulin. PI3K activity was then measured as described under “Experimental Procedures.” Values are in relative units with the basal set = 1 and are presented as means ± S.E. Numbers in parentheses indicate number of observations. *, significantly different from basal (p < 0.05).
Fig. 7. Effect of latrunculin B on insulin stimulated Akt phosphorylation in Wistar epitrochlearis muscles stimulated with 13.3 nM insulin.
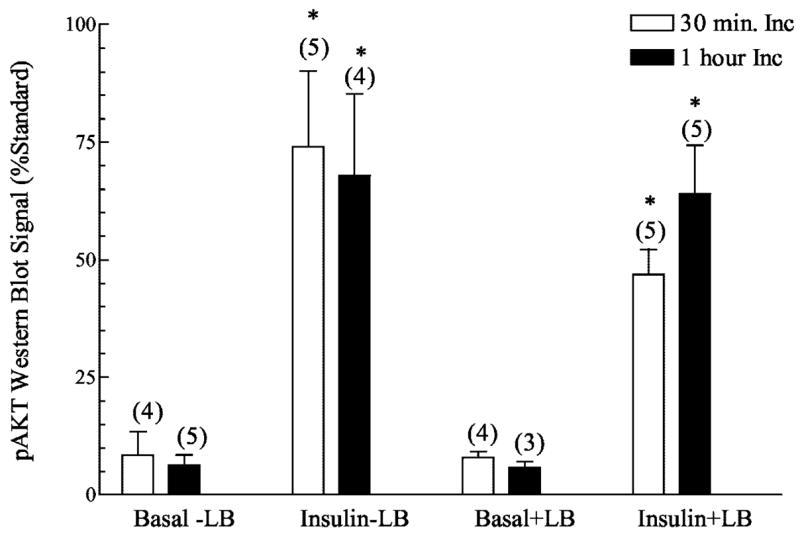
Phosphorylated Akt Western blotting was performed on lysates (100 μg of protein) from muscles incubated with latrunculin B for 30 min or 1 h. Values are in relative units expressed as a percentage of a standard that was run on each get and are presented as means ± S.E. Numbers in parentheses indicate number of observations. *, significantly different from basal (p < 0.05).
Fig. 8. Effect of latrunculin B on N-WASP staining in isolated rat epitrochlearis muscles.
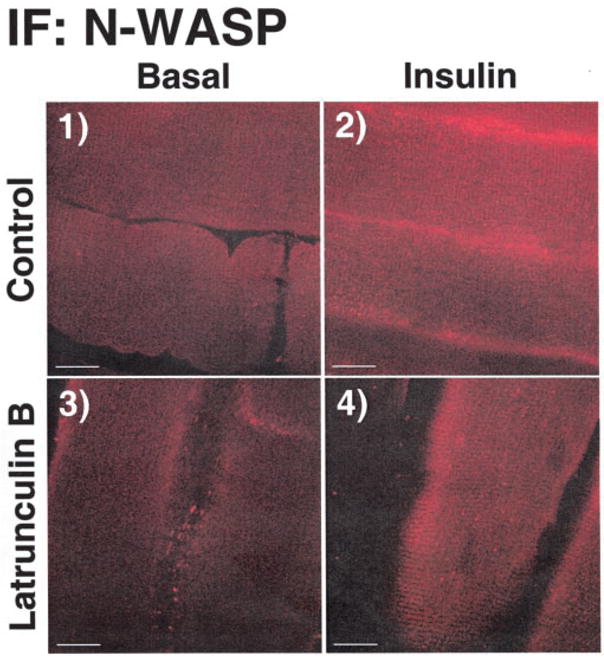
Wistar epitrochlearis muscles were removed and incubated in the presence or absence of 20 μM latrunculin B for 1 h. Muscles were then incubated in the presence or absence of 13.3 nM insulin and fixed in 2% paraformaldehyde/PBS for 2 h. Muscles were then processed and stained for N-WASP as described under “Experimental Procedures.” Scale bar = 10 μm.
DISCUSSION
Over the past 30 years one of the most extensively investigated effects of insulin in mammalian cells is its ability to stimulate glucose transport by initiating the translocation of the GLUT4 glucose transporter to the plasma membrane from its intracellular storage site. Recently, numerous studies have provided evidence that cytoskeletal mechanics play an essential role in the translocation of GLUT4 to the plasma membrane (22, 23, 39, 52–58). In particular, pharmacological disruption of cortical F-actin causes a profound disturbance in GLUT4 translocation and glucose transport (23, 55, 59). Although these data are consistent with the conclusion that the cellular cytoskeleton is involved in the translocation of GLUT4 to the plasma membrane, they have all been carried out in cultured cell model systems. It has previously been noted that diverse cell models may display different cellular organization of F-actin (23). Data interpretation is further complicated by the adherent nature of these cells that results in a considerable amount of actin stress fibers, which, like cortical F-actin, is affected by depolymerizing agents (23, 26). To build a better understanding of the importance of the cytoskeletal system in the glucose transport process, Omata et al. (26) recently used primary adipocytes in their work. However, evidence has suggested that isolated rat adipocytes may not be entirely representative of adipocytes in vivo (38). To circumvent these issues, we examined the role of the F-actin cytoskeletal system in GLUT4 translocation and glucose transport using rat epitrochlearis muscle. The main finding of our work was that a substantial loss of GLUT4 translocation and glucose transport occurred after cortical F-actin disruption in this intact skeletal muscle preparation. Several other aspects of the current work provide important insight into cytoskeletal mechanics and glucose transport events.
First, our confocal imaging did not clearly reveal a change in cortical F-actin organization following insulin treatment. Although this has been demonstrated in cell culture models (23, 55), our failure to detect this most likely reflects the fact that the insulin effect on cortical actin is difficult to detect in fixed samples, whereas it is readily apparent when visualized by time-lapse confocal microscopy in living cells (23). In any case, the loss of insulin action with the latrunculin B-induced cortical F-actin disruption supports a regulatory role for this structure for insulin responsiveness in intact skeletal muscle. Although insulin-stimulated reorganization of cortical F-actin warrants further investigation in intact skeletal muscle, Ijuin and Takenawa (60), showed that lowering of insulin-stimulated production of phosphatidylinositol 3,4,5-trisphosphate (PIP3) by overexpression of SKIP inositol phosphatase in Chinese hamster ovary cells inhibited both actin-dependent membrane ruffling and GLUT4 translocation. Thus, these authors were able to demonstrate the inhibition of insulin-stimulated GLUT4 translocation and cortical F-actin remodeling independent of the disruption of pre-existing actin structures, which gives additional support to the involvement of cortical F-actin remodeling in this process.
Another interesting observation is that removal of the actin mesh beneath the plasma membrane did not result in an increased basal-state level of GLUT4 in the plasma membrane. This finding may indicate that under basal conditions retention of GLUT4 from the plasma membrane does not rely on a cortical actin barrier. However, it certainly remains possible that a cortical F-actin barrier meshwork may exist, and that the basal-state level of GLUT4 does not increase because of a concomitant loss of cytoskeletal structure that facilitates the final stages regulating the approach and incorporation of GLUT4-containing vesicles to the plasma membrane. Although there may exist two functionary roles of the cortical F-actin, of which further testing is needed to dissect, this work now provides clear evidence that the organization of cortical F-actin is crucial in the insulin-regulated mobilization of GLUT4 to the cell surface.
Disconnect between the residual insulin-stimulated glucose transport (~50%) and the extensive loss of insulin-stimulated GLUT4 translocation in latrunculin B-treated muscle is difficult to reconcile. Certainly, the transport activity of the GLUT1 glucose transporter isoform, may account, at least in part, for the cellular uptake of glucose in this muscle preparation. However, the fact that insulin did not alter plasma membrane GLUT1 levels makes it difficult to reconcile how this transporter isoform could fully account for this discrepancy. In the same context, there is also significant evidence that insulin and other stimuli can alter the activity of GLUT4 transporters (61, 62). Thus, the ability of insulin to stimulate the “intrinsic activity” of the basal pool of GLUT4 in the plasma membrane may not be dependent on cortical F-actin. Another possibility may be that a pre-docked population of GLUT4 protein exists at the membrane, and this pool can fuse and function in the absence of actin regulation, as previously noted in GLUT4 transgenic mice (63). Hence, the ability of insulin to stimulate glucose uptake to some extent during latrunculin B exposure may reflect the uptake of glucose by a pre-existing pool of GLUT4 (possibly obscured to some extent in the t-tubule network), whose activity may also be enhanced by insulin. However, this explanation could only be true if the level of detection by photolabeling and Western blotting was partial. In agreement with this type of methodological limitation, we have observed similar results in previous experiments with the tritiated version of the GLUT4 photolabel (64 –66).
Cytoskeletal regulation of PI3K has been suggested with the observation that the p85 regulatory subunit of PI3K associates with cortical F-actin in L6 muscles cells (52). Our work demonstrates that the ability of insulin to activate PI3K is not rendered ineffective in muscles that lack cortical F-actin. Furthermore, propagation of its signal to the downstream effector Akt was also intact. Nonetheless, it has been reported that disruption of the cortical actin network with latrunculin B reduced the generation of PIP3 in the plasma membrane (52). Thus, it remains formally possible that cortical actin places a spatial limitation on PI3K such that the kinase is localized near phosphatidylinositol 4,5-bisphosphate in the membrane. This, in turn, may create localized regions in the plasma membrane where PIP3 is generated, cortical F-actin structures form, signaling molecules complex, and GLUT4 translocation occurs. When cortical F-actin is disrupted, either less PIP3 would then be generated or this phosphoinositide second messenger is no longer spatially constrained into “patches” where distal effectors can bind or GLUT4 translocation can occur. Given that the PIP3-dependent activation of Akt was not compromised in latrunculin B-treated muscle, our data favor that the subcellular localization of PI3K/PIP3, not the amount of PIP3 that is generated, may be more crucial than activation of PI3K by insulin. Nevertheless, in contrast to our findings, a decrement in insulin-stimulated Akt phosphorylation has been reported in cultured cells pretreated with latrunculin B (39). This may be related to differences in cytoskeletal structure between cultured cells and intact skeletal muscle, as outlined previously. Alternatively, enough cortical actin may have remained intact in the present study to allow for generation of sufficient PIP3 “patches” to promote translocation and activation of Akt. However, we believe that the first possibility is unlikely, because we have incubated muscles for periods of time longer than 1 h and obtained similar results (data not shown). Furthermore, in direct support of our findings another study using the 3T3-L1-adipocyte cell culture model system found no latrunculin B-induced defect in Akt phosphorylation (23). An actin-independent activation of Akt by insulin is consistent with the idea that both the mobilization of the enzyme to the plasma membrane and phosphoinositide-dependent kinase action are also independent of actin. Although engagement of this enzyme by insulin appears independent of actin, we speculate that further dissection of Akt/GLUT4-regulatory events will reveal an importance for actin-dependent localized “foci” of PIP3 in insulin action, GLUT4 translocation, and glucose transport.
In this regard, ample evidence suggests that the actin cytoskeleton is crucial for segregation of insulin effectors to the proper cellular compartment to initiate GLUT4 translocation. For example, it has been demonstrated in various cell models (L6 muscle, HEK293, and 3T3-L1 adipocytes) that disruption of cortical actin with latrunculin B or cytochalasin D prevents the association of PI3K and Akt with these structures at the plasma membrane (23, 27, 39). Consistent with the importance of spatial regulation, release of insulin receptor substrate proteins from an intracellular complex has been implicated in the development of insulin resistance (67). Nonetheless, given that this perturbation in IRS release was shown to not influence both phosphotyrosine- and IRS-associated PI3K activity, our results showing no decrement in insulin-stimulated PI3K/Akt activity in muscles preincubated with latrunculin B are consistent with the idea that spatial regulation of these molecules by actin is not crucial in signal propagation through Akt in the insulin signaling network. Furthermore, these data may suggest that the insulin receptor, IRS proteins, and PI3K exist in a complex or in close proximity prior to insulin binding to the receptor. In contrast, the striking loss of the spatial localization of N-WASP by insulin in the presence of latrunculin B is remarkable, supports in vitro data showing a role for this protein in the regulation of GLUT4 by insulin (22), and is consistent with a model whereby insulin initiates the localization of N-WASP to pre-existing cortical actin structures, which, in turn, stimulates the Arp2/3 complex to nucleate actin filaments. It is important to note, however, that in concert with the appearance of N-WASP at the plasma membrane after insulin stimulation, there is also a marked increase in its immunofluorescent intensity. Given the overall low level of detection in the basal state, it is difficult to discern whether insulin causes a redistribution of the protein. However, our data are intriguing, because the inactive N-WASP protein’s carboxyl-terminal VCA (Verprolin homology, Cofilin like, Acidic region) domain is masked by its basic-GBD domain (68–71). Upon activation, the VCA domain becomes exposed and binds monomeric actin, Arp2/3, and other associated proteins and serves as a site for cortical actin remodeling (68, 71). In concert with insulin activating this regulator of actin polymerization, the antibody utilized for immunofluorescent detection of N-WASP in the present work recognizes a masked epitope on N-WASP. Thus, our immunofluorescence detection must likely reveal activated N-WASP in regions undergoing actin remodeling.
Whether or not proximal disturbances in TC10 signal transduction by latrunculin exist remains to be determined. However, a functional TC10-dependent signaling pathway leading to actin remodeling may not occur in L6-myocytes or skeletal muscle, as in adipocytes (12, 13), which may indicate the involvement of other unknown N-WASP-activating pathways such as the recently described WASP-interacting SH3 (WISH) protein (71). Regardless, our data clearly show for the first time in intact skeletal muscle that N-WASP responds to insulin, and this response is dependent on cortical actin structure.
In summary, our data demonstrate for the first time that actin cytoskeletal mechanics are crucial for insulin-stimulated GLUT4 translocation in intact skeletal muscle. In addition, cell surface actin structure was revealed not to be critical for initial insulin signal transduction events or a portion of insulin-stimulated glucose transport, because cortical F-actin disruption had no effect on IRS-1-associated PI3K activity, Akt phosphorylation, or approximately half of insulin-stimulated glucose transport. In contrast, the loss of a pre-existing actin filament network at the cell surface hindered insulin-stimulated N-WASP recruitment and presumably new filament growth. These data are consistent with a model whereby cortical F-actin is essential in insulin action regulating GLUT4 translocation and glucose transport. Testing the combinatorial effects of cytoskeletal mechanics on signal transduction and GLUT4 translocation, along with the further characterization of key molecules for rapid rearrangement of cortical actin filaments, should help provide additional insights into the physiology of insulin action and the pathophysiology of insulin resistance.
Acknowledgments
We thank Dr. Geoffrey Holman for his gracious donation of the Bio-LC-ATB-BMPA GLUT4 photolabeling reagent.
Footnotes
This work was supported by National Center for Complementary and Alternative Medicine Grant AT001846 (to J. S. E.), American Diabetes Foundation Career Development Award 60779 (to J. S. E.), and an American Heart Association Midwest Affiliate Predoctoral Fellowship (to A. B. S.).
The abbreviations used are: GLUT4, glucose transporter 4; Bio-LC-ATB-BMPA, 4,4′-O-[2-[2-[2-[2-[2-[6(biotinylamino)hexanoyl]amino]-ethoxy]ethoxy]ethyoxy]-4-(1-azi-2,2,2,-triethyl)benzoyl]amino-1,3-propanediyl]bis-D-mannose; PI3K, phosphatidylinositol 3-kinase; N-WASP, neural Wiskott-Aldrich syndrome protein; KHB, Krebs-Henseleit buffer; BSA, bovine serum albumin; PBS, phosphate-buffered saline; TBST, Tris-buffered saline with Tween; TTBS, Tween Tris- buffered saline; t-tubule, transverse tubular; PIP3, phosphatidylinositol 3,4,5-trisphosphate; IRS, insulin receptor substrate.
References
- 1.Defronzo RA, Jacto E, Jequier E, Maeder E, Wahren J, Felber JP. Diabetes. 1981;30:1000–1007. doi: 10.2337/diab.30.12.1000. [DOI] [PubMed] [Google Scholar]
- 2.Kayano T, Burant CF, Fukumoto H, Gould GW, Fan Y, Eddy RL, Byers MG, Shows TB, Seino S, Bell GI. J Biol Chem. 1990;265:13276–13282. [PubMed] [Google Scholar]
- 3.Kahn BB. J Clin Invest. 1992;89:1367–1374. doi: 10.1172/JCI115724. [DOI] [PMC free article] [PubMed] [Google Scholar]
- 4.Kandror KV, Pilch PF. J Biol Chem. 1996;271:21703–21708. doi: 10.1074/jbc.271.36.21703. [DOI] [PubMed] [Google Scholar]
- 5.Pessin JE, Thurmond DC, Elmendorf JS, Coker KJ, Okada S. J Biol Chem. 1999;274:2593–2596. doi: 10.1074/jbc.274.5.2593. [DOI] [PubMed] [Google Scholar]
- 6.Rea S, James D. Diabetes. 1997;46:1667–1677. doi: 10.2337/diab.46.11.1667. [DOI] [PubMed] [Google Scholar]
- 7.Yang J, Gillingham AK, Hodel A, Koumanov F, Woodward B, Holman GD. Am J Physiol. 2002;283:E1299–E1307. doi: 10.1152/ajpendo.00341.2002. [DOI] [PubMed] [Google Scholar]
- 8.Satoh S, Nishimura H, Clark A, Kozka I, Vannucci S, Simpson I, Quon M, Cushman S, Holman G. J Biol Chem. 1993;268:17820–17829. [PubMed] [Google Scholar]
- 9.Jhun B, Rampal A, Liu H, Lachaal M, Jung C. J Biol Chem. 1992;267:17710–17715. [PubMed] [Google Scholar]
- 10.Czech M, Buxton J. J Biol Chem. 1993;268:9187–9190. [PubMed] [Google Scholar]
- 11.Holman GD, Sandoval IV. J Cell Sci. 2001;11:173–179. doi: 10.1016/s0962-8924(01)01953-5. [DOI] [PubMed] [Google Scholar]
- 12.JeBailey L, Rudich A, Huang X, Ciano-Oliveira CD, Kapus A, Klip A. Mol Endocrinol. 2004;18:359–372. doi: 10.1210/me.2003-0294. [DOI] [PubMed] [Google Scholar]
- 13.Thirone ACP, Carvalheira JBC, Hirata AE, Velloso LA, Saad MJA. Endocrinology. 2004;145:281–293. doi: 10.1210/en.2003-0575. [DOI] [PubMed] [Google Scholar]
- 14.Ribon V, Saltiel AR. Biochem J. 1997;324:839–845. doi: 10.1042/bj3240839. [DOI] [PMC free article] [PubMed] [Google Scholar]
- 15.Liu J, DeYoung SM, Hwang JB, O’Leary EE, Saltiel AR. J Biol Chem. 2003;278:36754–36762. doi: 10.1074/jbc.M300664200. [DOI] [PubMed] [Google Scholar]
- 16.Ribon V, Herrera R, Kay BK, Saltiel AR. J Biol Chem. 1998;273:4073–4080. doi: 10.1074/jbc.273.7.4073. [DOI] [PubMed] [Google Scholar]
- 17.Liu J, Kimura A, Baumann CA, Saltiel AR. Mol Cell Biol. 2002;22:3599–3609. doi: 10.1128/MCB.22.11.3599-3609.2002. [DOI] [PMC free article] [PubMed] [Google Scholar]
- 18.Chiang SH, Baumann CA, Kanzaki M, Thurmond DC, Watson RT, Neudauer CL, Macara IG, Pessin JE, Saltiel AR. Nature. 2001;410:944–948. doi: 10.1038/35073608. [DOI] [PubMed] [Google Scholar]
- 19.Watson RT, Shigematsu S, Chiang SH, Mora S, Kanzaki M, Macara IG, Saltiel AR, Pessin JE. J Cell Biol. 2001;154:829–840. doi: 10.1083/jcb.200102078. [DOI] [PMC free article] [PubMed] [Google Scholar]
- 20.Chunqiu Hou J, Pessin JE. Mol Biol Cell. 2003;14:3578–3591. doi: 10.1091/mbc.E03-01-0012. [DOI] [PMC free article] [PubMed] [Google Scholar]
- 21.Inoue M, Chang L, Hwang J, Chiang SH, Saltiel AR. Nature. 2003;422:629–633. doi: 10.1038/nature01533. [DOI] [PubMed] [Google Scholar]
- 22.Jiang ZY, Chawla A, Bose A, Way M, Czech MP. J Biol Chem. 2002;277:509–515. doi: 10.1074/jbc.M108280200. [DOI] [PubMed] [Google Scholar]
- 23.Kanzaki M, Pessin JE. J Biol Chem. 2001;276:42436–42444. doi: 10.1074/jbc.M108297200. [DOI] [PubMed] [Google Scholar]
- 24.Kanzaki M, Pessin JE. J Biol Chem. 2002;277:25867–25869. doi: 10.1074/jbc.C200292200. [DOI] [PubMed] [Google Scholar]
- 25.Kanzaki M, Watson RT, Hou JC, Stamnes M, Saltiel AR, Pessin JE. Mol Biol Cell. 2002;13:2334–2346. doi: 10.1091/mbc.01-10-0490. [DOI] [PMC free article] [PubMed] [Google Scholar]
- 26.Omata W, Shibata H, Li L, Takata K, Kojima I. Biochem J. 2000;346:321–328. [PMC free article] [PubMed] [Google Scholar]
- 27.Wang Q, Bilan PJ, Tsakiridis T, Hinek A, Klip A. Biochem J. 1998;331:917–928. doi: 10.1042/bj3310917. [DOI] [PMC free article] [PubMed] [Google Scholar]
- 28.Tsakiridis T, Bergman A, Somwar R, Taha C, Aktories K, Cruz TF, Klip A, Downey GP. J Biol Chem. 1998;273:28322–28331. doi: 10.1074/jbc.273.43.28322. [DOI] [PubMed] [Google Scholar]
- 29.Bose A, Cherniack AD, Langille SE, Nicoloro SMC, Buxton JM, Park JG, Chawla A, Czech MP. Mol Cell Biol. 2001;21:5262–5275. doi: 10.1128/MCB.21.15.5262-5275.2001. [DOI] [PMC free article] [PubMed] [Google Scholar]
- 30.Emoto M, Klarlund JK, Waters SB, Hu V, Buxton JM, Chawla A, Czech MP. J Biol Chem. 2000;275:7144–7151. doi: 10.1074/jbc.275.10.7144. [DOI] [PubMed] [Google Scholar]
- 31.Tsakiridis T, Vranic M, Klip A. J Biol Chem. 1994;269:29934–29942. [PubMed] [Google Scholar]
- 32.Asahi Y, Hayashi H, Wang L, Ebina Y. J Med Invest. 1999;46:192–199. [PubMed] [Google Scholar]
- 33.Guilherme A, Emoto M, Buxton JM, Bose S, Sabini R, Theurkauf WE, Leszyk J, Czech MP. J Biol Chem. 2000;275:38151–38159. doi: 10.1074/jbc.M003432200. [DOI] [PubMed] [Google Scholar]
- 34.Marcusohn J, Isakoff SJ, Rose E, Symons M, Skolnik EY. Curr Biol. 1995;5:1296–1302. doi: 10.1016/s0960-9822(95)00256-9. [DOI] [PubMed] [Google Scholar]
- 35.Patki V, Buxton J, Chawla A, Lifshitz L, Fogarty K, Carrington W, Tuft R, Corvera S. Mol Biol Cell. 2001;12:129–141. doi: 10.1091/mbc.12.1.129. [DOI] [PMC free article] [PubMed] [Google Scholar]
- 36.Nakashima N, Rose DW, Xiao S, Egawa K, Martin SS, Haruta T, Saltiel AR, Olefsky JM. J Biol Chem. 1999;274:3001–3008. doi: 10.1074/jbc.274.5.3001. [DOI] [PubMed] [Google Scholar]
- 37.Wilson CM, Mitsumoto Y, Maher F, Klip A. FEBS Lett. 1995;368:19–22. doi: 10.1016/0014-5793(95)00589-2. [DOI] [PubMed] [Google Scholar]
- 38.Ruan H, Zarnowski MJ, Cushman SW, Lodish HF. J Biol Chem. 2003;278:47585–47953. doi: 10.1074/jbc.M305257200. [DOI] [PubMed] [Google Scholar]
- 39.Peyrollier K, Hajduch E, Gray A, Litherland GJ, Prescott AR, Hundal HS. Biochem J. 2000;352:617–622. [PMC free article] [PubMed] [Google Scholar]
- 40.Ferrannini E, Smith JD, Cobelli C, Pilo G, DeFronzo RA. J Clin Invest. 1985;76:357–364. doi: 10.1172/JCI111969. [DOI] [PMC free article] [PubMed] [Google Scholar]
- 41.Defronzo RA, Gunnarsson R, Bjorkman O, Olsson M, Wahren J. J Clin Invest. 1985;76:149–155. doi: 10.1172/JCI111938. [DOI] [PMC free article] [PubMed] [Google Scholar]
- 42.Henriksen EJ, Holloszy JO. Acta Physiol Scand. 1991;143:381–386. doi: 10.1111/j.1748-1716.1991.tb09249.x. [DOI] [PubMed] [Google Scholar]
- 43.Brozinick JT, Birnbaum MJ. J Biol Chem. 1998;273:14679–14682. doi: 10.1074/jbc.273.24.14679. [DOI] [PubMed] [Google Scholar]
- 44.Ryder JW, Yang J, Galuska D, Rincon J, Bjornholm M, Krook A, Lund S, Pedersen O, Wallberg-Henriksen H, Zierath JR, Holman GD. Diabetes. 2000;49:647–654. doi: 10.2337/diabetes.49.4.647. [DOI] [PubMed] [Google Scholar]
- 45.Emoto M, Langille SE, Czech MP. J Biol Chem. 2001;276:10677–10682. doi: 10.1074/jbc.M010785200. [DOI] [PubMed] [Google Scholar]
- 46.Tsakiridis T, Vranic M, Klip A. Biochem J. 1995;309:1–5. doi: 10.1042/bj3090001. [DOI] [PMC free article] [PubMed] [Google Scholar]
- 47.Gabella G. J Ultrastruct Res. 1978;65:135–147. doi: 10.1016/s0022-5320(78)90051-5. [DOI] [PubMed] [Google Scholar]
- 48.Ervasti JM, Campbell KP. Cell. 1991;66:1121–1131. doi: 10.1016/0092-8674(91)90035-w. [DOI] [PubMed] [Google Scholar]
- 49.Campbell KP, Kahl SD. Nature. 1989;338:259–262. doi: 10.1038/338259a0. [DOI] [PubMed] [Google Scholar]
- 50.Yoshida M, Ozawa E. J Biochem. 1990;108:748–752. doi: 10.1093/oxfordjournals.jbchem.a123276. [DOI] [PubMed] [Google Scholar]
- 51.Suzuki A, Yoshida M, Hayashi K, Mizuno Y, Hagiwara Y, Ozawa E. Eur J Biochem. 1994;220:283–292. doi: 10.1111/j.1432-1033.1994.tb18624.x. [DOI] [PubMed] [Google Scholar]
- 52.Patel N, Rudich A, Khayat ZA, Garg R, Klip A. Mol Cell Biol. 2003;23:4611–4626. doi: 10.1128/MCB.23.13.4611-4626.2003. [DOI] [PMC free article] [PubMed] [Google Scholar]
- 53.Shigematsu S, Khan AH, Kanzaki M, Pessin JE. Mol Endocrinol. 2002;16:1060–1068. doi: 10.1210/mend.16.5.0836. [DOI] [PubMed] [Google Scholar]
- 54.Tong P, Khayat ZA, Huang C, Patel N, Ueyama A, Klip A. J Clin Invest. 2001;108:371–381. doi: 10.1172/JCI12348. [DOI] [PMC free article] [PubMed] [Google Scholar]
- 55.Klip A, Li D, Khayat ZA, Randhawa V, Foster LJ. CSBMCB/SCBBMC Bulletin. CSBMCB Press; Toronto: 2001. pp. 39–51. [Google Scholar]
- 56.Kanzaki M, Watson RT, Khan AH, Pessin JE. J Biol Chem. 2001;276:49331–49336. doi: 10.1074/jbc.M109657200. [DOI] [PubMed] [Google Scholar]
- 57.Khaynet ZA, Tong P, Yaworsky K, Bloch RJ, Klip A. J Cell Sci. 2000;113:279–290. doi: 10.1242/jcs.113.2.279. [DOI] [PubMed] [Google Scholar]
- 58.Tsakiridis T, Wang Q, Tata C, Grinstein S, Downey G, Klip A. Cytoskeletal Regulation of Membrane Function. Rock-feller University Press; New York: 1997. pp. 257–271. [Google Scholar]
- 59.Fenteany G, Zhu S. Curr Top Med Chem. 2003;3:593–616. doi: 10.2174/1568026033452348. [DOI] [PubMed] [Google Scholar]
- 60.Ijuin T, Takenawa T. Mol Cell Biol. 2003;23:1209–1220. doi: 10.1128/MCB.23.4.1209-1220.2003. [DOI] [PMC free article] [PubMed] [Google Scholar]
- 61.Sweeney G, Somwar R, Ramlal T, Volchuk A, Ueyama A, Klip A. J Biol Chem. 1999;274:10071–10078. doi: 10.1074/jbc.274.15.10071. [DOI] [PubMed] [Google Scholar]
- 62.Somwar R, Perreault M, Kapur S, Taha C, Sweeney G, Ramlal T, Kim D, Keen J, Cote C, Klip A, Marette A. Diabetes. 2000;49:1794–1800. doi: 10.2337/diabetes.49.11.1794. [DOI] [PubMed] [Google Scholar]
- 63.Brozinick JT, Yaspelkis BB, Wilson CM, Grant KE, Gibbs EM, Cushman SW, Ivy JL. Biochem J. 1996;313:133–140. doi: 10.1042/bj3130133. [DOI] [PMC free article] [PubMed] [Google Scholar]
- 64.Brozinick JT, Jr, Reynolds TH, Dean D, Cartee G, Cushman SW. Biochem J. 1999;339:533–540. [PMC free article] [PubMed] [Google Scholar]
- 65.Brozinick JT, McCoid SC, Reynolds TH, Wilson CM, Stevenson RW, Cushman SW, Gibbs EM. Biochem J. 1997;321:75–81. doi: 10.1042/bj3210075. [DOI] [PMC free article] [PubMed] [Google Scholar]
- 66.Brozinick JT, Jr, McCoid SC, Reynolds TH, Nardone NA, Hargrove DM, Stevenson RW, Cushman SW, Gibbs EM. Diabetes. 2001;50:593–600. doi: 10.2337/diabetes.50.3.593. [DOI] [PubMed] [Google Scholar]
- 67.Clark SF, Molero JC, James DE. J Biol Chem. 2000;275:3819–3826. doi: 10.1074/jbc.275.6.3819. [DOI] [PubMed] [Google Scholar]
- 68.Caron E. Curr Opin Cell Biol. 2002;14:82–87. doi: 10.1016/s0955-0674(01)00298-8. [DOI] [PubMed] [Google Scholar]
- 69.Peterson JR, Lokey RS, Mitchison TJ, Kirschner MW. Proc Natl Acad Sci U S A. 2001;98:10624–10629. doi: 10.1073/pnas.201393198. [DOI] [PMC free article] [PubMed] [Google Scholar]
- 70.Peterson JR, Mitchison TJ. Chem Biol. 2002;9:1275–1285. doi: 10.1016/s1074-5521(02)00284-3. [DOI] [PubMed] [Google Scholar]
- 71.Takenawa T, Miki H. J Cell Sci. 2001;114:1801–1809. doi: 10.1242/jcs.114.10.1801. [DOI] [PubMed] [Google Scholar]