

Abstract
Background & Aims
Methionine adenosyltransferase (MAT) catalyzes S-adenosylmethionine biosynthesis. Two genes (MAT1A and MAT2A) encode for the catalytic subunit of MAT, while a third gene (MAT2β) encodes for a regulatory subunit that modulates the activity of MAT2A-encoded isoenzyme. We uncovered multiple splicing variants while characterizing its 5′-flanking region. The aims of our current study are to examine the expression pattern, regulation, and functions of the 2 major variants: V1 and V2.
Methods
Studies were conducted using RNA from normal human tissues, resected hepatocellular carcinoma specimens, and cell lines. Gene expression, promoter and nuclear binding activities, growth, and apoptosis were measured by routine assays.
Results
MAT2β is expressed in most but not all tissues, and the 2 variants are differentially expressed. The messenger RNA levels of both variants are markedly increased in hepatocellular carcinoma. Tumor necrosis factor (TNF)-α, which induces MAT2A in HepG2 cells, also induced V1 (but not V2) expression. TNF-α induced the promoter activity of MAT2β V1, likely via nuclear factor κB and activator protein 1. Both variants regulate growth, but only V1 regulates apoptosis. Reduced expression of V1 led to c-Jun-N-terminal kinase (JNK) activation, apoptosis, and sensitized HepG2 cells to TNF-α–induced apoptosis, while overexpression of V1 was protective. However, blocking JNK1 or JNK2 activation did not prevent apoptosis induced by V1 knockdown. V1 (but not V2) knockdown also leads to apoptosis in a colon cancer cell line, suggesting these variants play similar roles in many cell types.
Conclusions
Different variants of MAT2β regulate growth and death, which broadens their importance in biology.
Methionine adenosyltransferase (MAT) is a critical cellular enzyme responsible for the synthesis of S-adenosylmethionine using methionine and adenosine triphosphate.1 Its importance is due to the fact that S-adenosylmethionine is the principal biological methyl donor, the precursor of aminopropyl groups used in polyamine biosynthesis, and, in the liver, a precursor of glutathione.1 In mammals, 2 different genes, MAT1A and MAT2A, encode for 2 homologous MAT catalytic subunits, α1 and α2.2 MAT1A is expressed mostly in the liver and it encodes the α1 subunit found in 2 native MAT isozymes, which are either a dimer (MATIII) or tetramer (MATI) of this single subunit.2 MAT2A encodes for a catalytic subunit (α2) found in a native MAT isozyme (MATII), which is widely distributed.1,2 MAT2A also predominates in the fetal liver and is progressively replaced by MAT1A during liver development.3 In adult liver, increased expression of MAT2A is associated with rapid growth or dedifferentiation of the liver.4-6 There is a regulatory subunit (β) that is associated only with MATII.2,7 The β subunit is encoded by the gene MAT2β that is expressed in extrahepatic tissues but not in normal liver.7-9 MAT2β is induced in cirrhosis and in hepatocellular carcinoma (HCC).9 Importantly, both increased MAT2A and MAT2β offer liver cancer cells a growth advantage.9,10
Given the importance of MAT genes, we have been interested in understanding their transcriptional regulation. Both nuclear factor κB (NF-κB) and activator protein 1 (AP-1) are positive regulators of MAT2A gene transcription.11 To better understand transcriptional regulation of MAT2β, we cloned and characterized the 5′-flanking region. During this process, we identified multiple alternate splicing variants of MAT2β not described previously. Here we report the first in-depth analysis of expression patterns of the 2 major MAT2β variants (V1 and V2) in normal human tissues and HCC, their differential regulation by tumor necrosis factor (TNF)-α, and their modulation of TNF-α–mediated apoptosis. All of the published work on MAT2β pertains only to V1.7,9,12 We uncovered the novel finding that in addition to regulating MATII, MAT2β V1 also regulate cell death through modulating c-Jun-N-terminal kinase (JNK) activity.
Materials and Methods
Materials
All reagents were of analytical grade and obtained from commercial sources.
Source of Normal and Cancerous Liver Tissue
Normal and cancerous liver tissues were obtained as described.13 The study protocol conformed to the ethical guidelines of the 1975 Declaration of Helsinki as reflected in a priori approval by the Keck School of Medicine, University of Southern California Human Research Review Committee.
Cell Culture and TNF-α Treatment
HepG2, HuH-7, and RKO cells were grown according to instructions provided by the American Type Culture Collection (Rockville, MD). Before treatment of HepG2 cells with TNF-α, medium was changed to withhold serum overnight. Cells were then treated with TNF-α (25 ng/mL), insulin-like growth factor (IGF)-1 (100 ng/mL), or epidermal growth factor (EGF; 100 ng/ mL) for 15 minutes to 8 hours for various assays described in the following text.
Recombinant Plasmids and Adenoviral Dominant Negative Constructs
pCMV-p50, pCMV-p65, and pRSV-cJun expression plasmids were kindly provided by Dr Richard Rippe (University of North Carolina at Chapel Hill, Chapel Hill, NC). Dominant negative (DN) JNK1 and JNK2 adenoviral vectors were kindly provided by Dr Mark Czaja (Albert Einstein School of Medicine, Bronx, NY).
Cloning of the 5′-Flanking Region of the Human MAT2β Gene
An oligonucleotide probe corresponding to −60 to +3 of the human MAT2β complementary DNA8 (cDNA) was used to screen the human genomic library EMBL 3 (Clontech Laboratories, Inc, Mountain View, CA). Five positive plaques were selected; DNA was isolated and digested with EcoRI. The insert fragment was subcloned into pGL-3 basic vector (Promega, Madison, WI) and sequenced as described.14 A 4.1-kilobase 5′-flanking region of the human MAT2β was cloned into the SmaI site of promoterless pGL-3 basic vector.
Primer Extension Analysis
Primer extension analysis was performed as described.14 Two antisense oligonucleotide primers complementary to −1 to +17 and +4 to +21 nucleotides relative to the translational start site of the human MAT2β Cdna8 were end-labeled with [γ-32P]adenosine triphosphate using T4 polynucleotide kinase. A total of 2.5 μg of poly (A+) RNA from HepG2 cells was annealed to 106 cpm of the primers and extended with 4 U of Vent DNA polymerase (New England Biolabs, Inc, Ipswich, MA).
Construction of 5′-Deletion Constructs of the V1 Promoter
The positive insert fragment in the sense orientation upstream of the luciferase coding sequence of the pGL-3 basic vector was subjected to polymerase chain reaction to generate 5 deletion constructs. Forward primers were from −2073 to −2046, −1319 to −1294, −990 to −967, −713 to −688, and −250 to −225, and reverse primer was +3 to −20 to generate deletion constructs −2073/+3, −1319/+3, −990/+3, −713/+3, and −250/+3 MAT2β-LUC, respectively. All sequences are relative to the ATG start codon.
Isolation of Total RNA and Complementary DNA Synthesis
Total RNA from human tissues and cells was isolated using TRIzol kit (Invitrogen, Carlsbad, CA) according to the manufacturer’s recommendations. First-strand cDNA was synthesized from 250 ng messenger RNA (mRNA) using RACE kit (Ambion, Austin, TX) according to the manufacturer’s recommendations.
Generation of MAT2β Variant Expression Vectors
To express recombinant human MAT2β (either V1 or V2), the full-length cDNA was cloned into the mammalian expression vector pcDNA3.1D/V5-His/TOPO (Invitrogen) using the pcDNA3.1 Directional TOPO Expression kit according to the manufacturer’s instructions. Forward primers (V1, 5′-CACCATGGTGGGGCGGGAG-3′; V2, 5′-CACCATGCCTGAAATGCCAGAG-3′) were designed to incorporate the sequence CACC 5′ to the ATG translation start site. The reverse primer (5′-ATGAAAGACCGTTTGTCTCCATCT -3′) is suitable for amplification of both variants and was designed to begin one codon upstream of the stop codon, effectively eliminating the stop codon from the polymerase chain reaction amplicon, enabling fusion of the MAT2β protein to the viral V5 epitope and His tag at the carboxyl terminus. Clones obtaining the expression plasmid pcDNA3.1D/ V5-His/MAT2βvar1 (V1 expression vector) or pcDNA3.1D/ V5-His/MAT2βvar2 (V2 expression vector) were identified initially by restriction digest analysis to detect orientation and were confirmed to contain the MAT2β cDNA in frame with the V5 and His-tag by sequence analysis using BGH and T7 priming.
To increase variant expression, HuH-7 cells were transfected with V1 or V2 expression vectors for up to 72 hours. Expression of variants was documented by Western blot analysis using anti-V5 antibodies (Santa Cruz Biotechnology, Santa Cruz, CA) and anti-MAT2β antibodies (Novus Biologicals, Inc, Littleton, CO).
MAT2β V1 and V2 Expression in Human Tissues and HCC
RNA (10 μg) from human tissues (total RNA Master Panel II; Clontech Laboratories, Inc) were subjected to Northern blot analysis using specific V1 (−202 to +3) or V2 (−2372 to −2261) and housekeeping β-actin cDNA probes as described.11 Results of Northern blot analysis were normalized to β-actin.
Effects of TNF-α, IGF-1, and EGF on the Expression of MAT2β Variants and V1 Promoter Activity in HepG2 Cells
Effects of TNF-α, IGF-1, and EGF on gene expression in HepG2 cells were examined using Northern blot analysis as described previously.
The effect of TNF-α on MAT2β V1 promoter activity was examined by measuring luciferase activity driven by MAT2β V1 promoter luciferase gene constructs in transfected HepG2 cells treated with TNF-α (25 ng/mL) during the last 8 hours of the transfection. To confirm the role of NF-κB and AP-1 on MAT2β V1 promoter activity, HepG2 cells were cotransfected with expression vectors for p65, p50, or c-Jun for 24 hours before measuring luciferase activity. Controls were transfected with empty vectors for p65, p50, or c-Jun.
V1 and V2 Small Interfering RNA and Transfection
The V1 coding sequence was analyzed for sites of small interfering RNA (siRNA) targeting using siRNA Target Designer (Promega), and 3 potential sequences for each variant were selected (Supplementary Table 1; see supplemental material online at www.gastrojournal.org). HepG2 and RKO cells were grown to 60%–70% confluency before transfection. Lipofectamine 2000 was used as the transfection reagent, and transfections were performed according to the manufacturer’s protocol using Opti-MEM media (Invitrogen Life Sciences). The effect of siRNA on the MAT2β protein level was assessed by Western blot analysis. In some experiments, HepG2 cells treated with siRNA against V1 or scrambled siRNA for 24 hours were treated with adenoviral vectors expressing DNJNK1, DNJNK2, or empty vector alone for another 24 hours. The siRNA transfection efficiency of Lipo-fectamine RNAiMax in HepG2 cells was determined by the BLOCK-iT Alexa Fluor Red Fluorescent Oligo protocol (Invitrogen) and averaged 93.5%.
DNA Synthesis and Apoptosis
DNA synthesis was measured by 3H-thymidine incorporation into DNA as described.10 Apoptosis was measured using DNA fragmentation and Hoechst staining as described.11 Similar results were obtained using the Apo-direct kit (Pharmingen, San Diego, CA), which uses the terminal deoxynucleotidyl transferase–mediated deoxyuridine triphosphate nick-end labeling (TUNEL) assay and flow cytometry as described.15 Hoechst staining and TUNEL yielded comparable results and were pooled for analysis. All of the cells (whether or not they were transfected) were counted.
JNK, Extracellular Signal–Regulated Kinase, and NF-κB Activation
JNK and extracellular signal–regulated kinase (ERK) activation was assessed by Western blot analysis using antibodies that recognize the phosphorylated (activated) versus total JNK and ERK forms as described.16 NF-κB activation was assessed by Western blot analysis using nuclear protein extracts and anti-p50 and anti-p65 antibodies (Santa Cruz Biotechnology). For loading control, actin was used for cytosolic proteins and histone 3 was used for nuclear proteins.
Measurement of Reactive Oxygen Species Production
Measurement of intracellular reactive oxygen species (ROS) production in HepG2 cells treated with TNF-α (25 ng/mL), H2O2 (100 μmol/L) for 30 minutes, or V1 or V2 RNA interference (RNAi) for 24–48 hours was performed as described.17
Statistical Analysis
Data are given as mean ± SEM. Statistical analysis was performed using analysis of variance and Fisher exact test. For mRNA and protein levels, ratios of genes and proteins to respective housekeeping densitometric values were compared. Significance was defined by P < .05.
Results
MAT2β 5′-Flanking Sequence and Multiple Alternative Splicing Variants
The sequence of the 4.0-kilobase product is shown in Figure 1 (GenBank accession no. AY223864). Analysis of the transcription factor binding site was performed using Transcription Factor Search and MatInspector. The 5′-flanking region of the human MAT2β contains multiple consensus binding sites for NF-κB and AP-1. Two transcriptional start sites were identified, as indicated by forward arrows (Figure 1). Multiple alternative splicing variants were identified in both HepG2 cells and HCC (Supplementary Figure 1; see supplemental material online at www.gastrojournal.org). V1 and V2 were reported previously to the GenBank (NM_013283 and NM_182796, respectively), and they differ in the N-terminus by 20 amino acids. V2 uses a different first exon lying 2.29 kilobases upstream of the translational start site of V1 (Figure 2A). V2a is missing the first 51 base pairs of exon 7, while V2b is missing exons 3–6 (Supplementary Figure 1A; see supplemental material online at www.gastrojournal.org). All 4 variants are expressed in both HCC and HepG2 cells, but V2a and V2b are expressed at very low levels as compared with V2 (Supplementary Figure 1B; see supplemental material online at www.gastrojournal.org).
Figure 1.

Nucleotide sequence of the 5′-flanking region of the human MAT2β gene. Sequence is numbered relative to the translational start site. The putative regulatory elements are indicated in bold letters above the underlined sequences. The transcriptional start sites were determined using 5′ RACE as described in Materials and Methods and indicated by the forward arrows. One transcriptional start site is located at −203, while another transcriptional start site is located at −2372. Boxed letters in bold denote the coding region of the V2 variant.
Figure 2.

MAT2β V1 and V2 genomic structure and expression in normal human tissues. (A) Genomic structure and N-terminus amino acid sequences of V1 and V2. (B) Expression patterns of the 2 major variants in different normal human tissues by Northern blot analysis. (C) Expression of MAT genes in normal liver and HCC. Northern blot analysis was performed in 4 normal livers and 4 HCC specimens. Each lane contains 15 μg of total RNA.
Expression of MAT2β Variants in Human Tissues and HCC
The 2 main variants (V1 and V2) are differentially expressed in normal human tissues (Figure 2B). Some tissues express mainly V1 (prostate, brain, lung, thyroid, adrenal gland, fetal liver, and spinal cord), others express mainly V2 (skeletal muscle, testis, and heart), some express both forms (thymus and kidney), and some express almost no MAT2β V1 or V2 (bone marrow, trachea, salivary gland, uterus, adult liver, and placenta). In human HCC, both MAT2β V1 and V2 mRNA levels are increased like MAT2A, while MAT1A is silenced (Figure 2C).
Effect of TNF-α on MAT2β Expression and Promoter Activity
TNF-α is a pleiotropic cytokine that we have previously shown to induce MAT2A expression at the transcriptional level via AP-1 and NF-κB.11 TNF-α also induced MAT2β V1 but had no influence on V2 mRNA level (Figure 3). TNF-α treatment also increased the mRNA levels of p50, p65, c-Fos, and c-Jun in a time-dependent manner (Figure 3). Similar to TNF-α, IGF-1 and EGF also predominantly induced the expression of MAT2β V1 (Supplementary Figure 2; see supplemental material online at www.gastrojournal.org).
Figure 3.

Effect of TNF-α treatment on expression of MAT2β variants, AP-1, and NF-κB family members. (A) HepG2 cells were treated with TNF-α (25 ng/mL) for up to 8 hours and subjected to Northern blot analysis for MAT2β V1, V2, c-Fos, c-Jun, p65, and p50 as described in Materials and Methods. (B) Densitometry was performed and summarized from 3 independent experiments.
Next we investigated whether AP-1 and NF-κB regulate basal MAT2β V1 expression in response to TNF-α treatment. Figure 4A shows that TNF-α maximally induced the promoter construct −713/+3, which contains several AP-1 consensus binding sites (Figure 1). Overexpression of c-Jun also induced MAT2β V1 promoter constructs (Figure 4A) and endogenous V1 (but not V2) expression (Figure 4B). Overexpression of either p50 or p65 induced the MAT2β V1 promoter construct −1319/+3 but not −713/+3 (Figure 4A) and increased mRNA level of V1 but not V2 (Figure 4B). Three consensus NF-κB binding sites are located in the region of −1319 to −990 (Figure 1). There is cross-talk between NF-κB and AP-1 as overexpression of c-Jun increased p65 (but not p50) mRNA levels and overexpression of either p65 or p50 increased both c-Jun and c-Fos mRNA levels (Figure 4B). We next examined whether TNF-α treatment led to an increase in NF-κB and AP-1 binding to the MAT2β V1 promoter in the endogenous chromatin configuration using the chromatin immunoprecipitation assay (Supplementary Figure 3; see supplemental material online at www.gastrojournal.org). As expected, nuclear binding to the NF-κB (p65 and p50) and AP-1 sites (c-Jun, Jun D, and c-Fos) increased following TNF-α treatment.
Figure 4.

(A) Effect of TNF-α treatment, c-Jun, or NF-κB overexpression on luciferase activity driven by the human MAT2β V1 promoter. HepG2 cells were transfected transiently with MAT2β V1 promoter constructs or pGL-3 basic vector alone and treated with TNF-α (25 ng/mL) or vehicle control as described in Materials and Methods. To study the role of NF-κB and AP-1 on MAT2β V1 promoter activity, HepG2 cells were cotransfected with expression vectors for p65, p50, or c-Jun for 24 hours before measuring luciferase activity. Controls were transfected with empty vectors for p65, p50, or c-Jun. Results represent mean ± SEM from 4 independent experiments performed in triplicate. Data are expressed as relative luciferase activity to that of pGL-3 basic vector control, which is assigned a value of 1.0. *P < .05 vs respective control. (B) Effect of c-Jun, p65, or p50 overexpression on mRNA levels of MAT2β variants AP-1 and NF-κB determined by Northern blot analysis. Numbers below the blots are densitometric measurements as percent of time 0 control after normalization to β-actin.
Influence of MAT2β Variants on Cell Growth
To address the influence of MAT2β on cell growth, V1 and V2 expression was reduced by RNAi in HepG2 cells and increased by overexpression vectors in HuH-7 cells, which express minimal MAT2β.9 RNAi treatment typically reduced V1 and V2 mRNA levels to 24% and 20% of control, respectively (Figure 5A, top). Each RNAi is specific and had no influence on the expression of the other variant; scrambled RNAi had no influence on the expression of either variant (not shown). Western blot analysis shows that HepG2 cells express more V1, because more MAT2β protein remained after V2 RNAi treatment (Figure 5A, bottom). HuH-7 cells express very little MAT2β and overexpression with either V1 or V2 increased MAT2β by 800% and 500%, respectively (Figure 5B). Reduced expression of either V1 or V2 reduced DNA synthesis in HepG2 cells (Figure 5C), while overexpression increased DNA synthesis in HuH-7 cells, with V1 exerting a stronger influence than V2 (Figure 5D).
Figure 5.

Effect of V1 and V2 expression on cell growth. (A) HepG2 cells were treated with RNAi against V1, V2, or scrambled control for 48 hours, and Northern blot analysis of V1 and V2 (top part) and Western blot analysis for MAT2β (bottom part) were performed. Numbers below are densitometric values as percent of scrambled (SC). (B) HuH-7 cells were transfected with V1 or V2 expression vectors for 48 hours and subjected to Western blot analysis for V5 tag and MAT2β. (C) DNA synthesis was determined by 3H-thymidine incorporation into DNA in HepG2 cells after RNAi treatment. (D) DNA synthesis was measured in HuH-7 cells overexpressing V1 or V2. Results are mean ± SE from 3 independent experiments performed in triplicate. *P < .05 vs control.
MAT2β V1 Modulates Apoptosis at Baseline and in Response to TNF-α Treatment
TNF-α is known to induce apoptosis by a JNK-mediated mechanism.18,19 In normal hepatocytes, TNF-α has no cytotoxic effect unless NF-κB induction is blocked.19 NF-κB is believed to induce expression of protective genes against apoptosis. This prompted us to examine whether MAT2β V1 may be one of these protective genes. Figure 6A shows that knockdown of V1 to 24% of control level induced apoptosis by itself. TNF-α treatment for 24 hours also induced apoptosis in HepG2 cells. However, cells pretreated with V1 RNAi (but not V2 RNAi) were sensitized to TNF-α–induced apoptosis. Figure 6B shows that the opposite occurs, namely, HepG2 cells overexpressing V1 (but not V2) were protected from TNF-α–induced apoptosis.
Figure 6.
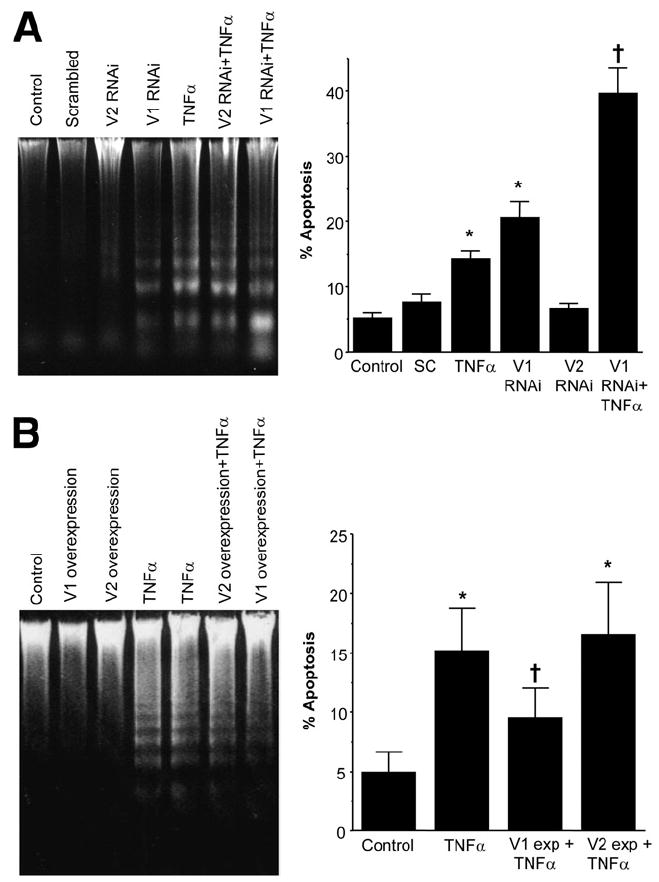
Influence of V1 and V2 expression on TNF-α–induced apoptosis in HepG2 cells. (A) HepG2 cells were treated with V1, V2, or scrambled (SC) RNAi for 48 hours and, in some instances, TNF-α (25 ng/mL) was added during the last 24 hours. Apoptosis was assessed by DNA fragmentation (left panel) as well as Hoechst staining and TUNEL (right panel) as described in Materials and Methods. (B) HepG2 cells were transfected with V1 or V2 expression vectors for 72 hours and, in some instances, TNF-α (25 ng/mL) was added during the last 24 hours. Apoptosis was assessed as previously described. *P < .05 vs control, †P < .05 vs control and TNF-α.
Sustained JNK activation is believed to be the cause of TNF-α–induced apoptosis in many cell types, although there is controversy with regard to whether it is JNK1 or JNK2 that plays the dominant role.20,21 We next investigated the effect of MAT2β V1 knockdown on JNK activation and signaling. Figure 7A shows that knockdown of MAT2β V1 (but not V2) and TNF-α both increased JNK activation (both JNK forms), but the magnitude of activation was higher with combined V1 knockdown and TNF-α treatment. One of the downstream targets of JNK1 is c-Jun, and c-Jun phosphorylation increased in parallel with changes in JNK1 phosphorylation (not shown).
Figure 7.

Influence of V1 and V2 expression on TNF-α–induced JNK and NF-κB activation. (A) HepG2 cells were treated with V1, V2, or scrambled RNAi for 48 hours and, in some instances, TNF-α (25 ng/mL) was added during the last 24 hours. JNK activation was measured by Western blot analysis of phospho-JNK forms normalized to total JNK. The table on the right summarizes densitometric values from 3 independent experiments expressed as percent of control in mean ± SE. (B) HepG2 cells were treated with V1 RNAi or scrambled RNAi for 24 hours, at which time TNF-α (25 ng/mL) was added for up to another 18 hours. NF-κB activation was measured by Western blot analysis of nuclear p50 and p65 levels normalized to histone 3. Densitometric values are shown in C.
A key inducer of JNK activation is ROS.18,19 We next measured ROS generation in cells treated with V1 or V2 RNAi for 48 hours or TNF-α (25 ng/mL) or H2O2 (100 μmol/L) for 30 minutes. Cells treated with TNF-α or H2O2 had higher ROS generation (200% of untreated control), but V1 or V2 RNAi had no influence on the level of ROS (data not shown). Another regulator of JNK activity is NF-κB, which has been shown to inhibit JNK activation.18,19 To see if reduced V1 expression might block NF-κB activation by TNF-α, we measured nuclear levels of p50 and p65. Figure 7B and C shows that V1 RNAi did not interfere with the ability of TNF-α to induce NF-κB. V1 (but not V2) RNAi treatment alone actually resulted in transient NF-κB activation (not shown).
To further show a role of V1 in JNK activation, HuH-7 cells were transfected with V1 expression vector for up to 72 hours. Figure 8A shows that JNK activation as indicated by phosphorylated JNK forms decreased in a time-dependent fashion to 73% (p-JNK1) and 85% (p-JNK2) of baseline at 36 hours and to 24% (p-JNK1) and 38% (p-JNK2) of baseline at 72 hours. Interestingly, ERK activation increased (maximum was 800% for ERK1 and 250% for ERK2) as V1 was overexpressed.
Figure 8.

V1 regulates JNK and ERK but JNK is not responsible for V1 knockdown-induced apoptosis. (A) HuH-7 cells were transfected with V1 expression vector for up to 72 hours and subjected to Western blot analysis for activated (phosphorylated) JNK, ERK and total JNK1, JNK2, ERK2, and MAT2β as described in Materials and Methods. (B) HepG2 cells were treated with DNJNK1 or DNJNK2 for up to 24 hours and subjected to Western blot analysis as previously described. (C) HepG2 cells were treated with V1 or scrambled (SC) RNAi for 24 hours, followed by treatment with adenoviral vectors expressing DNJNK1, DNJNK2, or empty vector for another 24 hours. Apoptosis was determined as described in Materials and Methods. Results are mean ± SE from 3 experiments. *P < .001 vs SC RNAi + empty vector, †P < .01 vs respective DNJNK and V1 RNAi + empty vector, **P < .05 vs SC RNAi + empty vector.
To see if JNK activation played a role in apoptosis as V1 expression was reduced, HepG2 cells were first treated with siRNA against V1 or scrambled siRNA and 24 hours later treated with adenoviral vectors that are empty or expressing DNJNK1 or DNJNK2. Figure 8B shows that 24 hours after treatment with DNJNK1 or DNJNK2, activated JNK1 and JNK2 decreased to 28% and 23% of baseline, respectively. Blocking either JNK1 or JNK2 activation significantly reduced apoptosis as a result of V1 knockdown; however, the magnitude of increase in apoptosis remained unchanged because cells treated with DNJNK had lower rates of apoptosis (Figure 8C).
MAT2β V1 Also Regulates Apoptosis in Colon Cancer Cell Line RKO
To see if MAT2β variants play similar functions in a non–liver cell type, we examined the effect of V1 or V2 knockdown on apoptosis in a colon cancer cell line RKO. Supplementary Figure 4 (see supplemental material online at www.gastrojournal.org) shows that knockdown of V1 (but not V2) also induced apoptosis in RKO cells.
Discussion
The MAT gene is one of 482 genes absolutely required for survival of an organism because it catalyzes the only reaction that generates S-adenosylmethionine.1 In mammals, MAT1A and MAT2A are homologous genes that encode for 2 catalytic subunits while MAT2β encodes for the β regulatory subunit.1 It should be emphasized that studies that examined the functional role of the β subunit pertain only to MAT2β V1. This variant has been shown to lower the Km and Ki of MATII for methionine and S-adenosylmethionine, respectively.7 Dysregulation of MAT1A and MAT2A contributes to liver disease and malignant degeneration.1 While many studies have examined transcriptional regulation of MAT1A and MAT2A, transcriptional regulation of MAT2β is largely unknown. Our original goal was to study transcriptional regulation of MAT2β, but in the course of these studies, we have uncovered many novel aspects of MAT2β.
We realized the existence of multiple MAT2β variants when we cloned its 4.1-kilobase 5′-flanking region. Two major splicing variants (V1 and V2) are expressed; in addition, 2 other variants (V2a and V2b) are also expressed in HCC and HepG2 cells but at very low levels. The 2 major variants V1 and V2 differ only at their 5′ end by 20 amino acids. The alternatively spliced V2 uses a different first exon lying further upstream in the genomic sequence. Regulation of the V1 promoter (1.2 kilobase 5′-flanking) has been described.12 A critical Sp1 site at +9 was important for basal promoter activity in Cos-1 and Jurkat cells. Our results on V1 basal promoter activity in HepG2 cells agree in general with the work of LeGros et al.12 While the gene that encodes for the catalytic subunit of MAT is essential to life, MAT2β appears dispensable. Indeed, some tissues express very low to absent levels of either V1 or V2. Most tissues that express MAT2β express mostly V1, but there are some tissues that express more V2 than V1 (ie, heart, testis, and skeletal muscle). In human liver, β subunit expression is increased in cirrhosis and HCC.9 Consistently, we found that both variants are largely absent in the adult liver but V1 is expressed in fetal liver. Furthermore, both variants are highly induced in HCC. Increased expression of MAT2β V1 provides a proliferative advantage in human hepatoma cell lines.9 We confirmed the importance of V1 in regulating growth of liver cancer cell lines HepG2 and HuH-7. In addition, we found that V2 also plays a similar role in regulating growth as overexpression increased growth while reduced expression suppressed growth.
Because MAT2A and MAT2β are both up-regulated in HCC, we speculated that their regulation might be coordinated. This prompted us to examine the effect of TNF-α because we showed it induced the expression of MAT2A.11 We found that TNF-α selectively induced only MAT2β V1, and this occurred at the transcriptional level. TNF-α treatment also induced the expression of both AP-1 and NF-κB family members. Several consensus AP-1 and NF-κB binding sites are present in the V1 promoter, and overexpression of c-Jun, p50, or p65 increased the V1 promoter activity, supporting them as positive regulators of this gene. Potential AP-1 sites that may act as enhancer elements are at −266, −347, and −454, while potential NF-κB enhancer elements are located at −1048, −1140, and −1153. Additional work involving site-directed mutagenesis will be required to identify the critical site(s). The molecular mechanisms of MAT2β V2 up-regulation in HCC will require further study.
TNF-α is a pleiotropic cytokine that induces cellular response such as proliferation and cell death.19 TNF-α has been implicated in the pathophysiology of liver injury due to viral hepatitis, alcohol, nonalcoholic steatohepatitis, and ischemia-reperfusion.19 Hepatocytes are normally resistant to TNF-α cytotoxicity but undergo cell death in the setting of transcriptional or translational arrest or inactivation of NF-κB.19,22 Thus, NF-κB activation is believed to turn on several antiapoptotic proteins to resist TNF-α toxicity. Recent studies have identified sustained JNK activation as the key mechanism for TNF-α–induced apoptosis, which is prevented by NF-κB.18,19,22 JNK exists in 2 isoforms, JNK1 and JNK2, in most cell types. Jnk1 and jnk2 null mice are viable but double knockout is embryonically lethal, suggesting JNK1 and JNK2 have redundant functions.21 However, JNK1 and JNK2 play distinct roles in the response to TNF-α, with JNK1 mediating the majority of c-Jun phosphorylation whereas JNK2 lacks this kinase activity and actually can decrease c-Jun stability when it binds to c-Jun.19,23 There are conflicting reports on the role of the 2 JNK forms in mediating the proapoptotic effects of TNF-α, with JNK1 being responsible in fibroblasts21 but JNK2 being responsible in galactosamine/lipopolysaccharide-induced liver injury in vivo.22 Adding to this controversy is the report that both JNK1 and JNK2 deficiency block concanavalin A–induced liver injury in vivo.24 These findings suggest that the role of the JNK isoform in apoptosis is complex and depends on cell type and nature of the death stimulus.
Because TNF-α selectively up-regulated MAT2β V1, we speculated on whether this variant might be involved in protection against apoptosis. Indeed, reduced V1 but not V2 expression in HepG2 cells by RNAi resulted in apoptosis and sensitized cells to TNF-α–induced apoptosis, while overexpression of V1 but not V2 protected cells from TNF-α–induced apoptosis. We next investigated how V1 modulates the sensitivity to TNF-α–induced apoptosis by examining the effect of V1 expression on key regulators of TNF-α–induced apoptosis, namely JNK and NF-κB activation. JNK1 and JNK2 were activated as indicated by phosphorylation after TNF-α treatment as well as when V1 expression was reduced. Combined treatment of V1 RNAi and TNF-α had an additive effect on JNK1/JNK2 activation, suggesting distinct mechanisms are involved in their activation. Interestingly, reduced V1 expression (but not V2) by itself led to transient NF-κB activation and did not impair the ability of TNF-α to induce NF-κB. Thus, increased JNK activation is not due to impairment in NF-κB activation. A major determinant of JNK activation is intracellular levels of ROS.18,19 However, reduced V1 expression did not result in higher ROS generation. V1 also regulates apoptosis in a colon cancer cell line, which suggests our findings are not restricted to only liver cancer cells. While V1 may modulate TNF-α–induced apoptosis via JNK, JNK activation is not the mechanism for apoptosis when V1 expression is reduced. How V1 regulates JNK activation and how its knockdown leads to apoptosis remain unknown and will require further study.
Overexpression of V1 had opposite effects on JNK and ERK signaling cascade. While JNK activation was suppressed, ERK activation was enhanced. The molecular mechanism remains to be elucidated, but the positive effect V1 exerts on the ERK signaling pathway is likely to contribute to growth stimulation.
In summary, we have identified multiple splicing variants of MAT2β and characterized the 2 major variants. These variants are differentially expressed in normal human tissues. Both variants are markedly up-regulated in HCC and may offer a growth advantage in liver cancer cells. V1 but not V2 also regulates apoptosis in both liver and colon cancer cells. TNF-α selectively induced the expression of only V1, which acts as another NF-κB–dependent survival gene. The molecular mechanism involves modulation of JNK activity by V1. V1 expression also positively regulates ERK activation. These are aspects of V1 previously unrecognized and that greatly broaden the importance of this gene.
Supplementary Material
Note: To access the supplementary material accompanying this article, visit the online version of Gastroenterology at www.gastrojournal.org, and at doi: 10.1053/j.gastro.2007.10.027.
Acknowledgments
Supported by National Institutes of Health grants DK51719 (to S.C.L.), AA12677, AA13847, and AT1576 (to S.C.L. and J.M.M.) and Plan Nacional of I+D SAF 2005-00855, as well as HEPADIP-EULSHM-CT-205 (to J.M.M.). HepG2, HuH-7, and RKO cells were provided by the Cell Culture Core, and the confocal microscope was provided by the Cell Biology Core of the USC Research Center for Liver Diseases (DK48522). K.R. is a recipient of a postdoctoral fellowship of the Training Program in Alcoholic Liver and Pancreatic Diseases (T32 AA07578), and A.I.A. is a recipient of a postdoctoral fellowship supported by the CIC bioGUNE, Centro de Investigación Cooperativa en Biosciencías.
Abbreviations used in this paper
- AP-1
activator protein 1
- DN
dominant negative
- EGF
epidermal growth factor
- ERK
extracellular signal–regulated kinase
- IGF
insulin-like growth factor
- JNK
c-Jun-N-terminal kinase
- MAT
methionine adenosyltransferase
- NF-κB
nuclear factor κB
- RNAi
RNA interference
- ROS
reactive oxygen species
- siRNA
small interfering RNA
- TNF
tumor necrosis factor
- TUNEL
terminal deoxynucleotidyl transferase–mediated deoxyuridine triphosphate nick-end labeling
Footnotes
None of the authors have a conflict of interest to declare.
References
- 1.Mato JM, Corrales FJ, Lu SC, et al. S-Adenosylmethionine: a control switch that regulates liver function. FASEB J. 2002;16:15–26. doi: 10.1096/fj.01-0401rev. [DOI] [PubMed] [Google Scholar]
- 2.Kotb M, Mudd SH, Mato JM, et al. Consensus nomenclature for the mammalian methionine adenosyltransferase genes and gene products. Trends Genet. 1997;13:51–52. doi: 10.1016/s0168-9525(97)01013-5. [DOI] [PubMed] [Google Scholar]
- 3.Gil B, Casado M, Pajares M, et al. Differential expression pattern of S-adenosylmethionine synthetase isoenzymes during rat liver development. Hepatology. 1996;24:876–881. doi: 10.1002/hep.510240420. [DOI] [PubMed] [Google Scholar]
- 4.Cai J, Sun WM, Hwang JJ, et al. Changes in S-adenosylmethionine synthetase in human liver cancer: molecular characterization and significance. Hepatology. 1996;24:1090–1097. doi: 10.1002/hep.510240519. [DOI] [PubMed] [Google Scholar]
- 5.Huang ZZ, Mao Z, Cai J, et al. Changes in methionine adenosyltransferase during liver regeneration in the rat. Am J Physiol. 1998;275:G14–G21. doi: 10.1152/ajpgi.1998.275.1.G14. [DOI] [PubMed] [Google Scholar]
- 6.Huang ZZ, Mato JM, Kanel G, et al. Differential effect of thioacetamide on hepatic methionine adenosyltransferase expression in the rat. Hepatology. 1999;29:1471–1478. doi: 10.1002/hep.510290525. [DOI] [PubMed] [Google Scholar]
- 7.Halim A, LeGros L, Geller A, et al. Expression and functional interaction of the catalytic and regulatory subunits of human methionine adenosyltransferase in mammalian cells. J Biol Chem. 1999;274:29720–29725. doi: 10.1074/jbc.274.42.29720. [DOI] [PubMed] [Google Scholar]
- 8.LeGros HL, Jr, Halim AB, Geller AM, et al. Cloning, expression, and functional characterization of the β regulatory subunit of human methionine adenosyltransferase (MAT II) J Biol Chem. 2000;275:2359–2366. doi: 10.1074/jbc.275.4.2359. [DOI] [PubMed] [Google Scholar]
- 9.Martinez-Chantar ML, Garcia-Trevijano ER, Latasa MU, et al. Methionine adenosyltransferase II β subunit gene expression provides a proliferative advantage in human hepatoma. Gastroenterology. 2003;124:940–948. doi: 10.1053/gast.2003.50151. [DOI] [PubMed] [Google Scholar]
- 10.Cai J, Mao M, Hwang JJ, et al. Differential expression of methionine adenosyltransferase genes influences the rate of growth of human hepatocellular carcinoma cells. Cancer Res. 1998;58:1444–1450. [PubMed] [Google Scholar]
- 11.Yang HP, Sadda MR, Yu V, et al. Induction of human methionine adenosyltransferase 2A expression by tumor necrosis factor α: role of NF-κB and AP-1. J Biol Chem. 2003;278:50887–50896. doi: 10.1074/jbc.M307600200. [DOI] [PubMed] [Google Scholar]
- 12.LeGros L, Halim AB, Chamberlin ME, et al. Regulation of the human MAT2β gene encoding the regulatory β subunit of methionine adenosyltransferase MAT II. J Biol Chem. 2001;276:24918–24924. doi: 10.1074/jbc.M102816200. [DOI] [PubMed] [Google Scholar]
- 13.Yang HP, Huang ZZ, Zeng ZH, et al. The role of c-Myb and Sp1 in the up-regulation of methionine adenosyltransferase 2A gene expression in human hepatocellular carcinoma. FASEB J. 2001;15:1507–1516. doi: 10.1096/fj.01-0040com. [DOI] [PubMed] [Google Scholar]
- 14.Yang HP, Huang ZZ, Wang JH, et al. Cloning and characterization of the 5′-flanking region of the rat glutamate-cysteine ligase catalytic subunit. Biochem J. 2001;357:447–455. doi: 10.1042/0264-6021:3570447. [DOI] [PMC free article] [PubMed] [Google Scholar]
- 15.Delatte SJ, Hazen-Martin DJ, Re GG, et al. Restoration of p53 function in anaplastic Wilms’ tumor. J Pediatr Surg. 2001;36:43–50. doi: 10.1053/jpsu.2001.20002. [DOI] [PubMed] [Google Scholar]
- 16.Chen L, Zeng Y, Yang HP, et al. Impaired liver regeneration in mice lacking methionine adenosyltransferase 1A. FASEB J. 2004;18:914–916. doi: 10.1096/fj.03-1204fje. [DOI] [PubMed] [Google Scholar]
- 17.Balcerczyk A, Soszynski M, Rybaczek D, et al. Induction of apoptosis and modulation of production of reactive oxygen species in human endothelial cells by diphenyleneiodonium. Biochem Pharmacol. 2005;69:1263–1273. doi: 10.1016/j.bcp.2005.01.010. [DOI] [PubMed] [Google Scholar]
- 18.Papa S, Zazzeroni F, Pham CG, et al. Linking JNK signaling to NF-κB: a key to survival. J Cell Sci. 2004;117:5197–5208. doi: 10.1242/jcs.01483. [DOI] [PubMed] [Google Scholar]
- 19.Schwabe RF, Brenner DA. Mechanisms of liver injury. I. TNF-α-induced liver injury: role of IKK, JNK, and ROS pathways. Am J Physiol. 2006;290:G583–G589. doi: 10.1152/ajpgi.00422.2005. [DOI] [PubMed] [Google Scholar]
- 20.Liu J, Minemoto Y, Lin A. c-Jun N-Terminal Protein Kinase 1 (JNK1), but not JNK2, is essential for tumor necrosis factor alpha-induced c-Jun kinase activation and apoptosis. Mol Cell Biol. 2004;24:10844–10856. doi: 10.1128/MCB.24.24.10844-10856.2004. [DOI] [PMC free article] [PubMed] [Google Scholar]
- 21.Wang Y, Singh R, Lefkowitch JH, et al. Tumor necrosis factor-induced toxic liver injury results from JNK2-dependent activation of caspase-8 and the mitochondrial death pathway. J Biol Chem. 2006;281:15258–15267. doi: 10.1074/jbc.M512953200. [DOI] [PMC free article] [PubMed] [Google Scholar]
- 22.Liu H, Lo CR, Czaja MJ. NF-κB inhibition sensitizes hepatocytes to TNF-induced apoptosis through a sustained activation of JNK and c-Jun. Hepatology. 2002;35:772–778. doi: 10.1053/jhep.2002.32534. [DOI] [PubMed] [Google Scholar]
- 23.Sabapathy K, Hochedlinger K, Nam SY, et al. Distinct roles for JNK1 and JNK2 in regulating JNK activity and c-Jun-dependent cell proliferation. Mol Cell. 2004;15:713–725. doi: 10.1016/j.molcel.2004.08.028. [DOI] [PubMed] [Google Scholar]
- 24.Maeda S, Chang L, Li ZW, et al. IKKβ is required for prevention of apoptosis mediated by cell-bound but not by circulating TNFα. Immunity. 2003;19:725–737. doi: 10.1016/s1074-7613(03)00301-7. [DOI] [PubMed] [Google Scholar]
- 25.Yang HP, Magilnick N, Kalmaz D, et al. Nrf1 and Nrf2 regulate rat glutamate-cysteine ligase catalytic subunit transcription indirectly via NF-κB and AP-1. Mol Cell Biol. 2005;25:5933–5946. doi: 10.1128/MCB.25.14.5933-5946.2005. [DOI] [PMC free article] [PubMed] [Google Scholar]
Associated Data
This section collects any data citations, data availability statements, or supplementary materials included in this article.
Supplementary Materials
Note: To access the supplementary material accompanying this article, visit the online version of Gastroenterology at www.gastrojournal.org, and at doi: 10.1053/j.gastro.2007.10.027.