

Abstract
Group B streptococci (GBS) is a leading cause of sepsis and meningitis in neonates and immunocompromised adults in western countries. GBS do not bind to fibronectin (Fn) in solution, but will bind to Fn adsorbed onto a solid surface. The reason for the specificity of this binding is unknown. Single molecule force spectroscopy was used to test the hypothesis that GBS, through streptococcal C5a peptidase (ScpB) molecules present on the surface of the bacteria, binds to a motif created by the juxtaposition of multiple adjacent Fn molecules. Atomic force microscopy (AFM) topographical images of adsorbed Fn deposited from various Fn coating concentrations were used to determine the Fn surface concentration. ScpB was tethered to an AFM tip with all surface modifications characterized by X-ray photoelectron spectroscopy and time-of-flight secondary ion mass spectrometry. At the lowest Fn coverages the probability of observing a ScpB–Fn binding event increased linearly with Fn surface coverage. As an Fn monolayer was reached the probability of a ScpB–Fn binding event occurring increased markedly (~50 fold), with a concomitant increase in the rupture force from 17 pN to 33 pN. These results are consistent with the hypothesis that ScpB binds to a motif created by the juxtaposition of multiple Fn molecules.
Keywords: Single molecule force spectroscopy, Fibronectin, Streptococcal c5a peptidase, Poly(ethylene glycol)
1. Introduction
Group B streptococci (GBS or Streptococcus aglactae) are a leading cause of bacterial infections among newborns and immunocompromised adults in industrialized countries [1,2]. Early-onset GBS (infants < 7 days old) accounts for 80% of the occurrence in newborns, and late-onset GBS is characterized by infection at 8 days to 3 months [3,4]. Clinical features of GBS in infants include sepsis, meningitis, and pneumonia. While GBS is less common in adults, skin and soft tissue infection are the most common manifestations of the disease. Common to both infants and adults is the occurrence of sight or hearing loss, cerebral palsy, and death [2,3,5–7]. Interactions of GBS with biomaterials include infections of ventriculoperitoneal shunts [8], prosthetic heart valves [9], IV catheters [6], and artificial bone joints [7].
Absorbed fibronectin (Fn) is targeted by bacteria as an anchoring point for adhesion and invasion of epithelial cells [3,10–12]. Hydrogen bonding [13], electrostatic interactions [14], specific interactions between surface proteins and extracellular matrix proteins [11,15,16], and shear forces [17] all have been shown to mediate bacterial adhesion. GBS will only adhere to adsorbed Fn, not soluble Fn1, 18, 19; this behavior helps GBS evade the host immune system since soluble Fn acts as an opsonin [20]. The mechanism for specific binding of GBS to immobilized Fn is unknown, but one hypothesis is that the adsorbed Fn undergoes conformational changes to reveal cryptic binding sites [19]. Another hypothesis is that GBS binds to a cluster of adsorbed Fn molecules.
The serine protease C5a peptidase (ScpB), which is present on the surface of GBS, has been identified as an Fn adhesion [21]. ScpB has been proposed to interact with adsorbed Fn through two binding sites [22]. One binding site has a high affinity of 4 nM and is expected to be biologically significant. The other binding site has a low affinity in the mM range and is unlikely to be of biological significance. Recent studies have shown that Scp does not bind Fn in solution [19], suggesting a conformation change in Fn induced by a surface is necessary for binding. Soluble Fn is a large dimeric glycoprotein with a radius of approximately 20 nm, while adsorbed Fn can take on a number of different conformations ranging from globular to elongated and cross-linked [23–25]. The binding sites on Fn are distributed along the length of the molecule. The common anchoring point for various bacterial adhesins and the collagen receptor are located towards the N terminus of the molecule [26].
In this study, we explore the possibility that GBS binds specifically to adsorbed Fn because ScpB binds to a binding site created by the juxtaposition of multiple Fn molecules that is not present on Fn monomers. Atomic force microscopy (AFM) single-molecule force spectroscopy with a ScpB modified tip is used to address this question by measuring the binding force between ScpB and adsorbed Fn as a function of Fn surface concentration. Fn surface coverages from single molecules to a monolayer were investigated. X-ray photoelectron spectroscopy (XPS) and time-of-flight secondary ion mass spectrometry (ToF–SIMS) were used to characterize the AFM tip modification process.
2. Experimental
Atomic force microscopy
The AFM used in this study is a Molecular Imaging PicoScan (Pheonix, AZ). Protein imaging was performed using the magnetic AC (MAC) mode or the Acoustic AC mode (AAC). Imaging in air and liquid was carried out with Molecular Imaging type II MAC tips (MAC) or MikroMacsh (Wilsonville, OR) NSC35 ALBS tips (AAC). Force experiments were carried out with NP–S tips (Veeco, Santa Barbara, CA) with spring constants in the range 0.06 – 0.52 N m−1. Spring constants were measured by the thermal noise method [27]. Force curves were carried out at a rate of 1 Hz with a force trigger of 0.25 V and a total travel distance of 1 µm. For each experiment between 500 and 5000 force curves were acquired. The tip location was controlled by a script written to raster the tip over the sample area. All forces curves were taken under 1 × phosphate buffered saline solution (PBS, EMD Chemicals, Gibbstown, NJ) at a pH of 7.4.
Force curve analysis
Jump heights were extracted from the force curves by filtering them to exaggerate vertical segments with a filter proposed by Kasas {−2, −5, v8, −10, 0, 5, 20}28. Once the peaks were found, 11 points to the left and right of the peak were fit with a second degree polynomial. The difference between the endpoints of the polynomials was taken as the jump height. This method was proposed by Baumgartner et. al. [29]. This analysis routine was written in Java as a plugin for ImageJ. Force distributions were calculated as empirical probability distributions as outlined in Ref. [29]. This method of calculating the force distribution is preferred over the histogram method because there is no need to bin the data. The functional form of the distribution given M observations is
where hi is the binding force and σi is the standard deviation of the binding force. Averages (μ) were calculated from this distribution as μ= ∑ihip where pi is the probability of the observation. Since the force distributions are broad, no estimate of the variance was calculated.
X-ray photoelectron spectroscopy
The XPS measurements were performed on a Surface Science Instrument S-probe spectrometer (Mountain View, CA) equipped with monochromatic Al Kα source (KE = 1486.6 eV), hemispherical analyzer, and multichannel detector. The binding energy (BE) scale was referenced by setting the hydrocarbon C1s BE to 285.0 eV. Elemental compositions were determined from spectra acquired at an analyzer pass energy of 150 eV. High-resolution spectra were obtained using an analyzer pass energy of 50 eV. Further details of the XPS experiments are published elsewhere [30].
Time-of-flight secondary ion mass spectrometry
A model 7200 Physical Electronics instrument (PHI, Eden Prairie, MN) was used for ToF–SIMS data acquisition. The instrument has an 8 KeV Cs+ ion source, a reflectron time-of-flight mass analyzer, chevron-type multichannel plates (MCP), and a time-to-digital converter. Data were acquired over a mass range from m/z = 0 to 500 for both positive and negative secondary ions. The area of analysis for each spectrum was 100 µm × 100 µm. The total ion dose used to acquire each spectrum was less than 2 × 10¹² ions cm−2. At least six spots on three samples were analyzed for each step in the modification process. Further details of the ToF-SIMS experimental conditions used in this study are published elsewhere [31].
Protein adsorption
Human plasma fibronectin (Invitrogen, Grand Island, NY) was adsorbed onto freshly cleaved mica (Ted Pella, Redding, CA) from solution concentrations ranging from 1 µg ml−1 to 100 µg ml−1 in PBS. Before adsorption the solution was passed through a 0.2 µm filter to remove Fn aggregates from the solution. Adsorption time was varied between 1 and 10 minutes, depending on the surface coverage desired. After the desired adsorption time was reached, the liquid cell was rinsed with twenty times its volume of PBS to remove the protein solution. For samples imaged in air, a dilution displacement technique was used to extract the substrate and then it was immediately dried in a stream of nitrogen (AirGas, Radnor, PA). All force spectroscopy experiments on adsorbed Fn were carried out under PBS in the AFM liquid cell.
Functionalization of AFM probes and silicon nitride chips
Silicon nitride was deposited onto silicon wafers as described previously31. Cleaned silicon nitride blanks (1 cm × 1 cm) were treated in parallel with NP–S AFM tips. Both the blanks and the NP–S tips were cleaned with piranha solution, 70/30 H2SO4 (EMD San Diego, CA)/H2O2 (J. T. Baker Phillipsburg NJ), (caution: piranha solution reacts violently with organics) for 3 h. After this cleaning, the tips and blanks were rinsed with copious amounts of 18 MΩ water, then initially dried in a stream of nitrogen before finally being baked dry on a hot plate immediately before functionalization.
The procedure of Hinterdorfer et al. [32] was used to functionalize the AFM tips. First, ethanolamine HCl (Sigma, Milwaukee, WI) was dissolved in DMSO (J.T. Baker Phillipsburg, NJ) and reacted with the AFM tips and blanks to generate a low-density (i.e., widely spaced) surface coverage of amine groups. Next, the substrates were incubated for four hours in a solution of 1 mg ml−1 of either pyridyldithio poly(ethylene glycol) succinimidylpropionate (NHS–PEG–PDP) (Polypure, Oslo, Norway) or succinimidylpropionate methoxy poly(ethylene glycol) (mPEG) in chloroform with 1% (v/v) triethylamine (Sigma, Milwaukee, WI) as a catalyst. This step binds the NHS group of the PEG chain to the primary amines on the surface. Further details of this functionalization procedure have been described in Refs [31] and [32].
Preparation and purification of ScpB
ScpB was purified as a glutathione S-tranferase (GST) fusion protein as described by Tamura et. al. [22].
3. Results and discussion
The high spatial resolution and the force sensitivity of the AFM make it an ideal tool to study the interactions of biological molecules. Tethering ScpB to the AFM tip with a flexible cross-linker and using it to probe Fn in the adsorbed at systemically varied surface concentrations allows one to measure the force interaction between the two molecules and simultaneously quantify both the frequency and the strength of these interactions.
Fn concentration effect on surface coverage
Adsorption of Fn onto mica was controlled by keeping the adsorption time constant and varying the solution concentration. Fig. 1 shows AFM images of Fn adsorbed onto mica from different solution concentrations and imaged in PBS. Obtaining molecular resolution in a liquid is more difficult than air due to dampening of the cantilever oscillations by the liquid. As the Fn solution concentration is increased the amount of Fn on the surface increases. There are relatively few adjacent Fn molecules below 10 µg ml−1. At 10 µg ml−1, Fn clusters are observed. An Fn monolayer is formed at 20 µg ml−1. From thresholding the AFM images [31], the Fn surface coverage from 1, 5, 10 and 20 µg ml−1 solutions was determined to be 8, 20, 54 and 100% of a monolayer, respectively.
Figure 1.
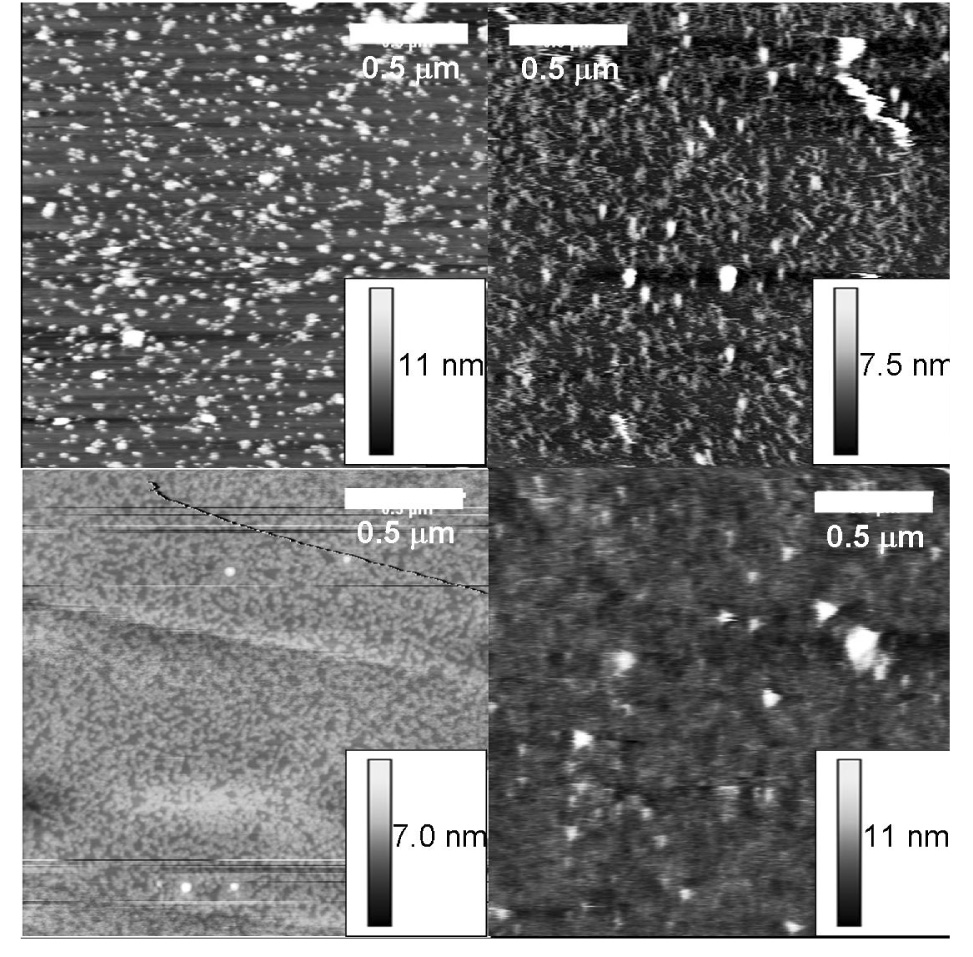
Fn on mica imaged in PBS with the AAC mode from a solution concentration of (A) 1 µg/ml corresponding to 8% surface coverage, (B) 5 µg/ml corresponding to 20% surface coverage, (C) 10 µg/ml corresponding to 54% surface coverage, and (D) 20 µg/ml for one minute corresponding to 100% surface coverage. As the solution concentration increases the surface coverage increases. At the highest solution concentration the substrate is no longer visible.
AFM tip modification
To perform binding experiments, it was necessary to covalently link the ScpB adhesin to the AFM tip. This requires a hetereo-bifunctional cross-linker that will bind both to the GST tag on ScpB and to the tip surface, while avoiding interactions with ScpB or the tip surface and elevating ScpB above the functionalized tip so it is free to move within the confines of its tether. The NHS–PEG–PDP cross-linker [33] was chosen because the PDP group will bind to the cystine on the GST tag and the NHS group will bind to an amine on the tip surface. The effectiveness of this cross-linker has been proven in other single molecule studies [32,34,35].
Although there are some primary amines and hydroxyl groups already present on the surface of the AFM tips [36], ethanolamine HCl was used to introduce additional amines elevated slightly off the tip surface to reduce the stearic hindrance for further modification. Literature values of the surface amine coverage obtained after ethanolamine treatment ranges from 723 to 1820 amines µm−2 [32,37]. For a tip radius of 25 nm this coverage provides roughly 1–2 functionalized sites at the tip apex, which is essential for sensing single molecule interactions. Table 1 shows the atomic composition and the percentage contribution from each carbon species from XPS for silicon nitride before and after the introduction of ethanolamine, and Fig. 2a, b shows the high-resolution carbon spectra scaled to the hydrocarbon peak for these two steps. Note that the high concentration of oxygen detected on the starting silicon nitride samples show the surface of this material is actually a silicon oxynitirde. Fig. 3 shows the intensity of ethanolamine-related ToF–SIMS peaks scaled by the total ion counts in the spectrum for the blank silicon nitride surface (b), silicon nitride treated with ethanolamine (a), and both surfaces treated with PEG (ap and bp). The positive spectra fragments CH3NH3+ and HOCH2CH2NH3+ can originate from ethanolamine molecules that are either adsorbed to or covalently bound to the silicon nitride surface, while the negative spectra fragments SiOC2H5N− and SiOC2H7N− are representative of the alcohol covalently bound to the silicon nitride surface. All four peaks exhibit the same trend, reaching the highest intensities for surfaces treated with ethanolamine.
Table 1.
XPS determined atomic composition and high resolution carbon peak fits of the functionalized substrates used in this study. (b) bare silicon nitride, (a) silicon nitride treated with ethanolamine, (ap) silicon nitride treated with ethanolamine and NHS–PEG–PDP, (bp) silicon nitride with NHS–PEG–PDP, and (ScpB) silicon nitride treated with ethanolamine, NHS–PEG–PDP and ScpB.
| Atomic composition | High-resolution carbon peak fit | ||||||
|---|---|---|---|---|---|---|---|
| C | N | O | Si | CH | CN/CO | COO/CON | |
| b | 14.1(1.1) | 23.7(0.9) | 32.1(0.5) | 30.1(0.5) | 72% | 18% | 10% |
| a | 13.7(0.7) | 23.8(0.3) | 32.6(0.3) | 30.0(0.6) | 65% | 25% | 10% |
| ap | 15.0(1.1) | 23.9(1.3) | 31.4(0.8) | 30.5(0.3) | 43% | 41% | 16% |
| bp | 15.4(1.8) | 22.7(0.8) | 32.7(0.9) | 29.2(0.9) | 42% | 38% | 20% |
| ScpB | 32.9(1.3) | 16.5(0.7) | 28.7(1.2) | 21.9(0.8) | 44% | 33% | 23% |
Figure 2.
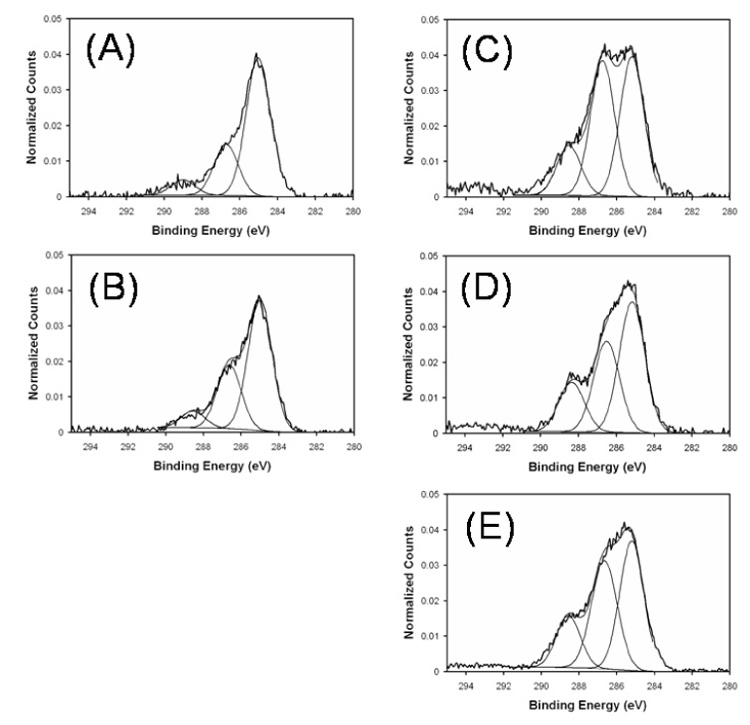
High resolution carbon spectra calibrated and normalized to the CH peak at 285 eV. (A) blank silicon nitride, (B) silicon nitride with ethanolamine HCl, (C) silicon nitride with ethanolamine HCl and NHS-PEG-PDP, (D) silicon nitride with NHS-PEG-PDP, and (E) silicon nitride with ethanolamine HCl, NHS-PEG-PDP, and ScpB. The peak at 285 eV is due to hydrocarbon C-C/C-H, the peak at 287 eV is due to C-N/C-O, and the peak at 289 eV is due to O-C=O/N-C=O. Shake up satellites from the pyridine ring are observed near 293.5 eV.
Figure 3.
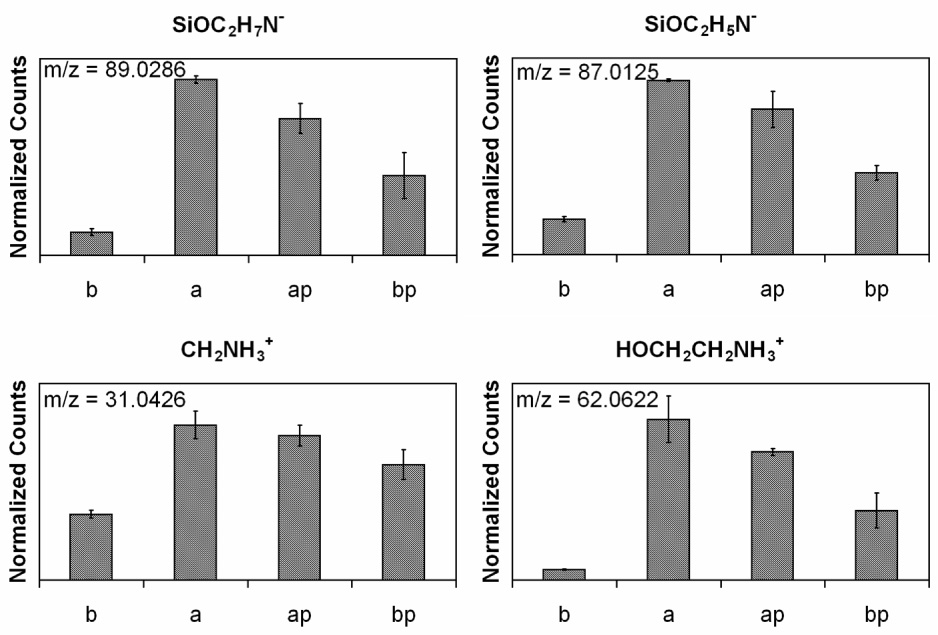
ToF-SIMS peak intensities scaled by total ion counts for ethanolamine fragments. (b) blank silicon nitride, (a) silicon nitride with ethanolamine, (ap) silicon nitride with ethanolamine and NHS-PEG-PDP, and (bp) silicon nitride with NHS-PEG-PDP.
Fig. 2 c and d, and Table 1, show the introduction of the NHS–PEG–PDP is verified by the increase in the CO/CN peak, the slight increase in the total carbon concentration, and the appearance of shake up satellites at high binding energies due to the aromatic ring in the PEG linker. The atomic percent of carbon indicates that there are similar amounts of the cross-linker on both surfaces, but the surface without the ethanolamine treatment has a lower CO/CN peak in the high-resolution carbon spectrum. This is due to the absence of the ethanolamine on this surface since the C–O and C–N bonds in ethanolamine also will contribute to this peak. Although the silicon nitride substrates were thoroughly cleaned before any modification steps were performed, it should be noted that the surface is not pure silicon nitride. ToF-SIMS shows that the species introduced by the ethanolamine treatment are already present on the surface, but to a lesser degree. Both positive and negative ToF–SIMS shows a variety of organic N species that the cross-linker could bind to (data not shown). This raises the question as to whether or not the PEG is binding to the ethanolamine or other organic nitrogen species on the surface. Fig. 4 shows positive and negative ToF–SIMS fragments of the amide bond formed by the conjugation of the NHS group to the silicon nitride surface. The negative fragments CHCH2NHCO− and CH2NHCO− and the positive fragments CH3CH2NHCOCH3+ and CH3CH2NHCOCH2CH2+ indicate that the conjugation was successful; however, they also indicate that the binding occurs equally as well on the surface not treated with ethanolamine. Fig. 5 shows positive ToF–SIMS fragments related to the PEG cross-linker. The C3H5O2+ and C4H7O2+ fragments are from the PEG back bone and the C5H5NSH+ and the C5H4NS2+ fragments are from the PDP moiety. Since the amount of sulfur introduced by the PDP is not detectable by XPS, the higher sensitivity of ToF–SIMS data shows that these species are present on the PEG modified surface.
Figure 4.
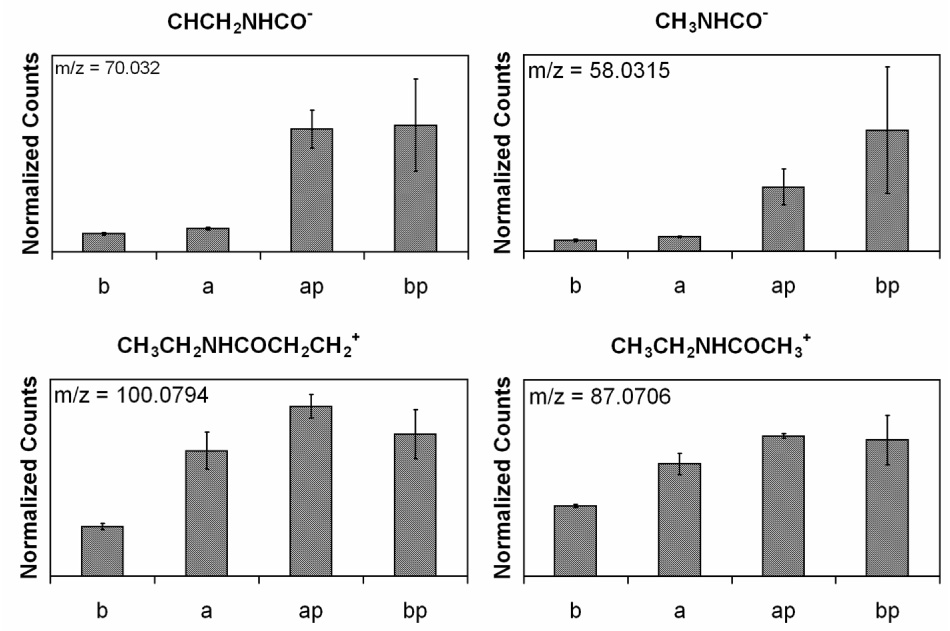
ToF-SIMS peak intensities scaled by total ion counts for amide fragments formed from the conjugation of the NHS-PEG-PDP. (b) blank silicon nitride, (a) silicon nitride with ethanolamine, (ap) silicon nitride with ethanolamine and NHS-PEG-PDP, and (bp) silicon nitride with NHS-PEG-PDP.
Figure 5.
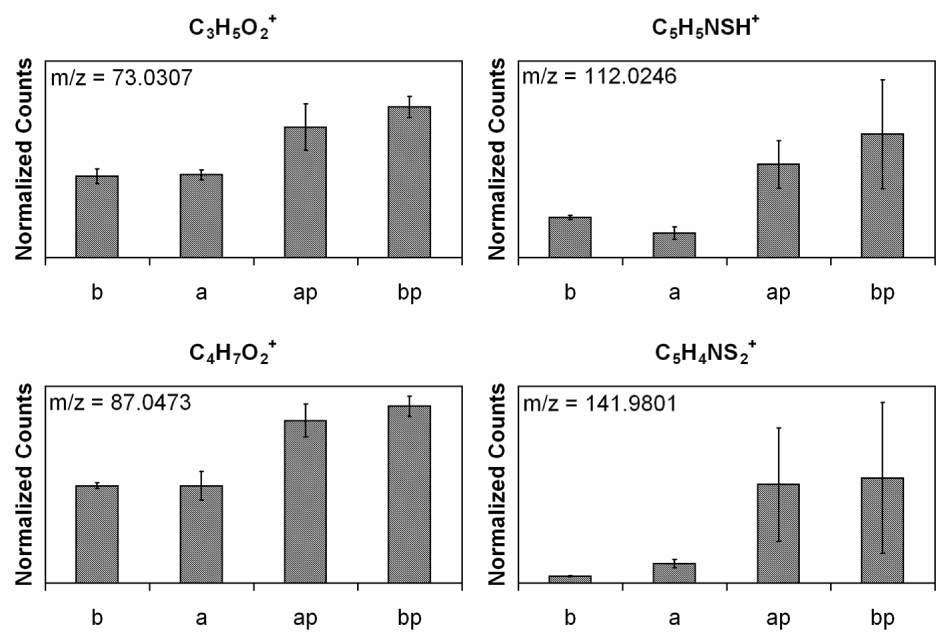
ToF-SIMS peak intensities scaled by total ion counts for PEG fragments from the NHS-PEG-PDP crosslinker. (b) blank silicon nitride, (a) silicon nitride with ethanolamine, (ap) silicon nitride with ethanolamine and NHS-PEG-PDP, and (bp) silicon nitride with NHS-PEG-PDP.
Table 1 and Fig. 2e shows the atomic composition and high-resolution carbon spectra for the attachment of ScpB to the AFM tip. The changes in the atomic percent of carbon, oxygen and nitrogen, along with the attenuation of the silicon signal, show that the ScpB is attached to the AFM tip. Although it is expected that the presence of the amide bond from the ScpB would cause the highest BE C1s peak to shift slightly lower in BE, this is not observed due to the complex nature of the silicon nitride surface.
Other researchers have shown that the ethanolamine treatment is not necessary for the conjugation of the PEG cross-linker and that specific binding events are observable without this step [37]. However, the ethanolamine treatment was shown to result in a higher percentage of specific binding events. These data are consistent with our observation that the PEG cross-linker binds to the silicon nitride surface that was not treated with ethanolamine.
PEG and nonspecific adhesion
PEG is chosen as a cross-linker because it helps keep the molecule attached to the tip in its native state [38]; however, the question remains as to whether or not the PEG linker will reduce nonspecific interactions between the tip and the adsorbed Fn film. To access whether or not the PEG linker decreases nonspecific adhesion, interactions measured in PBS between a methoxy PEG covered AFM tip with a monolayer of Fn adsorbed onto mica from a 20 µg ml−1 solution for one min were compared to interactions between a bare AFM tip and a monolayer of Fn. Fig. 6 shows examples of force curves obtained with the PEG covered tip. Curve (A) exhibits a small nonspecific interaction and curve (B) shows the Fn molecule is unfolding [39–41], indicating that nonspecific interactions are not totally eliminated with the PEG covered tip. The percentage of the curves with no interaction, nonspecific adhesion and no detachment of the tip from the Fn surface was 71, 21 and 8%, respectively. The percentages for nonspecific adhesion and no detachment are non-zero, but there are only 2–3 PEG chains per tip area. The force required to remove the tip from the surface when nonspecific interactions occurred was 15 pN. For a bare AFM tip the nonspecific binding force is 55 pN and the percentage of force curves with no interactions, nonspecific interactions, and no detachment from the surface are 4, 92, and 4%, respectively. Compared to the bare tip, the PEG tip significantly reduces nonspecific adhesion. Since the bond rupture force for the methoxy PEG tip with the Fn surface is less than the forces between Fn and ScpB observed for all Fn surface densities (data presented in next section), this suggests that the measured forces in the Fn ScpB interactions were between Fn and ScpB and not between PEG and Fn.
Figure 6.
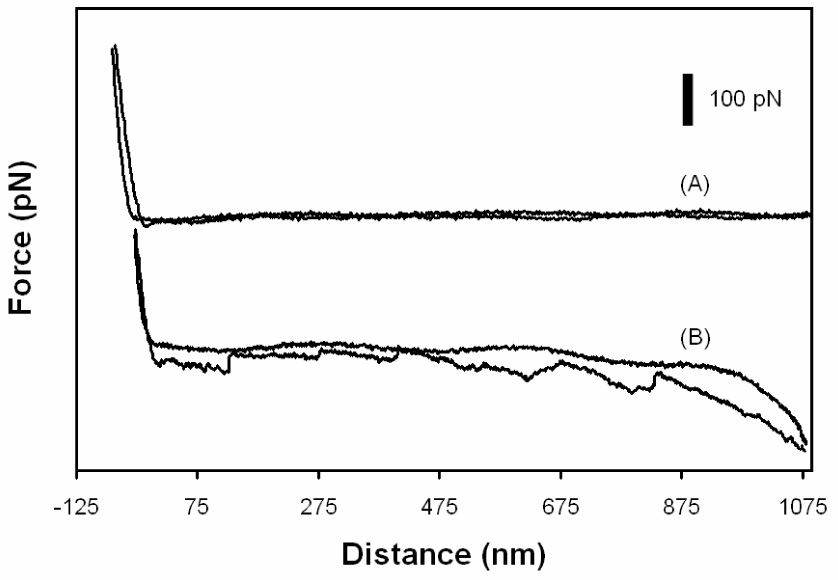
Force distance curves with a methoxy PEG functionalized AFM probing Fn on mica. (A) shows very little nonspecific adhesion to the Fn covered surface; however (B) shows a case where an Fn forms a bridge between the tip and the surface not allowing the tip to detach. The saw tooth shape of (B) indicates the Fn is unfolding while being pulled.
Force spectroscopy with Fn and ScpB
Single-molecule force spectroscopy is an ideal tool to study ScpB–Fn interactions. The force measured by this technique is dependent on the rate of pulling and the energy landscape of the system studied [42]. Generally, larger binding forces correlate to a stronger affinity. We have recently shown that the structure and reactivity of adsorbed Fn depends on surface density of the Fn film [31], with enhanced binding towards the N-terminus of the molecule as the surface concentration increases. If the ScpB–Fn binding depends only on whether Fn is adsorbed or in solution, then the binding force should not vary with surface concentration, and the frequency of interaction should increase or decrease depending on whether or the ScpB binding site is hidden or exposed by the structural changes of Fn film. The force distribution should be bimodal for all surface concentrations since there are two interaction sites for the Scp/Fn system [22]. If the ScpB–Fn binding interaction requires multiple adjacent Fn molecules there will be minimal binding at the lowest surface concentrations when there are few clusters of Fn molecules with a unimodal distribution corresponding to the low affinity binding site. As the surface concentration of Fn increases, the frequency and force of binding should increase with a bimodal force distribution corresponding to high and low affinity binding sites.
The surface concentration of Fn is systematically varied from single molecules to clusters to a monolayer. Fig. 7 shows force curves for Fn/ScpB interactions for surface coverages of 8% and 100% as well as the blocking experiment. Fig. 8 shows the force distribution for the ScpB/Fn system at different Fn surface concentrations. The measured forces for the Fn ScpB interactions were 19, 20, 22, and 34 pN for the 8, 20, 54, and 100% Fn surface coverages, respectively. As the Fn surface density increases, both the frequency of binding events and the rupture force increases with a sharp increase observed between Fn surface coverages of 54 and 100%, which correspond to Fn solution concentrations of 10 µg ml−1 and 20 µg ml−1. At the highest concentration, the force distribution exhibits two broad peaks, suggesting a bimodal distribution. To ensure that the binding of ScpB to Fn is specific, the system was flooded with excess ScpB and probed. With excess ScpB in solution, the available binding sites on the Fn film will be occupied and no binding to the ScpB bound to the AFM tip should be observed. Only 8% of the force curves in this control experiment show binding interactions.
Figure 7.
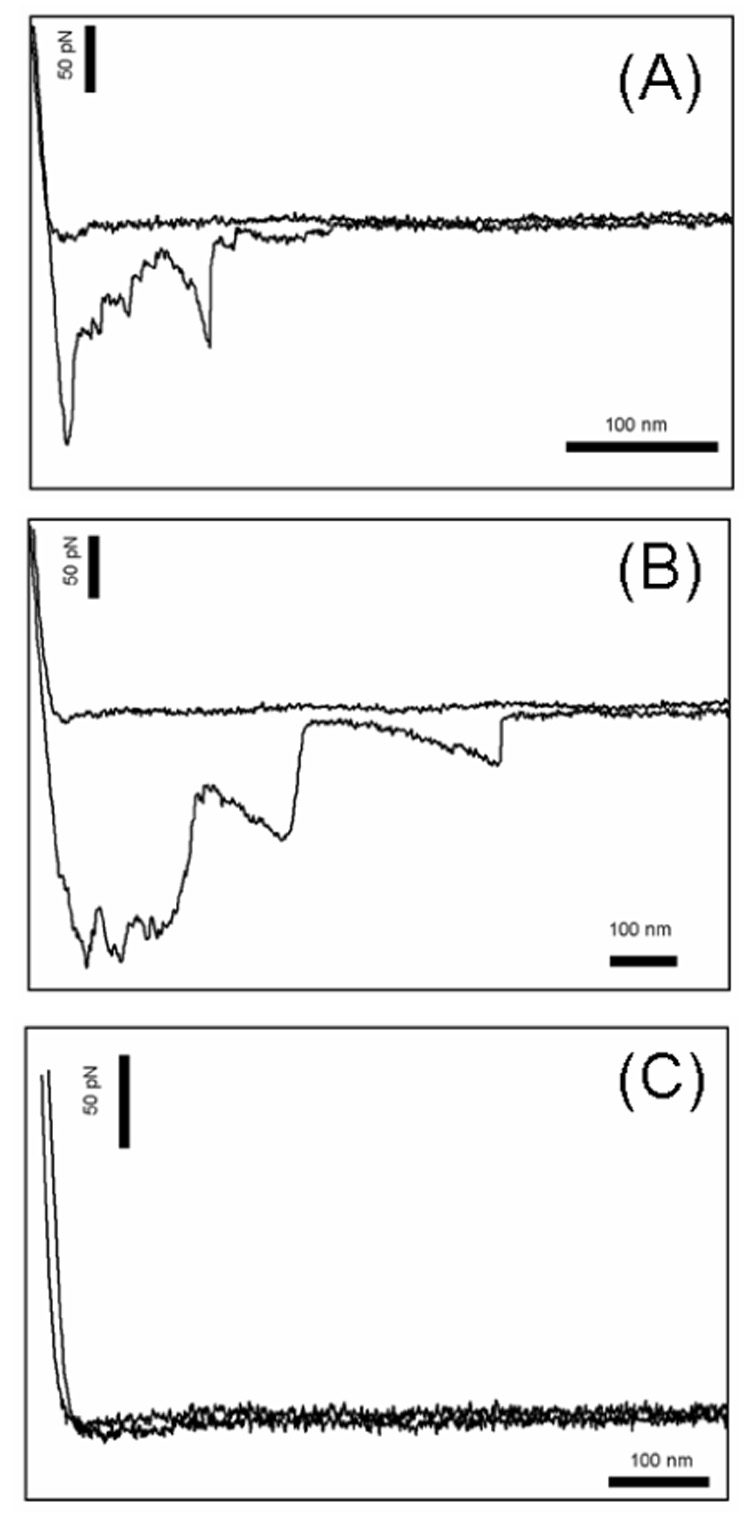
Typical force distance curves for the force spectroscopy experiments with ScpB and Fn. (A) Fn surface coverage of 8%, (B) Fn surface coverage of 100%, (C) Fn blocked with excess ScpB. Note that horizontal scale bars in the plots are the same distance. The interactions lengths for the higher concentrations is longer.
Figure 8.
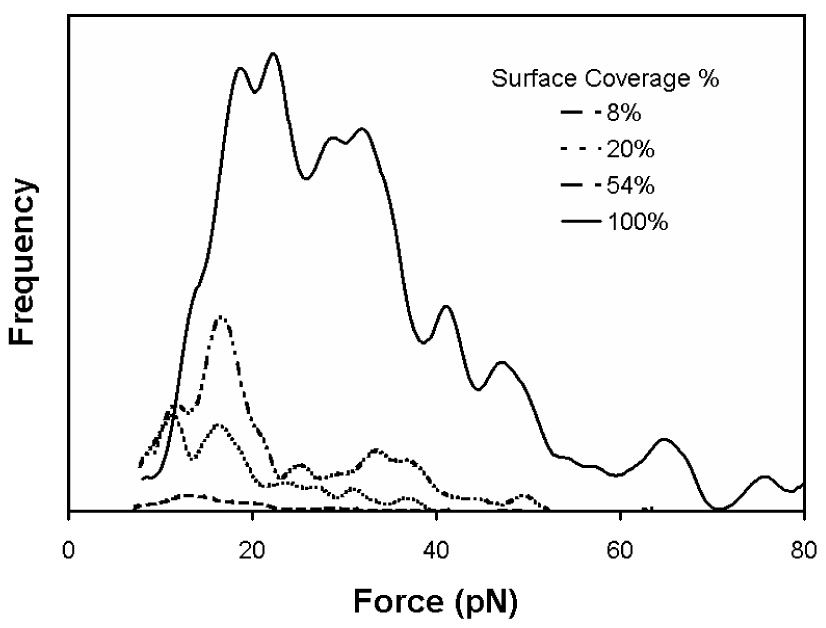
Force distributions for the Fn/ScpB system as a function of Fn surface coverage. As the surface density of Fn increases, the frequency of an interaction and the rupture force both increase. There is a large jump in the frequency and force from 54 to 100 % Fn coverage, indicating that there is a transition where the binding becomes more favorable. The average rupture forces were 19 pN (8% Fn coverage), 20 pN (20% Fn coverage), 22 pN (54% Fn coverage) and 34 pN (100% Fn coverage), based on calculating the distribution mean. If the peaks in the force distribution are fit to a Gaussian distribution, the first peak is at 14 pN and the second peak is at 29 pN.
The 55% increase in binding force observed when the Fn surface density increases from 54% to 100% is consistent with the hypothesis that ScpB binds to a cryptic site exposed when a critical film density is reached. The 150% increase in frequency and the bimodal force distribution at the highest Fn surface concentration is consistent with the hypothesis that ScpB binds to a site created by the juxtaposition of multiple Fn molecules. It should be noted that the conformation of Fn on both cellular and inorganic surfaces can be significant different from its conformation in solution. The conformation of Fn on cell surfaces is mediated by integrins and other cell surface receptors [43], whereas on mica the conformation of Fn is mediated by surface-Fn and Fn–Fn interactions. We have recently proposed for high Fn surface concentrations on mica the N-terminus of the Fn is located towards the top of the film [31], and Tamura et al. [1] have demonstrated that GBS does not bind to Fn on a solid phase if the N-terminus portion of the molecule is not present. These data, taken together, suggest that it is the proximity of the N-terminus of multiple adjacent Fn molecules that mediates ScpB binding Fn. Thus, the low force/frequency binding observed at surface coverages below 54% is primarily due to the low affinity binding site while the high force/frequency binding observed at surface coverages above 54% is primarily due to the high affinity binding site.
Conclusions
The chemistry used for functionalizing the AFM tip increases primary amines on the surface, and the NHS–PEG–PDP cross-linker covalently attaches to these amine as well as endogenous amines. Also, the introduction of the cross-linker significantly reduces nonspecific adhesion when compared to a bare AFM tip. As shown by the force spectroscopy experiments, both the binding force and the frequency of binding events markedly increased as the surface concentration of Fn approached saturation. These results are consistent with the hypothesis that the specificity of ScpB for immobilized Fn is based upon a cryptic determinant that is exposed at the higher coating concentration, and that ScpB binds to a site created by the juxtaposition of the N-terminus of multiple Fn molecules.
Acknowledgements
This work was funded by NESAC/BIO (NIH Grant EB-002027), UWEB (NSF Grant EEC-9529161), and the Engineered Biomaterials Training Grant (NIH Grant GM-065098). The author wishes to acknowledge Lara Gamble, Dan Graham and, Roger Michel for their help in acquiring and interpreting the XPS and ToF-SIMS data.
Footnotes
Publisher's Disclaimer: This is a PDF file of an unedited manuscript that has been accepted for publication. As a service to our customers we are providing this early version of the manuscript. The manuscript will undergo copyediting, typesetting, and review of the resulting proof before it is published in its final citable form. Please note that during the production process errors may be discovered which could affect the content, and all legal disclaimers that apply to the journal pertain.
References
- 1.Tamura GS, Rubens CE. Group-B Streptococci adhere to a variant of fibronectin attached to a solid-phase. Molecular Microbiology. 1995;15(3):581–589. doi: 10.1111/j.1365-2958.1995.tb02271.x. [DOI] [PubMed] [Google Scholar]
- 2.Farley MM, Harvey C, Stull T, Smith JD, Schuchat A, Wenger JD, Stephens DS. A Population-based assessment of invasive disease due to Group B Streptococcus in nonpregnant adults. N Engl J Med. 1993;328(25):1807–1811. doi: 10.1056/NEJM199306243282503. [DOI] [PubMed] [Google Scholar]
- 3.Doran KS, Nizet V. Molecular pathogenesis of neonatal group B streptococcal infection: no longer in its infancy. Molecular Microbiology. 2004;54(1):23–31. doi: 10.1111/j.1365-2958.2004.04266.x. [DOI] [PubMed] [Google Scholar]
- 4.Burnham C-AD, Tyrell GJ. Virulence factors of group B streptococci. Reviews in Medical Microbiology. 2003;14:109–118. [Google Scholar]
- 5.Baker CJ. Streptococcal Infections Clinical Aspects, Microbiology, and Molecular Pathogenesis. New York: Oxford University Press; 2000. Group B Streptococcal Infections; pp. 238–254. [Google Scholar]
- 6.Farley MM. Group B streptococcal disease in nonpregnant adults. Clin Infect Dis. 2001;33(4):556–561. doi: 10.1086/322696. [DOI] [PubMed] [Google Scholar]
- 7.Garcia-Lechuz JM, Bachiller P, Vasallo FJ, Munoz P, Padilla B, Bouza E. Group B streptococcal osteomyelitis in adults. Medicine. 1999;78:1919. doi: 10.1097/00005792-199905000-00005. [DOI] [PubMed] [Google Scholar]
- 8.Kane J, Jackson K, Conway J. Maternal postpartum Group B Beta-hemolytic streptococcus ventriculoperitoneal shunt infection. Archives of Gynecology and Obstetrics. 2004;269(2):139–141. doi: 10.1007/s00404-002-0464-7. [DOI] [PubMed] [Google Scholar]
- 9.Sambola A, Miro JM, Tornos MP, Almirate B, Moreno-Torrico A, Gurgui M, Martinez E, Rio AD, Azqueta M, Marco F, Gatell JM. Streptococcus agalactiae Infective endocarditis: analysis of 30 cases and review of the literature, 1962–1998. Clin Infect Dis. 2002;34(12):1576–1584. doi: 10.1086/340538. [DOI] [PubMed] [Google Scholar]
- 10.Finlay BB, Falkow S. Common themes in microbial pathogenecity. Microbiological Reviews. 1989;53(2):210–230. doi: 10.1128/mr.53.2.210-230.1989. [DOI] [PMC free article] [PubMed] [Google Scholar]
- 11.Patti JM, Allen BL, McGavin MJ, Hook M. MSCRAMM-mediated adherence of microorganisms to host tissues. Annual Review of Microbiology. 1994;48:585–629. doi: 10.1146/annurev.mi.48.100194.003101. [DOI] [PubMed] [Google Scholar]
- 12.Joh D, Wann ER, Kreikemeyer B, Spezaile P, Hook M. Role of fibronectin-binding MSCRAMMS in bacterial adherence and entry into mammalian cells. Matrix Biology. 1999;18:211–223. doi: 10.1016/s0945-053x(99)00025-6. [DOI] [PubMed] [Google Scholar]
- 13.Abu-Lail NI, Camesano TA. Specific and nonspecific interaction forces between escherichia coli and silicon nitride, determined by Poisson statistical analysis. Langmuir. 2006;22(17):7296–7301. doi: 10.1021/la0533415. [DOI] [PubMed] [Google Scholar]
- 14.An SSA, Jimenez-Barbero J, Peterson TE, Llinas M. The two polypeptide chains in fibronectin are joined in antiparallel fashion: NMR structural characterization. Biochemistry. 1992;31:9927–9933. doi: 10.1021/bi00156a010. [DOI] [PubMed] [Google Scholar]
- 15.Joh HJ, House-Pompeo K, Patti JM, Gurusiddappa S, Hook M. Fibronectin receptors from gram-positive bacteria: comparison of active sites. Biochemistry. 1993;33:6086–6092. doi: 10.1021/bi00186a007. [DOI] [PubMed] [Google Scholar]
- 16.Kreikemeyer B, Oehmcke S, Nakata M, Hoffrogge R. Streptococcus pyogenes fibronectin-binding protein F2. Journal of Biological Chemistry. 2004;279(16):15850–15859. doi: 10.1074/jbc.M313613200. [DOI] [PubMed] [Google Scholar]
- 17.Thomas WE, Trintchina E, Forero M, Vogel V, Sokurenko EV. Bacterial adhesion to target cells enhanced by shear force. Cell. 2002;109:913–923. doi: 10.1016/s0092-8674(02)00796-1. [DOI] [PubMed] [Google Scholar]
- 18.Butler KM, Baker CJ, Edwards MS. Interaction of soluble fibronectin with Group B streptococci. Infect Immun. 1987;55(10):2404–2408. doi: 10.1128/iai.55.10.2404-2408.1987. [DOI] [PMC free article] [PubMed] [Google Scholar]
- 19.Hull JR, Shannon JJ, Tamura GS, Castner DG. Atomic force microscopy and surface plasmon resonance investigation of fibronectin interactions with group B streptococci. Biointerphases. 2007;2(2):64–72. doi: 10.1116/1.2738854. [DOI] [PubMed] [Google Scholar]
- 20.Morehead J, Coppens I, Andrews NW. Opsonization Modulates Rac-1 Activation during Cell Entry by Leishmania amazonensis. Infect. Immun. 2002;70(8):4571–4580. doi: 10.1128/IAI.70.8.4571-4580.2002. [DOI] [PMC free article] [PubMed] [Google Scholar]
- 21.Beckmann C, Waggoner JD, Harris TO, Tamura GS, Rubens CE. Identification of novel adhesins from group B streptococci by use of phage display reveals that C5a peptidase mediates fibronectin binding. Infection and Immunity. 2002;70(6):2869–2876. doi: 10.1128/IAI.70.6.2869-2876.2002. [DOI] [PMC free article] [PubMed] [Google Scholar]
- 22.Tamura GS, Hull JR, Oberg MD, Castner DG. High-affinity interaction between fibronectin and the group B streptococcal C5a peptidase is unaffected by a naturally occurring four-amino-acid deletion that eliminates peptidase activity. Infection and Immunity. 2006;74(10):5739–5746. doi: 10.1128/IAI.00241-06. [DOI] [PMC free article] [PubMed] [Google Scholar]
- 23.Engel J, Odermatt E, Engel A. Shapes, domain organizations and flexibility of laminin and fibronectin, two multifunctional proteins of the extracellular matrix. J. Mol. Biol. 1981;150:97–120. doi: 10.1016/0022-2836(81)90326-0. [DOI] [PubMed] [Google Scholar]
- 24.Emch R, Zenhausern F, Jobin M, Taborelli M, Descouts P. Morphologocal difference between fibronectin sprayed on mica and on PMMA. Ultramicroscopy. 1992;42–44:1155–1160. doi: 10.1016/0304-3991(92)90417-i. [DOI] [PubMed] [Google Scholar]
- 25.Johnson KJ, Sage H, Briscoe G, Erickson HP. The compact conformation of fibronectin is determined by intramolecular ionic interaction. J. Biol. Chem. 1999;274(22):15473–15479. doi: 10.1074/jbc.274.22.15473. [DOI] [PubMed] [Google Scholar]
- 26.Yamada KM. Fibronectin Domains and Receptors. In: Mecham RP, editor. Fibronectin. New York: Academic Press; 1989. pp. 47–121. [Google Scholar]
- 27.Hutter JL, Bechhoefer J. Calibration of atomic-force microscope tips. Review of Scientific Instruments. 1993;64(7):1868. [Google Scholar]
- 28.Kasas S, Riederer BM, Catsicas S, Cappella B, Dietler G. Fuzzy logic algorithm to extract specific interaction forces from atomic force microscopy data. Review of Scientific Instruments. 2000;71(5):2082–2086. [Google Scholar]
- 29.Baumgartner W, Hinterdorfer P, Schindler H. Data analysis of interaction forces measured with the atomic force microscope. Ultramicroscopy. 2000;85:85–95. doi: 10.1016/s0304-3991(99)00154-0. [DOI] [PubMed] [Google Scholar]
- 30.Ratner BD, Leach-Scampavia D, Castner DG. ESCA surface characterization of four IUPAC reference polymers. Biomaterials. 1993;14(2):148–152. doi: 10.1016/0142-9612(93)90229-u. [DOI] [PubMed] [Google Scholar]
- 31.Hull JR, Tamura GS, Castner DG. Structure and reactivity of adsorbed fibronectin films on mica. Biophysical Journal. 2007;93(8):2852–2860. doi: 10.1529/biophysj.107.109819. [DOI] [PMC free article] [PubMed] [Google Scholar]
- 32.Hinterdorfer P, Schilcher K, Baumgartner W, Gruber HJ, Schindler H. A Mechanistic study of the dissociation of individual antibody-antigen pairs by atomic force microscopy. Nanobiology. 1998;4:177–188. [Google Scholar]
- 33.Haselgrubler T, Amerstorfer A, Schindler H, Gruber HJ. Synthesis and Applications of a new poly(ethylene glycol) derivative for the cross-linking of amines with thiols. Bioconjugate Chemistry. 1995;6(3):242–248. doi: 10.1021/bc00033a002. [DOI] [PubMed] [Google Scholar]
- 34.Hinterdorfer P, Gruber HJ, Kienberger F, Kada G, Riener C, Borken C, Schindler H. Surface attachment of ligands and receptors for molecular recognition force microscopy. Colloids and Surfaces B: Biointerfaces. 2002;23:115–123. [Google Scholar]
- 35.Willemsen OH, Snel MME, Werf KOvd, deGrooth BG, Greve J, Hinterdorfer P, Gruber HJ, Schindler H, Kooyk Yv, Figdor CG. Simultaneous height and adhesion imaging of antibody-antigen interactions by atomic force microscopy. Biophysical Journal. 1998;75:2220–2228. doi: 10.1016/S0006-3495(98)77666-0. [DOI] [PMC free article] [PubMed] [Google Scholar]
- 36.Senden TJ, Drummond CJ. Surface chemistry and tip-sample interactions in atomic force microscopy. Colloids and Surfaces A: Physicochemical and Engineering Aspects. 1995;94(1):29. [Google Scholar]
- 37.Riener CK, Stroh CM, Ebner A, Klampfl C, Gall AA, Romanin C, Lyubchenko YL, Hinterdorfer P, Gruber HJ. Simple test system for single molecule recognition force microscopy. Analytica Chimica Acta. 2003;479(1):59–75. [Google Scholar]
- 38.Michel R, Pasche S, Textor M, Castner DG. Influence of PEG architecture on protein adsorption and conformation. Langmuir. 2005;21(26):12327–12332. doi: 10.1021/la051726h. [DOI] [PMC free article] [PubMed] [Google Scholar]
- 39.Conti M, Donati G, Cianciolo G, Stefoni S, Samori B. Force spectroscopy study of the adhesion of plasma proteins to the surface of a dialysis membrane: role of the nanoscale surface hydrophobicity and topography. Journal of Biomedical Materials Research. 2002;61(3):370–379. doi: 10.1002/jbm.10168. [DOI] [PubMed] [Google Scholar]
- 40.Meadows PY, Walker GC. Force microscopy studies of fibronectin adsorption and subsequent cellular adhesion to substrates with well-defined surface chemistries. Langmuir. 2005;21(9):4096–4107. doi: 10.1021/la047241v. [DOI] [PubMed] [Google Scholar]
- 41.Oberdorfer Y, Fuchs H, Janshoff A. Conformational analysis of native fibronectin by means of force spectroscopy. Langmuir. 2000;16:9955–9958. [Google Scholar]
- 42.Evans E. Probing the relation between force--lifetime--and chemistry in single molecular bonds. Annual Review of Biophysics and Biomolecular Structure. 2001;30:105. doi: 10.1146/annurev.biophys.30.1.105. [DOI] [PubMed] [Google Scholar]
- 43.Schwarzbauer JE, Sechler JL. Fibronectin fibrillogenesis: a paradigm for extracellular matrix assembly. Current Opinion in Cell Biology. 1999;11(5):622–627. doi: 10.1016/s0955-0674(99)00017-4. [DOI] [PubMed] [Google Scholar]