

Abstract
Time-dependent changes in brain activity were assessed in a group of older adults who maintained good physical and cognitive health at Years 1, 3, 5, 7, and 9 of the Baltimore Longitudinal Study of Aging neuroimaging study. Each year, these participants underwent PET scans during rest and delayed verbal and figural recognition memory conditions. While memory performance remained stable over the 8 years, both generalized and modality-specific patterns of time-dependent changes in regional cerebral blood flow (rCBF) were found. Many brain regions showed steady, progressive changes in rCBF over the 8 years while others maintained rCBF for a number of years before showing incremental declines or increases in activity. These temporal patterns of change were observed in many regions of the brain, particularly in the frontal and temporal lobes, suggesting that there are distinctive patterns of age-related functional decline and compensatory activity over time. The precise patterns of regional involvement and the temporal dynamics of rCBF change within specific regions vary based on cognitive processing demands.
Keywords: positron emission tomography, functional imaging, neuroimaging, brain function, age, aging, verbal, spatial, memory
INTRODUCTION
In the accompanying paper (ref paper 1 [5]), we demonstrated that brain function continues to change over time in a group of healthy, cognitively stable older adults. When comparing brain activity between Year 1 and Year 9 PET assessments of participants in the Baltimore Longitudinal Study of Aging (BLSA) neuroimaging study, changes were observed in resting brain function and during verbal and figural recognition conditions. These regional patterns of change were further characterized as generalized changes in brain function common to all conditions as well as changes specific to either verbal or figural recognition memory alone. Unique areas of both decreased and increased blood flow were found for each condition, suggesting that regionally specific patterns of longitudinal decline and compensatory activity that occur in normal aging are dependent on task condition or cognitive modality.
Although we described the overall changes that occur over the 8 year period, our previous work did not examine the temporal dynamics of changes in brain activity over time. Based on pathologic processes associated with the aging brain, different regions should exhibit different temporal patterns of change. For instance, some regions should show progressive decreases in activity simply due to the nature of the pathologic change. As an example, the development of neurofibrillary tangles (NFTs) begins as early as age 55 with most adult brains exhibiting tangles by age 70 [7,35,44]. NFTs first appear in the hippocampus and adjacent medial temporal cortical areas and progress in a predictable pattern to affect frontal and cingulate regions, followed by parietal and occipital regions with advancing age [6,7]. The accumulation within specific regions is often age-dependent, particularly in the hippocampus, and entorhinal and inferior temporal cortex [20,43]. It is possible that this type of age-related or progressive pathology would result in progressive declines in function.
It is also reasonable to assume that not all changes in functional brain activity will be progressive in nature. While both cellular (see [53]) and neurotransmitter changes (see [42]) occur with age, the impact of these alterations on changes in brain function may reflect a threshold effect rather than steady decline. That is, even in the presence of pathologic change, a region may retain functional ability until the accumulated changes cross some critical threshold. In this case, significant functional decline could occur within a relatively short time span.
While some regions may decrease activity as a function of time or accumulating pathology, others may show increased activity. Indeed, functional brain imaging studies have repeatedly demonstrated relative increases as well as decreases in brain activity when comparing older and younger individuals (see [8,36]). Currently, two theories have been proposed to explain increases in regional brain activity in older adults. First, the functional compensation theory [9,19,31,49] views increases as the recruitment of additional task-specific resources to compensate for the loss of activity in original task-related regions, while decreases in activity reflect decreases in functional integrity or efficiency. Alternatively, the dedifferentiation theory [27,29] proposes that increases in activity may represent a compensatory increase in regional processing that is more generalized in nature, while decreases in activity result from decreases in processing specificity. Although it is difficult to determine the underlying processes related to changes in functional brain activity with current techniques, it follows that age-related decreases in activity in some brain regions will necessitate reorganization, recruitment of additional resources or at least preservation of function in others to maintain normal behavior.
In the present paper, we distinguish between two types of longitudinal change. First, we determine steady, progressive changes in brain function by identifying regions that exhibit linear trends in brain activity over time. Second, we use step function analyses to identify incremental changes in brain function that occur within each successive two-year period. Based on pathologic data, we predict both linear and incremental changes will occur in the aging brain over Years 1 to 9 in our older adult sample. We also expect that distinctive temporal patterns of change will occur in both generalized and task-specific conditions, supporting and complementing the overall changes observed previously from Year 1 to 9. By determining time-dependent patterns of change, these results may help to explain the temporal susceptibility of specific regions in the normal aging brain and clarify the relationship between cognitive demands and shifts in brain activity with advancing age.
METHODS
Subjects
PET data from older participants in the neuroimaging substudy [47] of the BLSA [55] were used in this analysis (Table 1). Twenty five subjects from the BLSA pool met the health and inclusion criteria for this analysis (10 female, 15 male; mean baseline age = 67.8±6.6 years). All subjects were in good health with no history of central nervous system disorders, psychiatric disorders including major depression, or severe cardiovascular disease at Year 1 and maintained good physical health throughout the study. The subjects also completed annual neuropsychological evaluations and were deemed cognitively normal through Year 9 using previously described procedures for consensus diagnosis (see [22]) and Clinical Dementia Rating Scale assessments.
Table 1.
Participant Demographics (Mean (SD))
| Subjects | Mean Age Year 1 | Right Handed | Education (years) | MMSE Year 1 | MMSE Year 8.5 |
|---|---|---|---|---|---|
| 25 | 67.8 (6.6) | 23 | 17.3 (2.3) | 29.2 (0.6) | 29.1 (0.8) |
This study was approved by the local Institutional Review Board. All subjects provided written informed consent prior to each assessment.
Neuropsychological Testing
During each neuroimaging visit, participants completed a battery of 12 neuropsychological tests evaluating six cognitive domains. Memory was assessed using the California Verbal Learning Test (CVLT) and Benton Visual Retention Test (BVRT). Word knowledge and verbal ability were measured using Primary Mental Abilities Vocabulary (PMA). Verbal fluency was assessed by Letter (i.e. FAS) and Category fluency tests. Attention and working memory were measured by the Digit Span subtest of the Wechsler Adult Intelligence Scale-Revised, and the Trail Making Test. Digits Backward, Trails B, and Verbal Fluency (categories and letters) assessed executive function. The Card Rotations Test assessed visuospatial function. Data from evaluations at Years 1, 3, 5, 7 and 9 were used to examine changes in performance over time.
PET Scanning Conditions
Participants underwent PET scanning sessions at baseline (Year 1) and at annual follow-up intervals. Here, we present data from Years 1, 3, 5, 7 and 9 of the study. With the exception of 3 subjects, all scans were conducted at 2-year intervals. One subject had a 3 year interval between Year 5 and 7 assessments, one had a 3 year interval between Year 7 and 9 assessments and one had a 3 year interval between Year 3 and 5 assessments. These 3 subjects were included in the study because re-analysis excluding these three individuals did not affect our observations of longitudinal changes in brain activity.
During each imaging session (Years 1, 3, 5, 7, 9), three PET scans were performed: rest, verbal recognition, and figural recognition. During rest, participants were instructed to keep their eyes open and focused on a computer screen covered by a black cloth. During the recognition tasks, the subjects were asked to identify words and abstract designs that had been presented at the beginning of the session. Approximately thirty minutes before the first PET scan, subjects were shown a list of 20 target words for the verbal task and 20 target figures for the figural task on a computer screen (see [48] for detailed description). They were instructed to silently examine each item and try to remember it for later. During the verbal and figural recognition tasks, approximately 40 test items were shown during the PET image acquisition interval. Twenty of these were novel distractor items intermixed with the original 20 target items. Participants were asked to indicate whether or not they had seen each item before by pressing buttons in their right or left hands. Examples of the task stimuli are shown in Figure 1. In an attempt to reduce practice effects, two alternate versions of the tasks were administered over time: one version was given on odd years and the other was given on even years. The target stimuli presented in each version remained the same for even or odd years. To ensure that subjects could view the stimuli, the computer monitor was positioned at an optimal viewing distance each year until each subject could read sample words with 100% accuracy during the session. The order of conditions was counter-balanced across individuals, but remained constant within an individual across years. Accuracy and reaction times were recorded throughout both recognition tasks.
Figure 1. Verbal and Figural Recognition Task Stimuli.

Examples of the task stimuli are shown for the verbal (top) and figural (bottom) recognition conditions. For both Verbal and Figural tasks, subjects are shown a list of stimuli to remember prior to scanning. During the recognition phase, the subjects see a list of stimuli again and must indicate whether each stimulus was one that had been shown before. This phase is self paced, with the next stimulus appearing after the subject makes a response or after a maximum display time of 5000 ms.
PET Scanning Parameters
PET measures of regional cerebral blood flow (rCBF) were obtained using [15O]water. For each scan, 75 mCi of [15O] water were injected as a bolus. Scans were performed on a GE 4096+ scanner, which provides 15 slices of 6.5 mm thickness. Head positioning was performed with the aid of a custom thermoplastic mask made for each subject at Year 1, with a line drawn to indicate scanning angle. The same mask was used in all subsequent years to control for head placement and image acquisition angle. Images were acquired for 60 seconds from the time the total radioactivity counts in brain reached threshold level. Attenuation correction was performed using a transmission scan acquired prior to the emission scans.
Data Analysis
For each subject, the PET scans were realigned and spatially normalized into standard stereotactic space and smoothed to a full width at half maximum of 12, 12, and 12 mm in the x, y, and z planes. To control for variability in global flow, rCBF values at each voxel were ratio adjusted to the mean global flow of 50 ml/100g/min for each image. The image data were analyzed using Statistical Parametric Mapping (SPM2; Welcome Department of Cognitive Neurology, London, England), where voxel by voxel comparisons determined significant changes in rCBF over time (p≤0.001). Significant effects for each contrast were based on the magnitude of activation (Z = 3.09; p≤0.001) and spatial extent (>100 mm3). This threshold was chosen to include assessment of relatively small structures such as those in the medial temporal lobe that are known to be involved in the performance of these tasks [4]. The results for all contrasts are presented in Talairach space [58]. The coordinates of the local maxima for each contrast were converted from MNI space to Talairach space using the following algorithm: X'=0.88X−0.8; Y'=0.97Y−3.32; Z'=0.05Y+0.88Z−0.44.
To determine the temporal patterns of rCBF change over time, both linear and step function analyses were performed. For both analyses, the PET data were analyzed in two steps. Age at Year 1 baseline was included as a covariate in both sets of analyses to adjust for variability in baseline age. Subsequent assessments of CBF change over time were performed relative to the Year 1 age-adjusted baseline. In the linear analysis, longitudinal linear changes in regional cerebral blood flow (rCBF) were determined across Years 1, 3, 5, 7 and 9 within each of the scan conditions (rest, verbal, figural). Next, to further characterize these changes over time, the results from the first step were compared to one another in second level conjunction analyses to generate images representing generalized linear changes common across all conditions, changes specific to the verbal condition relative to rest and figural conditions, and changes specific to the figural condition relative to rest and verbal conditions (masking threshold p≤0.05, statistical threshold p≤ 0.001, >100 mm3 spatial extent).
A similar method was used in the step function analysis, where within-condition changes (rest, verbal, figural) were generated and these results were compared to one another to produce maps of generalized and modality-specific temporal patterns of brain activity change. Here, regions that maintained consistent levels of blood flow for x years before showing a significant increase/decrease within a two-year interval were determined. Changes were assessed at Years 3, 5, 7, and 9. In the case of increasing flow for example, the Year 3 analysis defined regions where the mean activity at Years 3–9 was greater than Year 1. In the Year 5 analysis, mean activity at Years 5–9 was greater than Years 1–3. The same procedure was performed for Years 7 and 9, defining regions where a significant increase in CBF occurred at those points and was maintained over subsequent years (see Figure 5, bottom row). Similar analyses were performed to define significant decreases in CBF at Years 3, 5, 7, and 9.
Figure 5. Incremental Changes in Brain Activation.

Differences in brain activation patterns that occur within a specific year are shown. Changes common to all scan conditions and those specific to verbal and figural recognition are displayed. Areas in blue show significant decreases in rCBF and areas in red show significant increases in rCBF that begin in each year. The graphs illustrate the temporal model used to determine rCBF change at each time point.
Similarities/differences between the rest, verbal and figural within-condition results were generated by using conjunction analyses which compare one image with other(s) (masking threshold of p≤0.05) to produce images representing generalized linear and step function changes common across all conditions, and changes specific to verbal and figural recognition alone. The statistical thresholds for each contrast image remained at p≤0.001, >100 mm3 spatial extent.
For those regions exhibiting a combination of linear and step function changes and those exhibiting linear changes alone, a region-of-interest (ROI) analysis was performed to determine the exact pattern of CBF change within these areas. The ROI analysis was performed by extracting the adjusted rCBF values at the local maxima for each region using a 4mm spherical search area. The data were then plotted to examine the temporal pattern of change.
Finally, additional analyses were performed to assess the effects of reaction time and task accuracy on the patterns of brain activity. In these analyses, performance levels were included as additional covariates. The resultant longitudinal changes in brain activity were compared between analyses including and not including performance levels as covariates.
RESULTS
Neuropsychological Testing
Performance on each test was compared across years (1, 3, 5, 7, 9) in separate analyses. For each analysis, a linear mixed model (LMM) was used that included sex and year. There was no change in performance across time for any task, no effect of sex on task performance levels, and no sex × time interactions in this sample of participants who were selected for inclusion based on stable physical and cognitive health.
PET Task Performance
Performance data are shown in Figure 2. Task accuracy, measured by sensitivity score (i.e. hits adjusted for false positives), and reaction times were compared across years (1, 3, 5, 7, 9) in separate analyses. For each analysis, a 2 × 2 × 5 repeated measures MANOVA was performed, with sex as a grouping factor and task condition (verbal, figural) and assessment (1,3,5,7,9) as within-subject factors. There was no overall change in sensitivity across time and no effect of sex on task performance levels. There was a significant difference between verbal and figural task performance with figural performance higher than verbal performance (df=1, 23, F=4.28, p≤0.049) but no significant difference between tasks in change over time. In contrast to the results for the sensitivity measure, reaction times decreased significantly over time (df=4, 20, F=6.81, p ≤ 0.001) and were slower overall for the figural relative to the verbal task (df=1, 23, F=31.43, p ≤ 0.0001). There was no effect of sex on reaction times for either task and no significant interactions.
Figure 2. Longitudinal Task Performance.
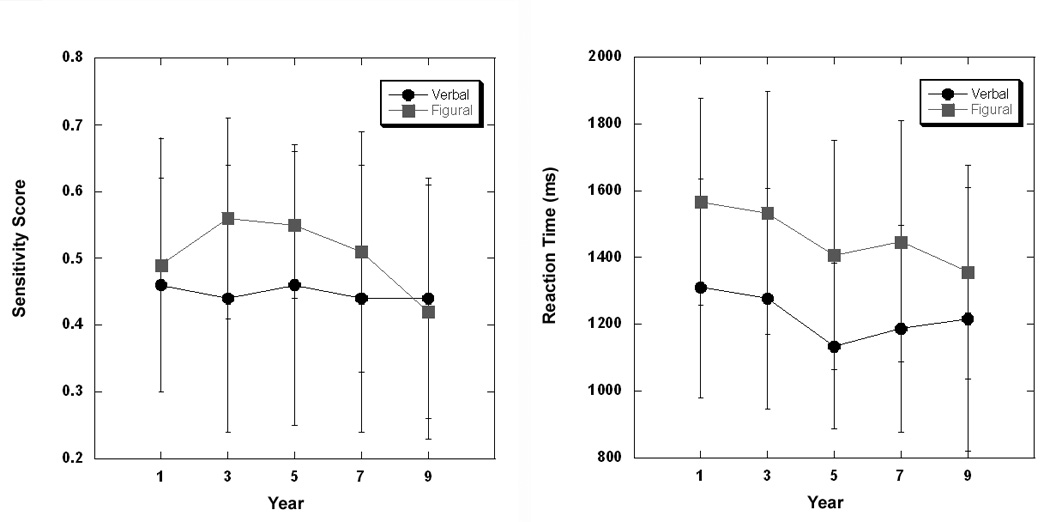
Performance data are shown for both verbal and figural recognition conditions. Task accuracy is shown as sensitivity score on the left (hits corrected for false positive responses). There was no significant change in performance levels over time for either task condition. Reaction times shown on the right decreased across time for both conditions and were significantly slower for the figural task.
We also performed a secondary analysis of the sensitivity scores using MANOVA with task and Year (1,3) as repeated measures factors to determine whether there was a significant learning effect from Year 1 to Year 3. Results showed no overall learning over time and no significant task by time interaction, indicating that the trend observed in Figure 2 did not reach significance.
Brain Activation
Both linear and step function analyses were performed to determine temporal patterns of change across Years 1, 3, 5, 7 and 9 for rest, verbal and figural memory conditions. The contrast images from these analyses were compared to one another to define changes common to all scan conditions, as well as verbal-specific and figural-specific changes over time. The linear analyses define regions that show consistent change in rCBF over time; the step function analyses illustrate regions that exhibit significant increases/decreases in rCBF within a two-year interval.
Common Linear Changes
Linear decreases in rCBF occurred across all scan conditions (Figure 3 left panel and Table 2). These decreases were observed in prefrontal regions, mostly in medial and middle frontal gyri, and in the anterior superior temporal lobes of the brain (Figure 4). Decreases were also found in inferior parietal areas and in the cuneus and mid-level thalamus. Linear increases in rCBF were seen in superior, middle and medial prefrontal regions predominately in the white matter but extending into the adjacent cortex. Other increases were seen in the insular cortex and left superior temporal cortex, middle occipital and cerebellar regions, and in the putamen and inferior-level thalamus.
Figure 3. Linear Changes in Brain Activation.

Regions showing steady linear changes in brain activation across all years are shown. Changes common to all scan conditions and those specific to verbal and figural recognition are displayed. Areas in blue show significant linear decreases in rCBF and areas in red show significant linear increases in rCBF over time. The green line illustrates the z level of the representative slice shown in each condition.
Table 2.
Local maxima table within areas of significant yearly change in rCBF common to all scan conditions. Stereotaxic coordinates are listed in Talairach space [58], Brodmann areas are indicated in parentheses. Spatial extent is listed in number of voxels (1 voxel=2mm3).
| Temporal Patterns: Common Findings | Coordinate | Spatial Extent |
||||
|---|---|---|---|---|---|---|
| Region | Side | x | y | z | T-value | |
| Linear Decreases | ||||||
| Med Frontal Gyrus (10) | R | 4 | 66 | 0 | 5.51 | 431 |
| Mid Frontal Gyrus (10)* | R | 30 | 66 | 0 | 6.11 | 431 |
| Mid Frontal Gyrus (9)* | L | −50 | 10 | 38 | 3.13 | 238 |
| Inf Frontal Gyrus (44)* | L | −56 | 20 | 26 | 4.71 | 231 |
| Sup Temporal Gyrus (38) | R | 46 | 16 | −16 | 7.42 | 1348 |
| Sup Temporal Gyrus (38)* | L | −40 | 18 | −20 | 7.32 | 2056 |
| Inf Temporal Gyrus (20) | R | 68 | −16 | −32 | 3.79 | 269 |
| Inf Parietal Lobe (40) | L | −66 | −48 | 32 | 3.65 | 104 |
| Cuneus (18) | B | 0 | −106 | 6 | 4.33 | 132 |
| Thalamus | L | −2 | −20 | 12 | 10.90 | 5672 |
| Linear Increases | ||||||
| Sup Frontal Gyrus (11)* | R | 14 | 52 | −12 | 5.64 | 2360 |
| Mid Frontal Gyrus (10) | R | 34 | 46 | 0 | 5.75 | 2360 |
| Mid Frontal Gyrus (11) | L | −14 | 38 | 16 | 3.55 | 1579 |
| Med Frontal Gyrus (10)* | L | −16 | 52 | 2 | 6.80 | 1579 |
| Postcentral Gyrus (2) | L | −42 | −20 | 26 | 4.65 | 236 |
| Sup Temporal Gyrus (22) | L | −52 | −50 | 12 | 3.85 | 176 |
| Insula | R | 30 | −24 | 0 | 5.54 | 613 |
| Insula | L | −22 | 16 | −2 | 4.43 | 268 |
| Mid Occipital Gyrus (19)* | R | 42 | −76 | 10 | 3.61 | 303 |
| Cerebellum | R | 20 | −60 | −22 | 4.37 | 352 |
| Thalamus | L | −14 | −10 | 0 | 3.78 | 330 |
| Putamen | R | 22 | 8 | −6 | 3.48 | 224 |
| Decreases at Year 3 | ||||||
| Sup Frontal Gyrus (10) | R | 4 | 68 | 4 | 4.85 | 889 |
| Sup Frontal Gyrus (10) | R | 34 | 62 | 16 | 4.06 | 126 |
| Sup Frontal Gyrus (9) | R | 30 | 56 | 28 | 3.19 | 126 |
| Mid Frontal Gyrus (10) | R | 30 | 66 | 0 | 3.80 | 126 |
| Med Frontal Gyrus (9) | R | 4 | 46 | 14 | 3.91 | 889 |
| Inf Frontal Gyrus (47) | R | 44 | 16 | −14 | 5.47 | 1298 |
| Ant Cingulate Gyrus (32) | B | 0 | 40 | 20 | 4.15 | 889 |
| Mid Cingulate Gyrus (24) | L | −2 | −8 | 32 | 6.45 | 390 |
| Sup Temporal Gyrus (38) | L | −40 | 18 | −20 | 5.52 | 1329 |
| Mid Temporal Gyrus (21) | R | 40 | −2 | −26 | 4.24 | 1298 |
| Entorhinal Cortex (28) | L | −24 | 4 | −28 | 3.59 | 1329 |
| Thalamus | R | 2 | −12 | 12 | 8.53 | 1768 |
| Caudate | R | 10 | 14 | 2 | 5.77 | 1768 |
| Decreases at Year 5 | ||||||
| Sup Frontal Gyrus (9) | L | −6 | 56 | 32 | 5.00 | 595 |
| Sup Frontal Gyrus (10) | R | 38 | 54 | 26 | 3.72 | 131 |
| Mid Frontal Gyrus (10) | R | 30 | 60 | 6 | 4.82 | 120 |
| Mid Frontal Gyrus (9) | R | 48 | 46 | 24 | 3.59 | 120 |
| Mid Frontal Gyrus (9) | L | −50 | 8 | 36 | 3.52 | 148 |
| Med Frontal Gyrus (10) | L | −4 | 60 | 12 | 4.02 | 595 |
| Inf Frontal Gyrus (44) | L | −54 | 22 | 24 | 3.21 | 148 |
| Sup Temporal Gyrus (38) | L | −52 | 6 | −16 | 3.98 | 164 |
| Mid Temporal Gyrus (21) | R | 70 | −36 | 2 | 3.53 | 237 |
| Mid Temporal Gyrus (21) | L | −66 | −54 | −8 | 3.91 | 317 |
| Fusiform Gyrus (37) | R | 38 | −56 | −8 | 4.40 | 237 |
| Inf Temporal Gyrus (20) | L | −66 | −42 | −18 | 4.33 | 317 |
| Insula | L | −54 | 16 | 4 | 3.52 | 148 |
| Decreases at Year 7 | ||||||
| Sup Frontal Gyrus (9) | L | −22 | 54 | 30 | 5.22 | 110 |
| Supramarginal Gyrus (40) | L | −60 | −52 | 34 | 5.22 | 335 |
| Inf Parietal Lobe (40) | L | −64 | −44 | 26 | 4.38 | 335 |
| Decreases at Year 9 | ||||||
| Mid Temporal Gyrus (21) | L | −68 | −46 | 0 | 4.62 | 185 |
| Inf Temporal Gyrus (20) | L | −32 | −20 | −30 | 4.18 | 301 |
| Lingual Gyrus (19) | L | −16 | −70 | 2 | 4.06 | 541 |
| Inf Parietal Lobe (39) | L | −46 | −56 | 24 | 3.88 | 200 |
| Inf Parietal Lobe (40) | R | 66 | −38 | 34 | 3.50 | 106 |
| Inf Occipital Gyrus (19) | R | 46 | −86 | −10 | 4.78 | 261 |
| Increases at Year 3 | ||||||
| Sup Frontal Gyrus (11) | R | 16 | 54 | −12 | 4.72 | 1362 |
| Mid Frontal Gyrus (11) | R | 28 | 42 | −10 | 5.60 | 1362 |
| Med Frontal Gyrus (10) | L | −16 | 52 | 2 | 5.33 | 1141 |
| Insula | L | −30 | 2 | 14 | 3.25 | 359 |
| Insula | R | 42 | 2 | 16 | 3.46 | 113 |
| Postcentral Gyrus (43) | L | −58 | −12 | 18 | 3.34 | 359 |
| Inf Parietal Lobe (40) | L | −40 | −20 | 30 | 4.23 | 359 |
| Increases at Year 5 | ||||||
| Inf Frontal Gyrus (45) | R | 44 | 22 | 20 | 5.26 | 169 |
| Inf Frontal Gyrus (47) | R | 40 | 40 | −6 | 5.17 | 166 |
| Fusiform Gyrus (37) | R | 38 | −70 | 2 | 4.38 | 267 |
| Insula | R | 30 | 12 | 8 | 4.28 | 169 |
| Hippocampus | R | 22 | −20 | −8 | 4.77 | 150 |
| Mid Occipital Gyrus (19) | R | 46 | −72 | −2 | 5.08 | 267 |
| Cuneus (18) | B | 0 | −82 | 20 | 5.47 | 336 |
| Putamen | L | −26 | 16 | 4 | 4.44 | 211 |
| Thalamus | R | 20 | −24 | 4 | 4.28 | 150 |
| Increases at Year 7 | ||||||
| Mid Temporal Gyrus (21) | R | 58 | −42 | −12 | 4.93 | 146 |
| Mid Temporal Gyrus (22) | L | −42 | −30 | 4 | 4.38 | 114 |
| Hippocampus | L | −26 | −32 | −4 | 4.12 | 114 |
| Cerebellum | B | 0 | −30 | −22 | 3.70 | 113 |
| Thalamus | R | 16 | −20 | 4 | 5.13 | 129 |
| Increases at Year 9 | ||||||
| Orbitofrontal Gyrus (11) | L | −6 | 30 | −18 | 4.29 | 168 |
| Mid Frontal Gyrus (9) | L | −36 | 40 | 22 | 3.90 | 104 |
denotes regions exhibiting a nonorthogonal linear change driven by an incremental increase/decrease within a given year.
Figure 4. Temporal dynamics of rCBF change.

Examples of regional linear (A) and incremental step (B) decreases in rCBF over time. The changes shown here occur across all task conditions.
Verbal-specific Linear Changes
Verbal-specific changes in activity were defined as those occurring during the verbal condition alone relative to the rest and figural conditions (shown in Figure 3 middle panel and Table 3). Linear decreases in rCBF were seen in superior (Brodmann Area 9) and inferior prefrontal, superior and middle temporal regions, in the parahippocampal gyrus and in the inferior parietal lobe. Linear increases were found in superior (Brodmann Area 10), middle and medial prefrontal regions, the anterior cingulate, pre- and postcentral gyri, and the posterior cuneus.
Table 3.
Local maxima table within areas of significant yearly change in rCBF specific to verbal recognition relative to rest and figural recognition conditions. Stereotaxic coordinates are listed in Talairach space, Brodmann areas are indicated in parentheses. Spatial extent is listed in number of voxels (1 voxel=2mm3).
| Temporal Patterns: Verbal-Specific | Coordinate | Spatial Extent |
||||
|---|---|---|---|---|---|---|
| Region | Side | x | y | z | T-value | |
| Linear Decreases | ||||||
| Sup Frontal Gyrus (9)* | L | −26 | 54 | 28 | 4.74 | 142 |
| Sup Frontal Gyrus (9)* | R | 24 | 52 | 32 | 4.40 | 55 |
| Inf Frontal Gyrus (10/46) | R | 54 | 48 | 2 | 3.22 | 111 |
| Sup Temporal Gyrus (22)* | L | −62 | −32 | 20 | 3.19 | 151 |
| Sup Temporal Gyrus (22) | R | 46 | −48 | 14 | 3.87 | 160 |
| Sup Temporal Gyrus (38) | R | 46 | 14 | −26 | 3.68 | 95 |
| Mid Temporal Gyrus (21) | L | −70 | −36 | 2 | 4.54 | 105 |
| Mid Temporal Gyrus (21) | R | 44 | −52 | 6 | 3.21 | 160 |
| Mid Temporal Gyrus (21) | R | 50 | −10 | −8 | 3.56 | 58 |
| Mid Temporal Gyrus (21) | R | 40 | −8 | −28 | 3.18 | 65 |
| Parahippocampal Gyrus (30) | L | −10 | −38 | −2 | 3.09 | 68 |
| Inf Parietal lobe (39) | R | 50 | −78 | 36 | 4.49 | 125 |
| Linear Increases | ||||||
| Sup Frontal Gyrus (10) | L | −24 | 56 | −2 | 3.69 | 68 |
| Mid Frontal Gyrus (11) | R | 20 | 46 | −22 | 3.23 | 116 |
| Med Frontal Gyrus (11) | L | −14 | 38 | −16 | 3.55 | 84 |
| Ant Cingulate Gyrus (25) | R | 14 | 14 | −12 | 3.37 | 89 |
| Precentral Gyrus (4) | R | 60 | −2 | 18 | 4.41 | 278 |
| Postcentral Gyrus (2) | R | 54 | −18 | 32 | 3.28 | 278 |
| Postcentral Gyrus (43) | L | −60 | −6 | 16 | 3.20 | 50 |
| Posterior Cuneus (7) | R | 12 | −62 | 42 | 3.48 | 51 |
| Decreases at Year 3 | ||||||
| Sup Frontal Gyrus (9) | R | 24 | 50 | 36 | 3.93 | 56 |
| Mid Frontal Gyrus (10) | R | 52 | 50 | 0 | 3.43 | 122 |
| Inf Frontal Gyrus (44) | L | −60 | 18 | 10 | 3.10 | 50 |
| Sup Temporal Gyrus (22) | L | −48 | −6 | −4 | 3.78 | 95 |
| Mid Temporal Gyrus (21) | R | 48 | −8 | −10 | 3.59 | 245 |
| Inf Temporal Gyrus (20) | R | 42 | −6 | −28 | 3.67 | 245 |
| Insula | L | −36 | 26 | −2 | 3.34 | 63 |
| Lingual Gyrus (19) | R | 30 | −58 | −2 | 3.41 | 71 |
| Decreases at Year 5 | ||||||
| Sup Frontal Gyrus (10) | L | −26 | 54 | 26 | 4.01 | 118 |
| Mid Frontal Gyrus (9) | R | 30 | 38 | 38 | 3.46 | 63 |
| Sup Temporal Gyrus (22) | L | −64 | −32 | 18 | 3.37 | 144 |
| Decreases at Year 7 | ||||||
| Sup Temporal Gyrus (22) | L | −66 | −42 | 20 | 3.73 | 98 |
| Inf Parietal Lobe (40) | L | −62 | −36 | 28 | 3.22 | 98 |
| Decreases at Year 9 | ||||||
| None | ||||||
| Increases at Year 3 | ||||||
| Mid Frontal Gyrus (11) | R | 28 | 32 | −16 | 3.16 | 83 |
| Med Frontal Gyrus (10) | L | −8 | 56 | 4 | 3.64 | 87 |
| Med Frontal Gyrus (11) | R | 10 | 50 | −16 | 3.37 | 83 |
| Ant Cingulate Gyrus (24) | L | −24 | 36 | 18 | 4.09 | 128 |
| Precentral Gyrus (6) | R | 66 | 4 | 18 | 3.35 | 58 |
| Postcentral Gyrus (43) | L | −60 | −10 | 16 | 3.55 | 81 |
| Mid Temporal Gyrus (21) | L | −50 | −54 | 10 | 3.58 | 57 |
| Insula | L | −28 | 0 | 16 | 3.29 | 74 |
| Insula | R | 28 | 6 | −8 | 3.25 | 106 |
| Hippocampus | R | 30 | −28 | −4 | 4.53 | 166 |
| Mid Occipital Gyrus (19) | L | −20 | −80 | 18 | 3.36 | 72 |
| Putamen | L | −24 | 16 | 0 | 3.57 | 93 |
| Increases at Year 5 | ||||||
| none | ||||||
| Increases at Year 7 | ||||||
| Subcallosal Gyrus (25) | R | 14 | 12 | −12 | 3.62 | 55 |
| Fusiform Gyrus (37) | L | −44 | −72 | 0 | 3.58 | 78 |
| Inf Parietal Lobe (40) | R | 60 | −12 | 16 | 3.50 | 62 |
| Cuneus (19) | R | 12 | −86 | 32 | 3.11 | 53 |
| Increases at Year 9 | ||||||
| Mid Frontal Gyrus (11) | L | −32 | 48 | −16 | 3.64 | 73 |
denotes regions exhibiting a nonorthogonal linear change driven by an incremental increase/decrease within a given year.
Figural-specific Linear Changes
Figural-specific changes in activity were defined as those occurring during the figural condition alone relative to rest and verbal conditions (shown in Figure 3 right panel and Table 4). A distinctive hemispheric lateralization of increased/decreased blood flow was found during figural-specific processing. Linear decreases in rCBF were seen in inferior frontal cortex and the anterior cingulate gyrus. Decreases were also found in middle and inferior temporal cortices and in the entorhinal cortex. Additional decreases were noted in the supramarginal gyrus, thalamus and globus pallidus. These decreases all occurred in the right hemisphere with the exception of a bilateral decrease in anterior cingulate rCBF. Linear increases were observed in inferior prefrontal, and pre- and postcentral gyri. Increases also occurred in regions along the occipitotemporal pathway including striate cortex, inferior occipital and fusiform gyri, lateral temporal association cortices and the hippocampus. Increased blood flow was also found in the inferior parietal lobe. A majority of these increases occurred in the left hemisphere.
Table 4.
Local maxima table within areas of significant yearly change in rCBF specific to figural recognition relative to rest and verbal recognition conditions. Stereotaxic coordinates are listed in Talairach space, Brodmann areas are indicated in parentheses. Spatial extent is listed in number of voxels (1 voxel=2mm3).
| Temporal Patterns: Figural-Specific | Coordinate | Spatial Extent |
||||
|---|---|---|---|---|---|---|
| Region | Side | x | y | z | T-value | |
| Linear Decreases | ||||||
| Inf Frontal Gyrus (44) | R | 60 | 14 | 32 | 3.64 | 136 |
| Ant Cingulate Gyrus (25) | R | 0 | 8 | −16 | 3.12 | 82 |
| Ant Cingulate Gyrus (24)* | L | −2 | 40 | 10 | 3.12 | 78 |
| Temporal Pole (38) | R | 22 | 12 | −34 | 3.30 | 154 |
| Mid Temporal Gyrus (21)* | R | 70 | −30 | −2 | 4.04 | 194 |
| Inf Temporal Gyrus (20) | R | 64 | −20 | −22 | 3.59 | 488 |
| Entorhinal Cortex (34) | R | 18 | −4 | −20 | 3.22 | 154 |
| Supramarginal Gyrus (40) | R | 65 | −58 | 34 | 4.77 | 156 |
| Globus Pallidus | R | 10 | 0 | 2 | 4.14 | 94 |
| Thalamus | R | 22 | −18 | 16 | 3.76 | 94 |
| Putamen | R | 16 | 6 | 4 | 3.52 | 94 |
| Linear Increases | ||||||
| Inf Frontal Gyrus (46)* | L | −38 | 32 | 14 | 4.62 | 245 |
| Precentral Gyrus (6) | L | −48 | −2 | 26 | 3.42 | 67 |
| Postcentral Gyrus (4) | L | −34 | −14 | 32 | 3.44 | 97 |
| Sup Temporal Gyrus (22) | R | 44 | −26 | 2 | 3.46 | 63 |
| Mid Temporal Gyrus (21) | L | −54 | −14 | −6 | 4.09 | 134 |
| Insula | R | 32 | −4 | −2 | 3.45 | 111 |
| Hippocampus* | L | −32 | −30 | −6 | 3.24 | 51 |
| Inf Parietal Lobe (40) | L | −40 | −32 | 26 | 3.47 | 53 |
| Inf Occipital Gyrus (19) | L | −32 | −74 | −4 | 3.71 | 95 |
| Fusiform Gyrus (19) | R | 26 | −64 | −10 | 3.71 | 233 |
| Cuneus (19) | L | −4 | −84 | 28 | 4.08 | 739 |
| Striate Cortex (17) | R | 8 | −80 | 14 | 4.10 | 739 |
| Decreases at Year 3 | ||||||
| Orbitofrontal Gyrus (11) | L | −2 | 10 | −16 | 3.24 | 184 |
| Ant Cingulate Gyrus (24) | R | 8 | 34 | 22 | 4.30 | 132 |
| Ant Cingulate Gyrus (24) | L | −2 | 32 | −2 | 3.64 | 184 |
| Mid Cingulate Gyrus (24) | R | 4 | 4 | 36 | 3.09 | 63 |
| Sup Temporal Gyrus (22) | R | 54 | −12 | 10 | 3.36 | 145 |
| Mid Temporal Gyrus (21) | R | 70 | −30 | 0 | 4.00 | 539 |
| Insula | R | 44 | 4 | −8 | 4.08 | 387 |
| Entorhinal Cortex (28) | R | 26 | 2 | −22 | 3.13 | 387 |
| Inf Parietal Lobe (40) | R | 64 | −60 | 34 | 3.71 | 75 |
| Decreases at Year 5 | ||||||
| none | ||||||
| Decreases at Year 7 | ||||||
| Sup Temporal Gyrus (22) | R | 72 | −40 | 18 | 3.09 | 73 |
| Mid Temporal Gyrus (21) | L | −62 | −28 | −6 | 3.89 | 157 |
| Decreases at Year 9 | ||||||
| None | ||||||
| Increases at Year 3 | ||||||
| Inf Frontal Gyrus (46) | L | −38 | 36 | 10 | 4.88 | 264 |
| Precentral Gyrus (6) | L | −46 | −2 | 24 | 4.08 | 342 |
| Mid Temporal Gyrus (21) | L | −52 | −46 | −8 | 3.62 | 124 |
| Fusiform Gyrus (37) | L | −38 | −58 | −14 | 3.10 | 87 |
| Increases at Year 5 | ||||||
| Mid Frontal Gyrus (46) | R | 36 | 24 | 22 | 3.39 | 101 |
| Post Cingulate Gyrus (31) | R | 8 | −58 | 30 | 3.09 | 131 |
| Cuneus (19) | L | −2 | −88 | 26 | 3.70 | 529 |
| Cuneus (19) | R | 4 | −84 | 14 | 3.61 | 529 |
| Increases at Year 7 | ||||||
| Insula | R | 22 | 18 | −12 | 3.63 | 91 |
| Hippocampus | L | −34 | −34 | 2 | 3.09 | 66 |
| Increases at Year 9 | ||||||
| Orbitofrontal Gyrus (11) | R | 12 | 48 | −24 | 3.24 | 54 |
| Med Frontal Gyrus (9) | L | −20 | 46 | 18 | 3.58 | 99 |
| Mid Frontal Gyrus (10) | L | −26 | 50 | 12 | 3.19 | 99 |
denotes regions exhibiting a nonorthogonal linear change driven by an incremental increase/decrease within a given year.
Common Step Changes
To define regional changes in activity that occur at a given point in time, step function analyses were performed at Years 3, 5, 7 and 9. Step decreases in activity common to all conditions occurred within Years 3, 5, 7, and 9. In Year 3, frontal lobe decreases were seen in the medial cortex and in right hemisphere superior, middle, and inferior prefrontal regions. Both anterior and middle cingulate regions exhibited a drop in rCBF at Year 3 as did regions of the anterior temporal lobe (superior and middle regions) including the entorhinal cortex. Thalamic and caudate regions also decreased rCBF at Year 3. In Year 5, frontal lobe decreases were again noted in medial and lateral superior and middle prefrontal cortex (Figure 4). At this time point, however, more inferior portions of the medial frontal lobe decreased blood flow while the majority of lateral prefrontal decreases occurred in the left hemisphere. Temporal lobe decreases were again observed, but these decreases were predominantly seen in more posterior regions of temporal association cortex. In Year 7, fewer regions of decreased rCBF are seen. These occurred in left hemisphere superior frontal and inferior parietal regions. Year 9 rCBF decreases were found only in posterior brain areas and included regions along the occipitotemporal pathway mainly in the left hemisphere, as well as more extensive decreases in the left inferior parietal cortex than those observed at Year 7.
Step increases in rCBF common to all conditions were also seen in Years 3, 5, 7, and 9. In Year 3, bilateral superior, middle and medial prefrontal white matter regions and adjacent cortex show increased blood flow. These regions are similar to those observed in the linear analysis. Increased rCBF was also seen in the insular cortex, postcentral gyrus and inferior parietal regions. Year 5 increases were also observed in the prefrontal cortex, but these involved lower levels of the inferior prefrontal cortex. Increased blood flow was also found in the hippocampus (right hemisphere), middle occipital gyrus, cuneus, thalamus and putamen. Increases in Year 7 were observed in middle temporal association cortices and in the hippocampus (left hemisphere), the cerebellum and the thalamus. Year 9 increases were found only in orbito- and middle frontal regions of the left hemisphere. The results are shown in Figure 5 top row and Table 2.
Verbal-specific Step Changes
Verbal-specific step decreases were observed in Years 3, 5, and 7. In Year 3, prefrontal areas including Broca’s Area (BA 44) decreased blood flow. Temporal lobe decreases are also seen in the insula, lateral inferior, middle and superior temporal cortex and the lingual gyrus. Decreases in Year 5 occurred in discrete areas of superior prefrontal cortex, the frontal eye fields (BA 8), and the left superior temporal gyrus. In Year 7, only superior temporal and inferior parietal regions decreased rCBF.
Verbal-specific step increases in rCBF were seen in Years 3, 7 and 9. Year 3 increases included regions within the middle and medial prefrontal cortex, the anterior cingulate, and pre-and postcentral gyrus. Temporal lobe increases occurred within insular and middle temporal regions and right hippocampus. Increased blood flow was also observed in the middle occipital gyrus and putamen. Year 7 increases were seen in the subcallosal gyrus, fusiform gyrus, inferior parietal lobe and the cuneus. A region within the middle frontal gyrus increased rCBF in Year 9 (Figure 5 middle row; Table 3).
Figural-specific Step Changes
Figural-specific step decreases were noted in Years 3 and 7. In Year 3, orbitofrontal cortex and the anterior and middle cingulate gyrus decrease blood flow. Temporal decreases were found in the insula, superior and middle temporal gyri, and the entorhinal cortex. The inferior parietal lobe also exhibited decreased blood flow. These decreases occurred predominantly in the right hemisphere. In Year 7, bilateral regions within the superior and middle temporal cortex decreased CBF.
Figural-specific step increases in rCBF were observed in Years 3, 5, 7, and 9. In Year 3, inferior prefrontal, precentral, middle temporal and fusiform regions increased rCBF. All of these increases occurred in the left hemisphere. Year 5 increases occurred within middle frontal, posterior cingulate and cuneus areas. These increases were either bilateral or limited to the right hemisphere. In Year 7, the right insula and the left hippocampus increased blood flow, while Year 9 increases were seen in bilateral prefrontal areas (Figure 5 bottom row and Table 4).
ROI Analyses
When rCBF values were extracted from those regions that exhibit both linear and step function changes, the data show that while there are progressive trends in increasing/decreasing CBF over time, these changes are primarily driven by the step changes. The regions showing these nonorthogonal linear changes are noted in the Tables.
Task Performance and rCBF Change
Despite the decrease in reaction time from Year 1–9 during both verbal and figural task performance, controlling for reaction time and accuracy levels in the PET analyses did not affect rCBF patterns of change. Thus, the rCBF changes we observed cannot be explained by individual variations in performance levels over time.
DISCUSSION
In the accompanying paper, we demonstrated that significant changes in brain activity occur between Year 1 and Year 9 in a group of cognitively stable older individuals. Here, we report that many of the changes in activity that occur between Year 1 and 9 are the result of distinct time-dependent shifts in regional cerebral blood flow. We define patterns of change common to all scan conditions and those specific to verbal and figural recognition processing, respectively. While distinctive time-dependent changes are noted in the parietal and occipital lobes, a majority of these changes in blood flow occur in frontal and temporal lobes of the brain. Both gradual changes that occur over the entire eight year period and incremental changes in flow that occur within a two year interval are observed, often within similar regions of the cortex. The specific time-dependent and regional patterns of change, however, are largely dependent on task condition.
Two theories are often used to describe age-related changes in brain function. The functional compensation theory [9,19,31,49] attributes declining regional activity to decreases in functional integrity or efficiency that occur as the brain ages, whereas increases in activity are viewed as a form of compensatory activity. In some cases, this compensatory activity may represent a reorganization of function where new regions assume the functional role of the declining regions [14,17]. In others, the activity within new regions may represent recruitment of new or different processes that are also supportive of behavior [10,30]. The dedifferentiation theory [27,29,38] views decreases in activity as a loss of task-specific processing capabilities with age, yet also classifies increases in activity as compensatory if supportive of behavioral performance. In this theory, however, compensatory increases represent the increased involvement of non-specific or generalized functional processes. There are also other possibilities regarding increased activity in the aging brain. One possibility is that increases result from an increase in noise in the neural networks [28]. Another possibility is that relative increases in globally adjusted rCBF in some regions may reflect preservation of blood flow over time in view of age-related declines in global cerebral blood flow [25,37].
An additional consideration in longitudinal studies involving repeated testing is the potential effect of practice. Practice effects can include both the possibility of learning and changes in task strategy with time. Although the greatest effects of practice are usually observed during the encoding portion of a recognition task [24,50], changes have been observed during the recognition phase in young individuals with patterns of both increased and decreased activity related to repeated testing [23,59,60]. While there is very limited functional imaging data on the effects of practice in older adults, it has been shown that older adults demonstrate less change in brain activity related to practice than do younger individuals [33]. This finding suggests that brain activation changes in older adults most likely represent task-related reallocation of resources that allow for continued performance as opposed to changes in functional activity related specifically to practice.
With any of the proposed explanations of age-related changes in brain activity, the temporal nature of the change must be considered. With linear changes, the processes underlying the change are assumed to be gradual in nature. Gradual decreases over time in brain activity likely represent gradual declines in functional efficiency or loss of task-specific processing. Linear increases in activity suggest that the processes driving the increase become consistently more pronounced over time and may result from either generalized or task-specific mechanisms. The incremental changes, alternatively, suggest that changes in some processes occur over a relatively short period of time. In this case, decreases likely result from the breech of some functional threshold that occurs over the course of a two-year interval leading to more abrupt functional decline than that observed in regions exhibiting linear trends. Incremental increases represent a shift in activity that also occurs more suddenly than the linear changes and may reflect the onset of either generalized or task-specific processes. Task-specific compensatory mechanisms could include functional reorganization or reallocation of cortical resources, the recruitment of new task-related processes or shifts in performance strategies.
Patterns of generalized functional change
Similar linear and incremental changes are seen across the rest, verbal and figural conditions over Years 1 to 9. These findings demonstrate that there are specific time-dependent patterns of generalized changes in aging brain function common to all scan conditions. These changes are observed in frontal, temporal, occipital and parietal lobes of the brain, and because of their non-specific nature support the dedifferentiation theory of aging brain function.
In the frontal lobe, linear decreases in middle (BA 10) and inferior (BA 44) dorsolateral prefrontal cortex are seen over time which are driven by significant decreases in blood flow in Years 3 and 5. A similar pattern of linear coupled with yearly blood flow change is seen in superior prefrontal regions (BA 11) and underlying white matter. Here, a linear increase over time is noted in conjunction with a significant increase in Year 3. Together, these findings suggest that the overall pattern of change across time in prefrontal regions is influenced by early changes in blood flow with advancing age.
Generalized longitudinal changes are also observed in the temporal lobe of the brain. Most cortical regions in the anterior temporal lobe (BA 38, 20) exhibit a linear decline in activity over time. These same regions also show an incremental decline in blood flow at Year 3, similar to the pattern of change noted in the frontal lobes of the brain. Other temporal lobe patterns of change are suggestive of compensatory activity with time. For example, in the left hemisphere, the anterior superior temporal cortex (BA 38) exhibits a linear decline while posterior superior temporal cortex (BA 22) exhibits a linear increase in rCBF. In the right hemisphere, a decline is seen in the lateral portion of the fusiform gyrus while an increase in rCBF is seen in the medial portion in Year 5.
There is also evidence of altered activity in medial temporal lobe structures, yet these areas show a more staggered time-dependent pattern of change. A decrease in left-sided entorhinal activity is observed in Year 3, followed by increases in right hippocampal activity in Year 5 and left hippocampal activity in Year 7. Because the hippocampal formation, parahippocampal gyrus and entorhinal cortex are integral components of the medial temporal lobe memory system (see [15,57]), damage to these areas can cause a spectrum of memory impairments depending on the volume and pattern of tissue loss [39,46,54]. These regions also undergo structural and pathologic changes ranging from mild to moderate changes in healthy aging [20,52] to severe alterations in Alzheimer’s disease [2,7,21]. The results presented here show that the entorhinal cortex decreases blood flow with advancing age in healthy older individuals, supporting pathologic findings. Functional imaging data on hippocampal function, however, are less clear. Some studies show that older adults have less hippocampal activity than young subjects [10,13,19] while others show similar patterns of activity in the hippocampus proper [34,51] or specific subregions [56]. Our data support the latter findings of preserved hippocampal function with advancing age in cognitively and physically stable individuals.
Changes were also found in occipital and parietal cortices. While several studies have found blood flow decreases in occipital cortices in older relative to young subjects [1,11,18,32], we find that generalized decreased rCBF occurs only in the cuneus over time. Conversely, a linear increase in blood flow driven by an increase in Year 5 is seen in right-sided middle occipital cortex (BA 19). While it has been suggested that occipital function declines in older subjects independent of the type of visual task performed [10], the increase in middle occipital cortex observed here does not support this argument. On the other hand, parietal lobe function (BA 40) predominantly decreases over time, with regions exhibiting steady declines or significant decreases in Years 7 and 9. These results suggest that many generalized changes in inferior parietal lobe function develop in late life.
Together, these results demonstrate that there are widespread changes in brain function common to all task conditions, but what are the implications of the different time-dependent patterns of rCBF change? According to the dedifferentiation theory [27,29], decreases in rCBF represent regions where processing specificity is declining. Incremental decreases in blood flow, therefore, may result from a change in functional status. Incremental increases, conversely, may occur in response to the incremental decreases in processing specificity. Neural network modeling has shown that decreases in activity due to dedifferentiation can lead to an increase in activity in different or alternate information processing systems [26,27]. Because these increases are noted across all scan conditions, it is unclear whether these changes result from compensatory mechanisms, increased noise in the neural networks, non-specific increases in activity, or relative preservation of CBF in some regions in relation to greater declines in others. In addition, repeated testing over time may contribute, in part, to these generalized changes, although we believe to a lesser extent in older compared to younger individuals.
The linear changes in rCBF reported here have different implications. Linear declines in activity are likely the result of declining function perhaps due to decreases in processing specificity. Linear increases, on the other hand, offer two interpretations. A linear increase coupled with a decrease in blood flow in neighboring or homologous regions likely represents a form of compensatory activity. Singular linear increases, however, like those observed in the prefrontal white matter, may not represent compensatory activity but rather may be the result of relatively preserved blood flow in the presence of decreasing global brain blood flow or may support non-specific regional activity in the aging brain.
Modality-specific patterns of functional change
As with the generalized changes, both linear and incremental changes are seen during verbal and figural recognition. For both task conditions, changes are noted in frontal, temporal and occipital lobes of the brain. During verbal recognition, however, most time-dependent changes are noted in frontal and temporal lobes of the brain. During figural recognition, most changes are noted in temporal and occipital lobes of the brain. While patterns of regional involvement and time-dependent shifts in activity differ between the tasks, all changes noted during these recognition conditions are task-specific and therefore best support the functional compensation theory of brain aging.
Many of the changes observed during verbal recognition occur in the frontal lobes of the brain. These changes are both linear and incremental in nature, with incremental changes occurring predominantly in Years 3 and 5. Linear decreases in blood flow are seen in superior (BA 9) and inferior (BA 10) prefrontal regions, while linear increases are seen in superior (BA 10), middle and medial (BA 11) prefrontal cortex. Incremental decreases are noted in superior (BA 9/10), middle (BA 9/10) and inferior (BA 44) regions, whereas increases are noted in middle (BA 11) and medial (BA 10/11) regions.
Relative to the verbal-specific findings, few frontal lobe changes are noted during figural recognition and those that are observed occur in later years. While a linear decrease in premotor cortex is seen over time (BA 44), other changes occur within a specific year. For example, decreased activity is observed in posterior orbitofrontal cortex in Year 3 (BA 11), while increases are noted in the middle frontal gyrus in Year 5 (BA 46), and in anterior orbitofrontal (BA 11), middle (BA 10) and medial (BA 9) frontal gyri in Year 9. Taken together with the verbal results and data from other cross-sectional studies (see [8]), these findings suggest that changes in frontal lobe function occur in all cognitive modalities with age. The temporal derivatives of change and the regional specificity of change differ depending on task modality.
In contrast to the frontal lobe findings, extensive and diverse temporal lobe changes are observed over time during both verbal and figural-specific recognition. Two distinctive longitudinal results are seen during verbal recognition. First, superior (BA 22, 38) and middle (BA 21) temporal regions show a linear pattern of decline. In a cross-sectional study of word recognition, Madden, et al.[33] found that older adults had less lateral temporal cortex activity than young adults. Our findings suggest that the decreased activity in lateral temporal cortical regions continues to decline with advancing age. Second, these data also provide evidence for altered medial temporal lobe activity during verbal recognition. While the left parahippocampal gyrus steadily declines over time, the right hippocampus increases blood flow from Year 1 to Year 9 (ref paper 1 [5]) and shows an incremental increase in Year 3. Whereas the increased hippocampal activation may simply reflect increased involvement of this region in verbal recognition over time, the increased activity in this region coupled with the simultaneous decline in the contralateral parahippocampal region may represent a form of functional compensation within the medial temporal lobe network.
During figural recognition, a pronounced hemispheric lateralization of increased and decreased temporal lobe blood flow is seen. For the most part, decreases are seen in the right hemisphere and increases are seen in the left. Two examples of contralateral compensation are also observed. First, right hemisphere middle temporal regions (BA 21) linearly decrease blood flow, while left hemisphere middle temporal regions (BA 21) increase blood flow over the 8 years. Although sometimes within similar Brodmann areas, these locations differ from those observed during verbal recognition, supporting modality-specific temporal lobe changes in older adults. Second, contralateral changes are also seen in medial temporal lobe structures. The right entorhinal cortex exhibits a linear decrease in activity over time, while left-sided hippocampal region linearly increases activity over time. This hemispheric pattern of change is opposite of that observed during verbal recognition, yet the coincident decline in one medial temporal region and increase in the other may support contralateral compensation within the medial temporal network during figural recognition as well. Together with the verbal findings, these results suggest that the changes in medial temporal blood flow may support stable behavioral performance over time in older individuals who maintain good physical and cognitive health. The regional pattern of change, however, is again dependent on task condition.
Both verbal and figural-specific increases are noted in the occipital lobes of the brain over time. While the occipital changes are more pronounced in the figural condition, both tasks result in linear increases in the cuneus. This increase is in the right hemisphere during verbal recognition and in the left hemisphere during figural recognition, suggesting that regional category-dependent specificity [12,16,40,45] is maintained within visual association areas with age. With regard to the figural task, we have previously shown that figural recognition is mediated by the right occipitotemporal pathway in older adults [4]. In this study, linear increases are observed in right-sided striate and fusiform regions, yet increased blood flow is also seen in the left fusiform and cuneus regions in Years 3 and 5, respectively. These results suggest that not only is increased activity within the right hemisphere occipital cortex needed to maintain stable performance over time in older adults, but recruitment of the left hemisphere regions also occurs with advancing age possibly due to increased visual processing demands over time. The time-dependent patterns of change for the figural task also reveal that a majority of these changes occur in the early years, a finding similar to that observed in the frontal lobe during verbal recognition.
Finally, a task-dependent dichotomy in cingulate function was found. During verbal recognition, only increases are observed in the cingulate gyrus, and these are limited to the anterior cingulate region. During figural recognition, both linear and Year 3 decreases are seen in the anterior cingulate followed by an increase in posterior cingulate activity in Year 5. Several cross-sectional studies have found increased anterior cingulate activity during verbal recognition tasks in older subjects [3,11,13,32], suggesting that attentional or performance monitoring processes may be more active in older than younger subjects. Our results supplement these findings by suggesting that the processes responsible for anterior cingulate activity in older adults play an increasing role with advancing age during verbal recognition. While our results suggest that anterior attentional networks are involved in verbal recognition, the results also suggest that different processes are required to maintain figural recognition over time. The decreased anterior cingulate activity coupled with increasing posterior cingulate activity may reflect a time-dependent shift from anterior to posterior attentional networks [41] of the brain during figural recognition.
Because task performance remains stable over time in this sample, these modalityspecific results support the theory of functional compensation. Here, several examples of declining activity are coupled with contralateral increases in activity. According to the functional compensation theory [8,36], the declining activity reflects decreases in processing efficiency while increasing activity results from processes designed to compensate for the functional loss or inefficiency of the declining areas. This activity may be related to reorganization of function, recruitment of additional processing resources or changes in task strategy over time.
Conclusions
Our findings demonstrate that there are a multitude of time-dependent shifts in brain activity associated with normal aging in older individuals who remain physically and cognitively healthy. Both progressive and incremental changes occur, often within similar cortical regions. Examples of these changes are seen throughout the brain, but frontal and temporal lobes show the most varied patterns of time-dependent shifts in activity. For instance, one frontal lobe region may show a linear pattern of change while an adjacent region shows an incremental change. This finding demonstrates that similar or adjacent cortical regions do not necessarily exhibit the same time-dependent functional characteristics. These differences may be related to varying degrees of neuronal dysfunction resulting from age-related pathologic processes or to differential effects of task demands placed on adjacent regions during cognitive performance.
Many of the changes reported here also occur in the early years of the study. While the precise pattern of change is different for the different tasks, early changes in activity are seen in all lobes of the brain. This finding is likely related in some part to the uniqueness of the task in early years, as substantial changes are noted between Years 1 and 3 for all task conditions. In addition to the changes noted early on, however, considerable changes are also observed in later years. For example, frontal lobe changes are observed throughout all years during the generalized condition and a majority of frontal lobe changes occur in later years during figural-specific processing. So, while many changes appear in early years, there is also an important progression of change in later years that likely contributes to the stability of behavioral performance in our group of older subjects.
Together, these results provide insight into the temporal dynamics of brain activity change associated with aging and provide support for both the compensation-deficit and dedifferentiation theories of age-related changes in functional activity. Generalized activity changes common to all conditions likely reflect biological processes associated with healthy aging. Task-specific changes, alternatively, may reflect specialized changes in neural processes or cognitive strategies designed to circumvent the detrimental changes that occur across all modalities as a function of increasing age.
Acknowledgements
We thank the staff of the PET facility at Johns Hopkins University and the neuroimaging staff of the NIA for their assistance. This research was supported by the Intramural Research Program of the NIH, National Institute on Aging (NIA AG-93-07) and by Research and Development Contract N01-AG-3-2124.
Footnotes
Disclosure Statement: All authors confirm that there are no conflicts of interest with regard to this work.
Publisher's Disclaimer: This is a PDF file of an unedited manuscript that has been accepted for publication. As a service to our customers we are providing this early version of the manuscript. The manuscript will undergo copyediting, typesetting, and review of the resulting proof before it is published in its final citable form. Please note that during the production process errors may be discovered which could affect the content, and all legal disclaimers that apply to the journal pertain.
References
- 1.Anderson ND, Iidaka T, Cabeza R, Kapur S, McIntosh AR, Craik FI. The effects of divided attention on encoding- and retrieval-related brain activity: A PET study of younger and older adults. J Cogn Neurosci. 2000;12:775–792. doi: 10.1162/089892900562598. [DOI] [PubMed] [Google Scholar]
- 2.Arnold SE, Hyman BT, Flory J, Damasio AR, Van Hoesen GW. The topographical and neuroanatomical disrtibution of neurofibrillary tangles and neuritic plaques in the cerebral cortex of patients with Alzheimer's disease. Cerebral Cortex. 1991;1:103–116. doi: 10.1093/cercor/1.1.103. [DOI] [PubMed] [Google Scholar]
- 3.Backman L, Almkvist O, Andersson J, Nordberg A, Winblad B, Reineck R, Langstrom B. Brain activation in young and older adults during implicit and explicit retrieval. J Cogn Neurosci. 1997;9:378–391. doi: 10.1162/jocn.1997.9.3.378. [DOI] [PubMed] [Google Scholar]
- 4.Beason-Held L, Golski S, Kraut M, Esposito G, Resnick S. Brain activation during encoding and recognition of verbal and figural information in older adults. Neurobiol Aging. 2005;26:237–250. doi: 10.1016/j.neurobiolaging.2004.03.014. [DOI] [PubMed] [Google Scholar]
- 5.Beason-Held L, Kraut MA, Resnick SMI. Longitudinal Changes in Aging Brain Function. submitted. doi: 10.1016/j.neurobiolaging.2006.10.031. [DOI] [PMC free article] [PubMed] [Google Scholar]
- 6.Bouras C, Hof PR, Giannakopoulos P, Michel JP, Morrison JH. Regional distribution of neurofibrillary tangles and senile plaques in the cerebral cortex of elderly patients: a quantitative evaluation of a one-year autopsy population from a geriatric hospital. Cereb Cortex. 1994;4:138–150. doi: 10.1093/cercor/4.2.138. [DOI] [PubMed] [Google Scholar]
- 7.Braak H, Braak E. Frequency of stages of Alzheimer-related lesions in different age categories. Neurobiol Aging. 1997;18:351–357. doi: 10.1016/s0197-4580(97)00056-0. [DOI] [PubMed] [Google Scholar]
- 8.Cabeza R. Cognitive neuroscience of aging: contributions of functional neuroimaging. Scand J Psychol. 2001;42:277–286. doi: 10.1111/1467-9450.00237. [DOI] [PubMed] [Google Scholar]
- 9.Cabeza R, Anderson ND, Locantore JK, McIntosh AR. Aging gracefully: compensatory brain activity in high-performing older adults. Neuroimage. 2002;17:1394–1402. doi: 10.1006/nimg.2002.1280. [DOI] [PubMed] [Google Scholar]
- 10.Cabeza R, Daselaar SM, Dolcos F, Prince SE, Budde M, Nyberg L. Task-independent and task-specific age effects on brain activity during working memory, visual attention and episodic retrieval. Cereb Cortex. 2004;14:364–375. doi: 10.1093/cercor/bhg133. [DOI] [PubMed] [Google Scholar]
- 11.Cabeza R, Grady CL, Nyberg L, McIntosh AR, Tulving E, Kapur S, Jennings JM, Houle S, Craik FI. Age-related differences in neural activity during memory encoding and retrieval: a positron emission tomography study. J Neurosci. 1997;17:391–400. doi: 10.1523/JNEUROSCI.17-01-00391.1997. [DOI] [PMC free article] [PubMed] [Google Scholar]
- 12.Chao LL, Haxby JV, Martin A. Attribute-based neural substrates in temporal cortex for perceiving and knowing about objects. Nat Neurosci. 1999;2:913–919. doi: 10.1038/13217. [DOI] [PubMed] [Google Scholar]
- 13.Daselaar SM, Veltman DJ, Rombouts SA, Raaijmakers JG, Jonker C. Neuroanatomical correlates of episodic encoding and retrieval in young and elderly subjects. Brain. 2003;126:43–56. doi: 10.1093/brain/awg005. [DOI] [PubMed] [Google Scholar]
- 14.Della-Maggiore V, Sekuler AB, Grady CL, Bennett PJ, Sekuler R, McIntosh AR. Corticolimbic interactions associated with performance on a short-term memory task are modified by age. J Neurosci. 2000;20:8410–8416. doi: 10.1523/JNEUROSCI.20-22-08410.2000. [DOI] [PMC free article] [PubMed] [Google Scholar]
- 15.Eichenbaum H. The cognitive neuroscience of memory. New York: Oxford Univ Press; 2002. [Google Scholar]
- 16.Epstein R, Kanwisher N. A cortical representation of the local visual environment. Nature. 1998;392:598–601. doi: 10.1038/33402. [DOI] [PubMed] [Google Scholar]
- 17.Grady CL, Bernstein LJ, Beig S, Siegenthaler AL. The effects of encoding task on age-related differences in the functional neuroanatomy of face memory. Psychol Aging. 2002;17:7–23. doi: 10.1037//0882-7974.17.1.7. [DOI] [PubMed] [Google Scholar]
- 18.Grady CL, Maisog JM, Horwitz B, Ungerleider LG, Mentis MJ, Salerno JA, Pietrini P, Wagner E, Haxby JV. Age-related changes in cortical blood flow activation during visual processing of faces and location. J. Neurosci. 1994;14:1450–1462. doi: 10.1523/JNEUROSCI.14-03-01450.1994. [DOI] [PMC free article] [PubMed] [Google Scholar]
- 19.Grady CL, McIntosh AR, Rajah MN, Beig S, Craik FI. The effects of age on the neural correlates of episodic encoding. Cereb Cortex. 1999;9:805–814. doi: 10.1093/cercor/9.8.805. [DOI] [PubMed] [Google Scholar]
- 20.Hof P, Giannakopoulos P, Bouras C. The neuropathological changes associated with normal brain aging. Histol Histopathol. 1996;11:1075–1088. [PubMed] [Google Scholar]
- 21.Hyman BT, Van Hoeson GW, Damasio AR. Memory-related neural systems in Alzheimer's disease. An anatomic study. Neurol. 1990;40:1721–1730. doi: 10.1212/wnl.40.11.1721. [DOI] [PubMed] [Google Scholar]
- 22.Kawas C, Gray S, Brookmeyer R, Fozard J, Zonderman A. Age-specific incidence rates of Alzheimer's disease: the Baltimore Longitudinal Study of Aging. Neurology. 2000;54:2072–2077. doi: 10.1212/wnl.54.11.2072. [DOI] [PubMed] [Google Scholar]
- 23.Kirschen MP, Chen SH, Schraedley-Desmond P, Desmond JE. Load- and practice dependent increases in cerebro-cerebellar activation in verbal working memory: an fMRI study. Neuroimage. 2005;24:462–472. doi: 10.1016/j.neuroimage.2004.08.036. [DOI] [PubMed] [Google Scholar]
- 24.Landau SM, Schumacher EH, Garavan H, Druzgal TJ, D'Esposito M. A functional MRI study of the influence of practice on component processes of working memory. Neuroimage. 2004;22:211–221. doi: 10.1016/j.neuroimage.2004.01.003. [DOI] [PubMed] [Google Scholar]
- 25.Leenders KL, Perani D, Lammertsma A, Heather JD, Buckingham P, Helay MJR, Gibbs JM, Wise RJS, Hatazawa J, Herold S, Beany RP, Brooks DJ, Spinks T, Rhodes C, Frackowiak RSJ, Jones T. Cerebral blood flow, blood volume, and oxygen utilization. Normal values and the effect of age. Brain. 1990;113:27–47. doi: 10.1093/brain/113.1.27. [DOI] [PubMed] [Google Scholar]
- 26.Li SC, Brehmer Y, Shing YL, Werkle-Bergner M, Lindenberger U. Neuromodulation of associative and organizational plasticity across the life span: Empirical evidence and neurocomputational modeling. Neurosci Biobehav Rev. 2006;30:775–790. doi: 10.1016/j.neubiorev.2006.06.004. [DOI] [PubMed] [Google Scholar]
- 27.Li SC, Lindenberger U, Sikstrom S. Aging cognition: from neuromodulation to representation. Trends Cogn Sci. 2001;5:479–486. doi: 10.1016/s1364-6613(00)01769-1. [DOI] [PubMed] [Google Scholar]
- 28.Li SC, Sikstrom S. Integrative neurocomputational perspectives on cognitive aging, neuromodulation, and representation. Neurosci Biobehav Rev. 2002;26:795–808. doi: 10.1016/s0149-7634(02)00066-0. [DOI] [PubMed] [Google Scholar]
- 29.Lindenberger U, Scherer H, Baltes PB. The strong connection between sensory and cognitive performance in old age: not due to sensory acuity reductions operating during cognitive assessment. Psychol Aging. 2001;16:196–205. doi: 10.1037//0882-7974.16.2.196. [DOI] [PubMed] [Google Scholar]
- 30.Logan JM, Sanders AL, Snyder AZ, Morris JC, Buckner RL. Under-recruitment and nonselective recruitment: dissociable neural mechanisms associated with aging. Neuron. 2002;33:827–840. doi: 10.1016/s0896-6273(02)00612-8. [DOI] [PubMed] [Google Scholar]
- 31.Madden DJ, Gottlob LR, Allen PA. Adult age differences in visual search accuracy: attentional guidance and target detectability. Psychol Aging. 1999;14:683–694. doi: 10.1037//0882-7974.14.4.683. [DOI] [PubMed] [Google Scholar]
- 32.Madden DJ, Turkington TG, Coleman RE, Provenzale JM, DeGrado TR, Hoffman JM. Adult age differences in regional cerebral blood flow during visual world identification: evidence from H215O PET. Neuroimage. 1996;3:127–142. doi: 10.1006/nimg.1996.0015. [DOI] [PubMed] [Google Scholar]
- 33.Madden DJ, Turkington TG, Provenzale JM, Denny LL, Hawk TC, Gottlob LR, Coleman RE. Adult age differences in the functional neuroanatomy of verbal recognition memory. Hum Brain Mapp. 1999;7:115–135. doi: 10.1002/(SICI)1097-0193(1999)7:2<115::AID-HBM5>3.0.CO;2-N. [DOI] [PMC free article] [PubMed] [Google Scholar]
- 34.Morcom AM, Good CD, Frackowiak RS, Rugg MD. Age effects on the neural correlates of successful memory encoding. Brain. 2003;126:213–229. doi: 10.1093/brain/awg020. [DOI] [PubMed] [Google Scholar]
- 35.Morris JC. The challenge of characterizing normal brain aging in relation to Alzheimer's disease. Neurobiol Aging. 1997;18:388–389. doi: 10.1016/s0197-4580(97)00055-9. discussion 389–392. [DOI] [PubMed] [Google Scholar]
- 36.Nyberg L, Backman L. Cognitive aging: a view from brain imaging. In: Dixon R, Backman L, Nilsson L-G, Dixon R, Backman L, Nilsson L-Gs, editors. New frontiers in cognitive aging. New York: Oxford Press; 2004. pp. 135–159. [Google Scholar]
- 37.Pantano P, Baron J-C, Lebrun-Grandie P, Duquesnoy N, Bousser M-G, Comar M. Regional cerebral blood flow and oxygen consumption in human aging. Stroke. 1984;15:635–641. doi: 10.1161/01.str.15.4.635. [DOI] [PubMed] [Google Scholar]
- 38.Persson J, Nyberg L, Lind J, Larsson A, Nilsson LG, Ingvar M, Buckner RL. Structure-Function Correlates of Cognitive Decline in Aging. Cereb Cortex. 2005 doi: 10.1093/cercor/bhj036. [DOI] [PubMed] [Google Scholar]
- 39.Pigott S, Milner B. Memory for different aspects of complex visual scenes after unilateral. Neuropsychol. 1993;31:1–15. doi: 10.1016/0028-3932(93)90076-c. [DOI] [PubMed] [Google Scholar]
- 40.Polk TA, Farah MJ. The neural development and organization of letter recognition: evidence from functional neuroimaging, computational modeling, and behavioral studies. Proc Natl Acad Sci U S A. 1998;95:847–852. doi: 10.1073/pnas.95.3.847. [DOI] [PMC free article] [PubMed] [Google Scholar]
- 41.Posner MI, Dehaene S. Attentional networks. TINS. 1994;17:75–79. doi: 10.1016/0166-2236(94)90078-7. [DOI] [PubMed] [Google Scholar]
- 42.Powers RE. Neurobiology of aging. In: Coffey C, Cummings J, Coffey C, Cummings Js, editors. Textbook of Geriatric Neuropsychiatry. Washington, DC: The American Psychiatric Press; 1994. pp. 35–70. [Google Scholar]
- 43.Price JL. The relationship between tangle and plaque formation during healthy aging and mild dementia. Neurobiol Aging. 1993;14:661–663. doi: 10.1016/0197-4580(93)90062-g. [DOI] [PubMed] [Google Scholar]
- 44.Price JL, Davis PB, Morris JC, White DL. The distribution of tangles, plaques and related immunohistochemical markers in healthy aging and Alzheimer's disease. Neurobiol Aging. 1991;12:295–312. doi: 10.1016/0197-4580(91)90006-6. [DOI] [PubMed] [Google Scholar]
- 45.Puce A, Allison T, Asgari M, Gore JC, McCarthy G. Differential sensitivity of human visual cortex to faces, letterstrings and textures: a functional magnetic resonance study. J. Neurosci. 1996;16:5205–5215. doi: 10.1523/JNEUROSCI.16-16-05205.1996. [DOI] [PMC free article] [PubMed] [Google Scholar]
- 46.Rempel-Clower NL, Zola SM, Squire LR, Amaral DG. Three cases of enduring memory impairment after bilateral damage limited to the hippocampal formation. J. Neuroscience. 1996;16:5233–5255. doi: 10.1523/JNEUROSCI.16-16-05233.1996. [DOI] [PMC free article] [PubMed] [Google Scholar]
- 47.Resnick SM, Goldszal AF, Davatzikos C, Golski S, Kraut MA, Metter EJ, Bryan RN, Zonderman AB. One-year age changes in MRI brain volumes in older adults. Cereb Cortex. 2000;10:464–472. doi: 10.1093/cercor/10.5.464. [DOI] [PubMed] [Google Scholar]
- 48.Resnick SM, Maki PM, Golski S, Kraut MA, Zonderman AB. Effects of estrogen replacement therapy on PET cerebral blood flow and neuropsychological performance. Horm Behav. 1998;34:171–182. doi: 10.1006/hbeh.1998.1476. [DOI] [PubMed] [Google Scholar]
- 49.Reuter-Lorenz P, Jonides J, Smith E, Hartley A, Miller A, Marshuetz C, Koeppe R. Age differences in the frontal lateralization of verbal and spatial working memory revealed by PET. J Cogn Neurosci. 2000;12:174–187. doi: 10.1162/089892900561814. [DOI] [PubMed] [Google Scholar]
- 50.Sayala S, Sala JB, Courtney SM. Increased Neural Efficiency with Repeated Performance of a Working Memory Task is Information-type Dependent. Cereb Cortex. 2005 doi: 10.1093/cercor/bhj007. [DOI] [PubMed] [Google Scholar]
- 51.Schacter DL, Savage CR, Alpert NM, Rauch SL, Albert MS. The role of the hippocampus and frontal cortex in age-related memory changes: a PET study. NeuroReport. 1996;7:1165–1169. doi: 10.1097/00001756-199604260-00014. [DOI] [PubMed] [Google Scholar]
- 52.Scheibel A. Handbook on the Psychology of Aging. Fourth Edition. Academic Press, Inc.; 1996. Structural and functional changes in the aging brain. [Google Scholar]
- 53.Schochet SS. Neuropathology of Aging. Neurol Clin. 1988;16:569–580. doi: 10.1016/s0733-8619(05)70081-5. [DOI] [PubMed] [Google Scholar]
- 54.Scoville WB, Milner B. Loss of recent memory after bilateral hippocampal lesions. J. Neurol. Psychiat. 1957;20:11–21. doi: 10.1136/jnnp.20.1.11. [DOI] [PMC free article] [PubMed] [Google Scholar]
- 55.Shock NW, Greulich RC, Andres R, Arenberg D, Costa PT, Jr, Lakatta E, Tobin JD. Normal human aging: the Baltimore Longitudinal Study of Aging. Washington, D.C.: U.S. Government Printing Office; 1984. [Google Scholar]
- 56.Small SA, Tsai WY, DeLaPaz R, Mayeux R, Stern Y. Imaging hippocampal function across the human life span: is memory decline normal or not? Ann Neurol. 2002;51:290–295. doi: 10.1002/ana.10105. [DOI] [PubMed] [Google Scholar]
- 57.Squire LR, Stark CE, Clark RE. The medial temporal lobe. Annu Rev Neurosci. 2004;27:279–306. doi: 10.1146/annurev.neuro.27.070203.144130. [DOI] [PubMed] [Google Scholar]
- 58.Talairach J, Tournoux P. Co-planar stereotaxic atlas of the human brain. New York: Thieme Medical Publishers, Inc.; 1988. [Google Scholar]
- 59.Tomasi D, Ernst T, Caparelli EC, Chang L. Practice-induced changes of brain function during visual attention: a parametric fMRI study at 4 Tesla. Neuroimage. 2004;23:1414–1421. doi: 10.1016/j.neuroimage.2004.07.065. [DOI] [PubMed] [Google Scholar]
- 60.van Turennout M, Bielamowicz L, Martin A. Modulation of neural activity during object naming: effects of time and practice. Cereb Cortex. 2003;13:381–391. doi: 10.1093/cercor/13.4.381. [DOI] [PubMed] [Google Scholar]