Abstract
An important question in protein folding is whether molten globule states formed under equilibrium conditions are good structural models for kinetic folding intermediates. The structures of the kinetic and equilibrium intermediates in the folding of the plant globin apoleghemoglobin have been compared at high resolution by quench-flow pH-pulse labeling and interrupted H/D exchange analyzed in DMSO solvent. Unlike its well-studied homolog, apomyoglobin, where the equilibrium and kinetic intermediates are quite similar, there are striking structural differences between the intermediates formed by apoleghemoglobin. In the kinetic intermediate, formed during the burst phase of the quench flow experiment, protected amides and helical structure are found mainly in the regions corresponding to the G and H helices of the folded protein, and in parts of the E helix and CE loop regions, whereas in the equilibrium intermediate, amide protection and helical structure are seen in parts of the A and B helix regions, as well as in the G and H regions, and the E helix remains largely unfolded. These results suggest that the structure of the molten globule intermediate of apoleghemoglobin is more plastic than that of apomyoglobin, so that it is readily transformed depending on the solution conditions, particularly pH. Thus, in the case of apoleghemoglobin at least, the equilibrium molten globule formed under destabilizing conditions at acid pH is not a good model for the compact intermediate formed during kinetic refolding experiments. Our high-precision kinetic analysis also reveals an additional slow phase during the folding of apoleghemoglobin, which is not observed for apomyoglobin. Hydrogen exchange pulse labeling experiments show that the slow folding phase is associated with residues in the C-E loop, which probably forms non-native structure in the intermediate that must be resolved before folding can proceed to completion.
Keywords: leghemoglobin, myoglobin, protein folding, folding intermediates, quench flow
Introduction
The globin family represents an excellent experimental system for investigation of protein folding mechanisms. Globins are found in a broad range of phyla, including bacteria, plants, and mammals. Globin sequences are highly variable and very few residues are uniformly conserved in all sequences.1 Nevertheless, the helical globin fold is conserved to a remarkable degree even between proteins with widely differing amino acid sequences. Given the wide variability in sequence within a conserved tertiary fold, the globin family is ideal for studying the evolutionary conservation of folding pathways. With this in mind, we have previously reported on the kinetic folding pathway of the apo form of leghemoglobin (Lb), a monomeric hemoglobin located in the root nodules of nitrogen fixing leguminous plants.2,3 Like apomyoglobin,4 apoleghemoglobin (apoLb) folds via an on-pathway burst-phase intermediate, but the kinetic intermediates for the two proteins show distinctive structural differences that can be directly correlated with the differences in their amino acid sequences.5
Previous studies on apoLb folding used the quench-flow method, which allows kinetic folding information to be obtained using amide proton exchange, detected by NMR6,7 or mass spectrometry.8,9 As initially described, this method suffers from the limitation that the only amide probes that are capable of reporting on the folding events are those that are slowly-exchanging in the native folded state of the protein. We have recently described a variant of this method, where the final steps of the quench-flow experiment are conducted in the solvent dimethylsulfoxide (DMSO),10 allowing information to be obtained by NMR on the rates of folding at a significantly greater number of amide probes. Here we describe the application of this method to obtain a much higher-resolution picture of the kinetic folding intermediate of apoleghemoglobin than was available from the previous study.5 In addition, we use interrupted hydrogen-deuterium exchange10,11 in DMSO to characterize the structure of the equilibrium molten globule intermediate formed by apoLb at pH ~4.
Molten globule intermediates are formed by many proteins under mildly denaturing conditions and are generally regarded as equilibrium models of kinetic folding intermediates.12–14 Indeed, close structural similarity has been established between the equilibrium molten globules and burst-phase kinetic intermediates formed by α-lactalbumin, apomyoglobin, ribonuclease H, and β-lactoglobulin.4,15–17 In the present work we show that apoleghemoglobin is an exception to this correlation, in that the molten globule structure is plastic and the equilibrium and kinetic intermediates differ significantly in structure.
Results
Native structure of apoLb
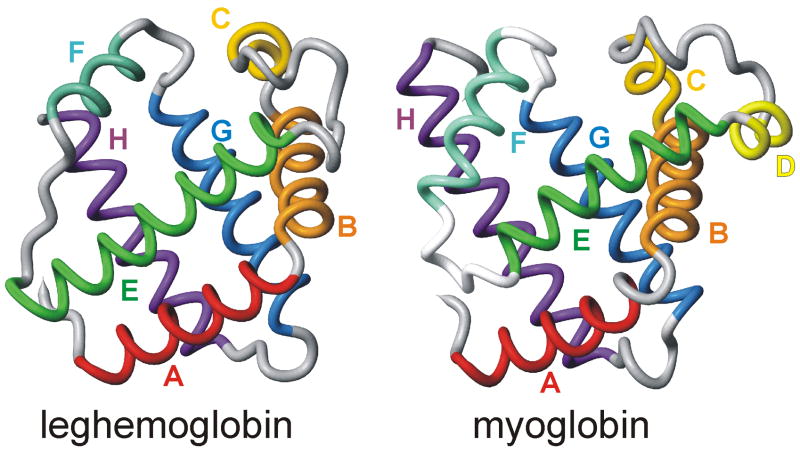
Crystal structures have been published for lupin and soybean leghemoglobins,18,19 but there is no direct information about the native structure of apoleghemoglobin. The crystal structures of the heme-containing holoproteins reveal the presence of 7 helices instead of the 8 usually found in the globins; the short D helix of Mb is absent from Lb (Figure 1). Interrupted H/D exchange in DMSO provides important information on the folded state of apoLb in solution, as it has for apoMb.10 A high level of protection is observed in regions corresponding to the helical regions in the crystal structure, particularly in the center of the A, B, E, G, and H helices (Figure 2), although the protection factors are greatly decreased from those of hololeghemoglobin.20 In addition, the C-helix, CE and EF loops, and the N-terminal parts of the E and G helices show moderate protection in the apoprotein at pH 6. The lowest levels of protection are observed in the N-terminal part of the A-helix and the FG-loop. These observations indicate that apoLb is stable in solution and retains much of the helical structure seen in the X-ray structures of the holoprotein. This is confirmed by circular dichroism data which indicate that apoleghemoglobin retains about 85% of the helical structure of the holoprotein 21.
Figure 1. Backbone representations of Leghemoglobin and Myoglobin.
The Lb structure was derived from the soybean nicotinate structure19 (PDB id 1FSL) and the Mb structure is the CO complex44 (PDB id 1MBC).
Figure 2. Interrupted H/D exchange studies for the native state of apoLb at pH 6.0.
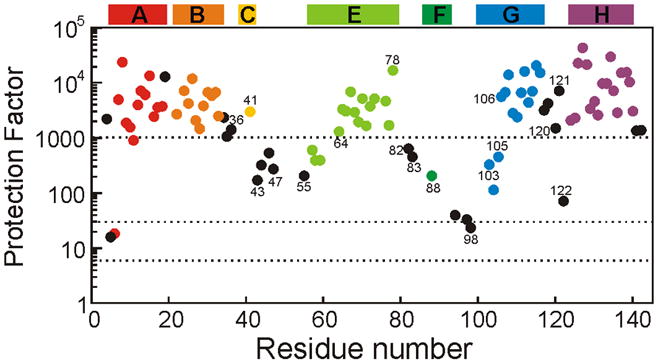
Data points are color coded according to the published helical structure of the holoprotein,19 as indicated by the colored bars at the top of the figure. Black data points are for turn and loop residues. Horizontal dotted lines are placed at protection factors of 6, 30 and 1000.
High-Resolution Structural Information on the Kinetic Intermediate of apoLb
In our previous D2O-based quench flow experiments on apoleghemoglobin, the fast mixing (tfold) and quench (tquench) steps were followed by addition of heme to form the holoprotein, in order to minimize H/D exchange in pulse labeled samples prepared for NMR and mass spectrometry.5 Using this method, kinetic folding information was obtained for a total of 55 amide proton probes, out of a total of 143 amino acids in the sequence of Lb.5 In the present work, where we use DMSO as the NMR solvent after lyophilization of the pH-pulse labeled protein,10 the number of probes is increased to 89.
Information about the proton occupancy of the amides in the kinetic folding intermediate is obtained from the quench-flow data (measured in D2O) at the shortest folding time available with the quench-flow instrument (tfold = 6.4 ms). Because the stability of the intermediate, and the continued stability of the amide protons that are protected in the burst phase of folding, depends on the conditions used in the high-pH quench pulse, we perform a series of experiments, with differing duration of the high-pH pulse (tquench = 12, 20, 35, 65, 95 ms), and use these data to extrapolate to tquench =0 to estimate the proton occupancy at zero pulse duration. We term this quantity A0.22
The A0 values obtained for the kinetic (burst phase) apoLb intermediate are plotted versus residue number in Figure 3a. Also shown in Figure 3a is a plot of the “average area buried upon folding” (AABUF)23 for Lb. This quantity, a modified hydrophobicity parameter that takes into account the hydrophobic nature of many long “hydrophilic” side chains,24 appears to be an excellent predictor of regions of apomyoglobin that are folded most rapidly.25 This relationship also appears to hold for apoleghemoglobin: those regions of the amino acid sequence that correspond to peaks in the AABUF are also the locations of highest proton occupancy in the burst phase intermediate. Most of the residues in the G and H helix regions are protected in the burst phase intermediate; protection decreases towards the termini of the helical regions, consistent with end-fraying of the helices. On the other hand, only the central region of the E-helix is highly protected in the burst phase. The greatest protection is observed for the amides of Phe66, Leu68, and Val69. In the folded protein, these residues form part of the hydrophobic face of the amphipathic E helix, and are located precisely at the interface between the E helix and the G and H helices (Figure 3b). The remaining residues in the central region of the E-helix, including K64, L65, A67, R70, and D71, are also significantly protected, but to a lesser extent. We infer that the amides that are protected in the burst phase intermediate are located in regions of helical structure; stopped flow CD measurements (ref. 5 and Fig. 7) show that the kinetic intermediate contains 60% of the helical structure of the native apoLb.
Figure 3. Kinetic Burst Phase Intermediate of apoLb Folding.
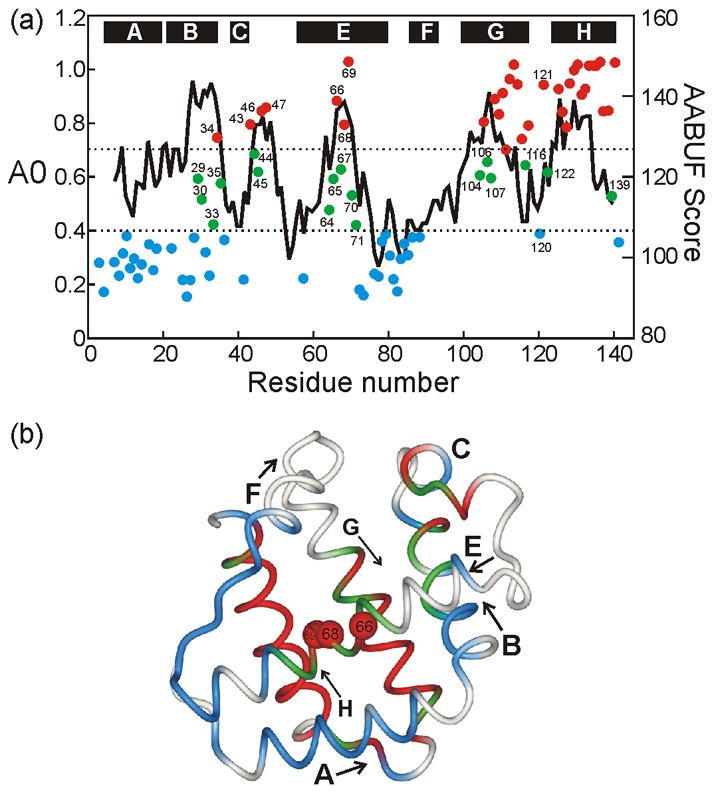
(a) Colored points (left axis) show A0 values (proton occupancy in the kinetic burst phase of folding, corrected for the effects of high-pH pulse duration22) for apoLb, plotted against residue number. The continuous black line shows the per-residue average area buried upon folding (AABUF),23 calculated as a continuous running average of 9 residues. Horizontal lines are plotted at A0 values of 0.4 and 0.7. Where A0 > 0.7 (red points), the amide proton is considered to be completely protected within the dead time of the quench flow apparatus (6.4 ms) (termed fast-folding or F). Where A0< 0.4, the amide proton is considered to be protected only in the slow, or visible, phase of folding (termed slow folding or S). Green points (0.4 < A0 < 0.7) indicate intermediate behavior, where some members of the ensemble are protected early and some at a later time (termed F+S). The locations of helices in the folded holoprotein19 are indicated with black bars at the top of the graph. (b) Backbone representation of soybean Lb,19 with amide proton protection (F, F+S, S) plotted according to the colored points of Figure 3a. Helices are labeled; arrows designate the direction N→C. Red spheres indicate the three amides in the center of the E helix that are most highly protected from exchange in the burst phase intermediate.
Figure 7.
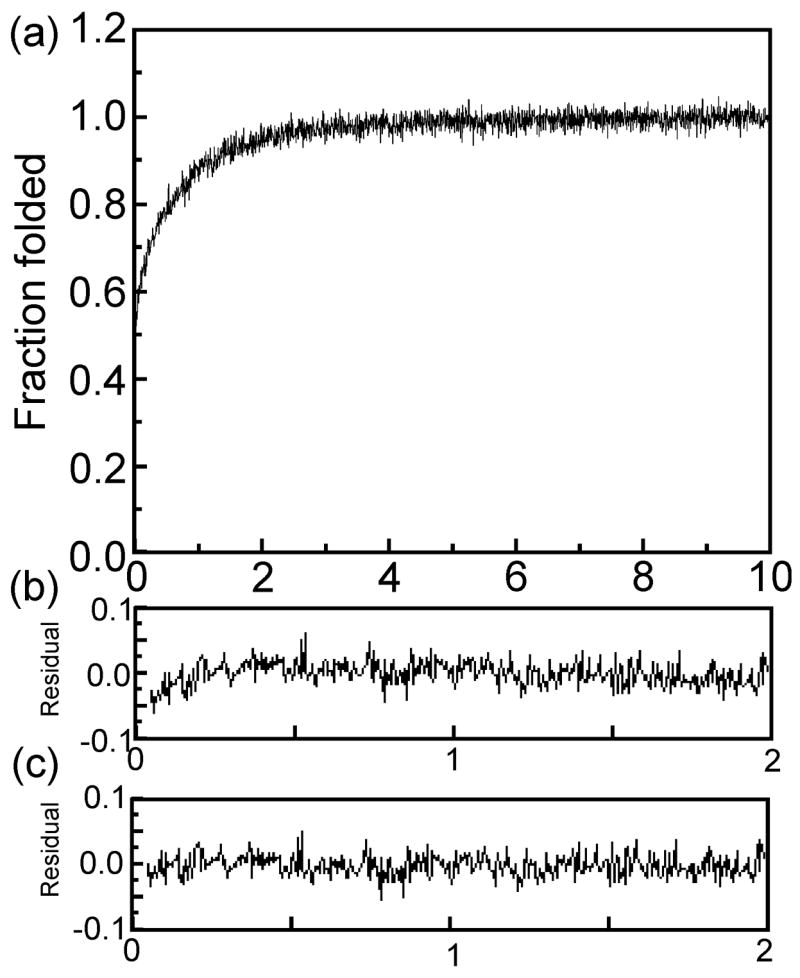
(a) Stopped flow-pH-jump time course for soybean apoLb, normalized to an amplitude of 1.0. (b, c) residuals for fitting with (b) a single exponential and (c) two exponential functions. The burst phase amplitude is 0.6, the single exponential amplitude is 0.4, with a rate constant of 1.11 s−1. For the double exponential fit, the faster phase is fit with amplitude 0.25 and a rate constant of 2.04 s−1, and the slower phase with an amplitude of 0.15 and rate constant of 0.64 s−1.
Due to the paucity of probes in many parts of the Lb sequence, only a partial view of the kinetic intermediate structure was obtained in the previous quench-flow studies on apoLb;5 the only residues that were protected significantly from exchange were located in the central regions of the E and H helices and in the C-terminal region of helix G. Using the DMSO detection method, we now see that additional regions of the protein are also significantly protected in the earliest kinetic steps. The loop between the C and E helices (there is no D-helix in Lb) is highly protected in the kinetic intermediate; the amides at Leu43, Phe46 and Leu47 are among the highest-protected at 6.4 ms folding time, consistent with a maximum at this position in the AABUF plot. The C-terminal end of the B-helix, the N-terminal end of the G helix and the loop between helices G and H are also partly protected, with A0 values around 0.4–0.7. As inferred previously from quench flow NMR and mass spectrometry measurements 5, such behavior indicates heterogeneity in the kinetic intermediate; for a significant population of molecules in the ensemble, folding progresses far enough in the burst phase to protect amide protons in these regions from exchange, while other molecules remain more highly unfolded and the amides remain unprotected. The G–H turn region shows the influence of specific sequence elements on the protection of amides in the burst phase of folding: the Trp121 amide is highly protected, whereas its nearest neighbors Lys120 and Ser122 are only partially protected. Our experiments are also able to identify many more residues that are unprotected in the intermediate but fold later on a slower time scale (see below). These residues are located in the A-helix and in the C-terminal part of the E-helix and the E–F loop. Amide proton protection data are not available, even using the DMSO method, for residues 50–60 and 90–100, because of low signal/noise ratio or cross peak overlap.
Equilibrium intermediate at low pH
Interrupted H/D exchange measured in DMSO solvent10 was also applied to study the equilibrium intermediate of apoLb. Circular dichroism and fluorescence spectra recorded as a function of pH show that the equilibrium intermediate is maximally populated at pH 3.7.5 The interrupted H/D exchange experiment was performed by diluting identical samples of apoLb at pH 3.7 with D2O at 4°C and allowing exchange to occur for various time periods. Exchange was quenched with trifluoroacetic acid and the samples were frozen and lyophilized, and subsequently dissolved in DMSO for NMR measurements. A total of 102 amide probes were observable. Protection factors calculated using intrinsic H/D exchange rates26 are shown in Figure 4a and mapped onto the X-ray structure of the holoprotein in Figure 4b. For the equilibrium intermediate (pH 3.7), the highest protection factors are observed in the H helix (all above 30 except for the extreme C-terminus, which has intermediate protection factors in the 6–30 range). The G helix also has a majority of protection factors above 30. The A, B and C helices and the C-E loop have mainly intermediate protection factors, while the E and F helices generally show protection factor less than 6.
Figure 4. Equilibrium Intermediate (pH 3.7) from Interrupted H/D Exchange.
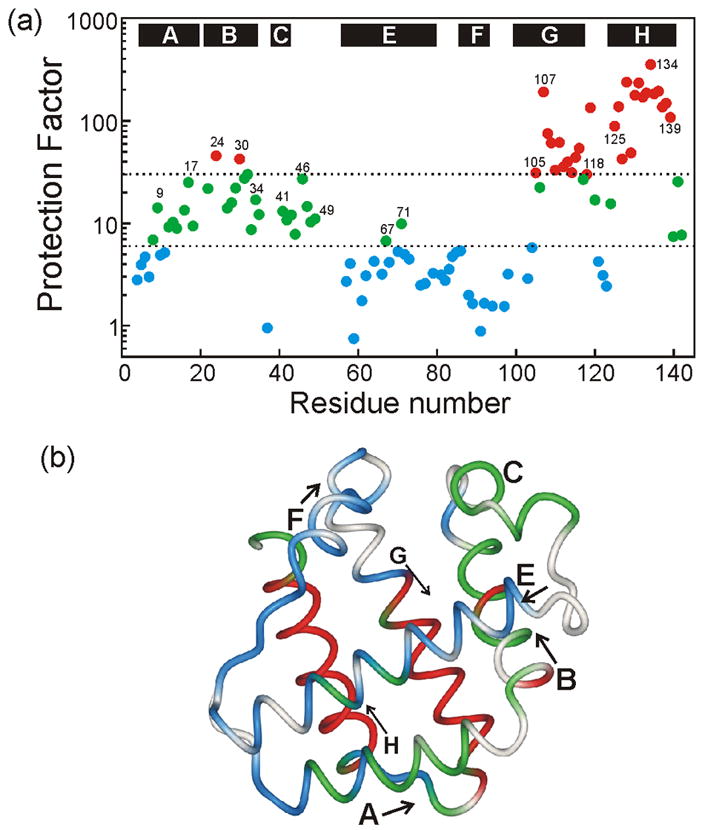
(a) Colored points show protection factors for amide proton exchange as a function of residue number: blue, PF < 6; green, 6 < PF < 30; red, PF > 30. Horizontal dotted lines are placed at protection factors of 6 and 30. (b) Backbone representation of soybean Lb,19 with protection factors plotted according to the colored points of Figure 4a. Helices are labeled; arrows designate the direction N→C.
Comparison of the Equilibrium and Kinetic Folding Intermediates of Lb
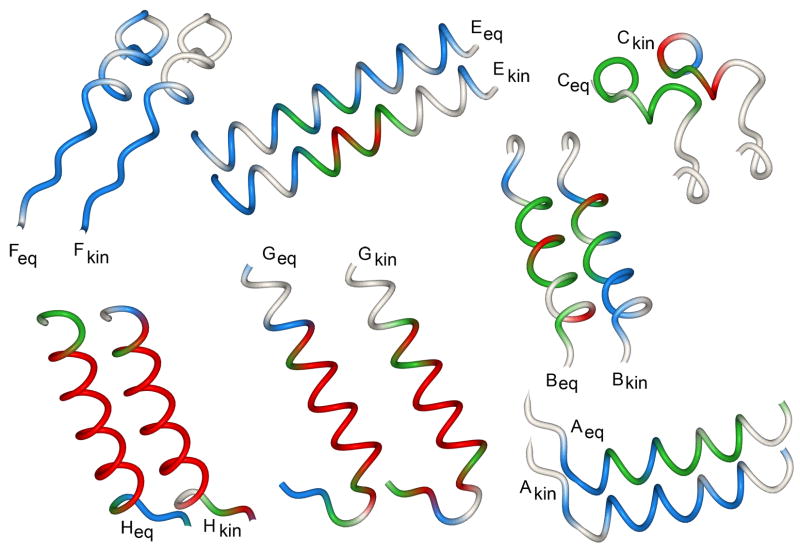
The interrupted H/D exchange experiments followed by NMR data collection in DMSO give sufficient information to allow detailed comparison of the structures of the equilibrium and kinetic intermediates. The amide exchange protection is illustrated for each region of the protein in Figure 5. The protection observed in the B, F, G, and H helices is quite similar in the equilibrium and kinetic intermediates, but for the A, C and E helices there are major differences. Amide protons in the E helix region are only weakly protected from exchange in the equilibrium molten globule, but many are strongly protected in the kinetic burst phase intermediate. By contrast, the C-terminal half of the A-helix shows a significant increase in protection in the equilibrium intermediate (green points in Figure 4a, green backbone in Figure 4b and 5), whereas the A0 values observed for the kinetic intermediate are uniformly small (blue points in Figure 3a, blue backbone in Figure 3b and 5). Amides in the C–E loop are generally less well protected in the equilibrium intermediate than in the kinetic intermediate.
Figure 5. Comparison of Equilibrium and Kinetic intermediates of apoLb.
For each segment of the polypeptide chain, the amide proton protection factors (for the equilibrium intermediate; Figure 4) and the A0 values (for the kinetic intermediate, Figure 3) are plotted onto the backbone structure, color coded according to the corresponding values in Figures 3 and 4. Each segment is labeled at its N-terminus.
Time course of formation of helical structure in the native state
pH-pulse labeling was also employed at a variety of folding times (tfold = 6.4, 37, 74, 104, 250, 350, 550 ms and 1, 2, 3, 4, 6 and 8 sec) to monitor the time course of amide protection as the protein folds from the intermediate to the native state. Plots of proton occupancy as a function of tfold are shown for each of the helices and loops in Figure 6a, with data points for amides that show an increase in protection fitted in all cases with a single exponential function. Interestingly, slower rate constants are observed for some groups of residues, illustrated in Figure 6b. The faster rate constants are ~ 2–3 s−1, whereas the slower ones are ~ 0.5 s−1. The amides that report on the slow folding process are located in the CE loop, the middle of the E helix and at the ends of several of the helices. Such biphasic folding behavior is not observed for apomyoglobin (apoMb), for which all of the observed rate constants are around 3.5 s−1 for pH-jump experiments (unpublished data) or 2.8 s−1 for urea-jump experiments.27 Stopped-flow pH-jump CD folding studies on apoLb (Figure 7) show that a double-exponential fit (rate constants 2.0 and 0.6 s−1) gives better residuals than a single exponential fit (1.1 s−1). These values are consistent with those obtained from a stopped-flow urea-jump experiment on apoLb (rate constants 3.1 and 0.93 s−1 for the double exponential fit and 1.3 s−1 for the single-exponential).5 The groups of amides that show the slower phase are broadly distributed throughout the molecule, with little contact between them in the native-state X-ray structure (Figure 8).
Figure 6. Time Course of apoLb Folding.
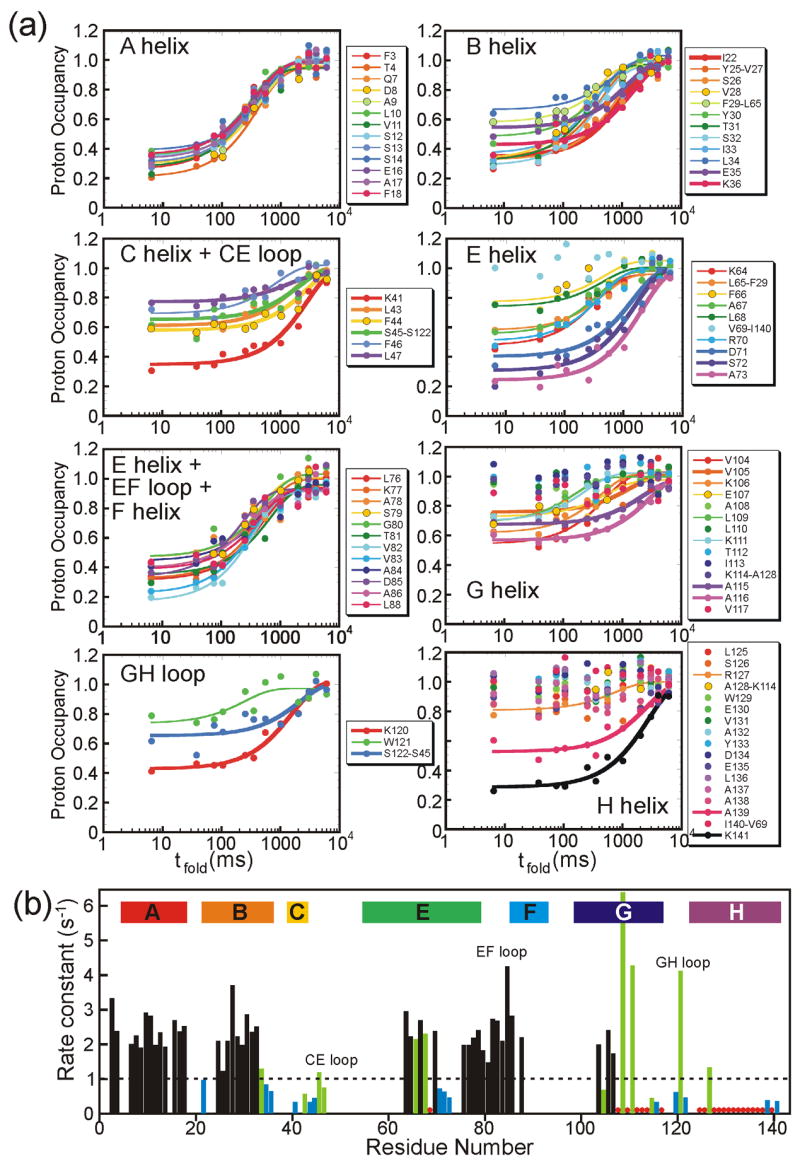
(a) Transitions of proton occupancy for the designated regions of the apoLb amino acid sequence, as a function of the folding time tfold. Curves were fitted using published methods31 only to those data sets with proton occupancy less than 0.8 at 6.4 ms. The majority of curves (shown with thinner lines) have rate constant k ~ 2–3 s−1. Measurably slower folding rates (k < 1 s−1) are designated with thicker lines. Curves labeled with two residue numbers are derived from overlapped cross peaks in the HSQC spectra. (b) Plot of folding rate constant k as a function of residue. Black bars show well-determined rates for amides where the proton occupancy at tfold = 6.4 ms is less than 0.7. Green bars show less well-determined rates for amides with proton occupancy at tfold = 6.4 ms between 0.7 and 0.8. Blue bars show well-determined rates less than 1 s−1 (corresponding to thicker curve-fits in Figure 6a). Red dots show amides with proton occupancy at tfold = 6.4 ms > 0.8, for which no folding rates were calculated. The positions of helices in the folded holoprotein are indicated at the top of the graph, and loops are labeled.
Figure 8. Location of the slowest-folding amides on the structure of soybean Lb.
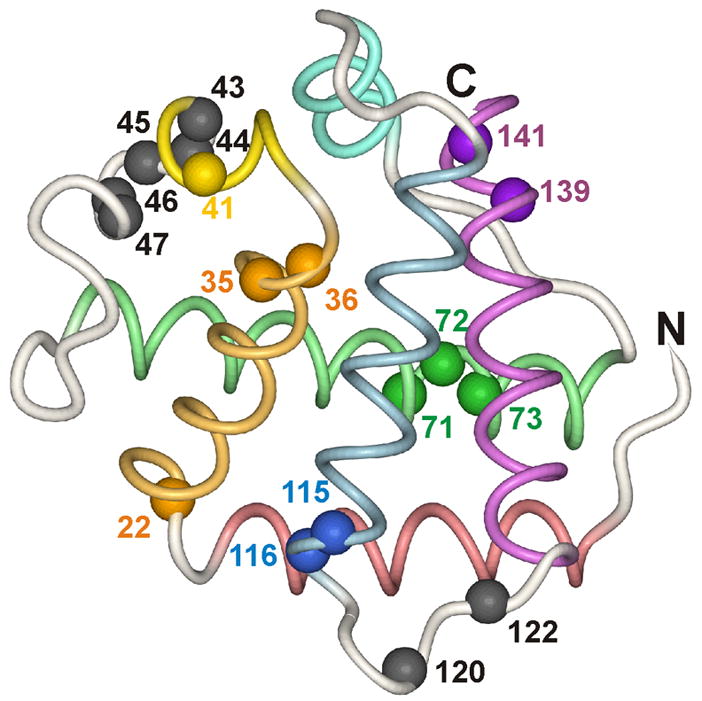
The position of the amide nitrogen is shown, with the spheres colored according to the helix colors of Figure 1.
Discussion
Correlation of AABUF with folded regions in the burst phase intermediate
A running average of the quantity “average area buried upon folding” (AABUF)23 is useful for predicting the regions of the amino acid sequence that are folded early during the process of folding of a protein. For apoMb, the regions that fold first to form the kinetic intermediate (parts of the A, B, G, and H helices) correspond to maxima in the plot of AABUF against residue number.25 The sole exception for apoMb is the CD-loop region, which shows a peak in the AABUF plot but is not folded in the kinetic burst phase intermediate and forms stable structure only during the later stages of folding. The CD loop functions in heme and ligand binding, rather than as part of the hydrophobic core, and might therefore be expected to behave anomalously in the apoprotein.
By contrast, the DMSO-detected pH pulse labeling results for apoLb folding show that the G and H helices are the most highly protected in the kinetic intermediate (Figure 3A). In addition, amides in the central region of the E-helix and a localized region of the C–E loop are strongly protected against exchange and some of the B-helix residues are also slightly protected. This pattern of amide protection, resulting from the formation of helical structure in the kinetic intermediate, is quite consistent with the AABUF profile, in which maxima occur in the B, E, G, and H helix regions and the CE-loop (Figure 3).
Comparison of kinetic data between D2O- and DMSO-detected methods
In our previous quench-flow studies of apoLb,5 folding was initiated by a jump in the concentration of urea, from 6 M to 0.7 M in D2O. For quench-flow experiments in which H/D exchange is detected in DMSO solution, it is impractical to use a denaturant concentration jump, and therefore a jump in pH from 2.0 to 6.0 is used to initiate refolding. It should be emphasized that the entire folding experiment is conducted in aqueous solution, up until the final step, where the quenched samples are frozen, lyophilized and subsequently dissolved in DMSO. This procedure allows the amide exchange protection to be measured without the scrambling of label that occurs if the NMR spectra are recorded for samples in water solution.10
Significant differences were observed in the patterns of exchange protection observed in the conventional and DMSO pulse labeling experiments. For example, the protection at the C-terminus of the B helix, at the N-terminal end of the G helix, and in the C–E loop in the kinetic intermediate was clearly underestimated in the D2O-based experiments.5 This is because these amides are relatively labile in natively folded apoLb and exchange with the D2O solvent in the conventional pulse labeling experiment, but are readily observed when the NMR spectra are recorded in DMSO.
Differences between the kinetic and equilibrium intermediates of apoLb
For apoMb, stabilized helical structure is located in very similar regions in the kinetic and equilibrium intermediates. For both intermediates, amide protons in the A, B, G, and H helix regions are protected from exchange by formation of hydrogen bonded helical structures, although clear differences in protection factors are observed and the equilibrium intermediate is more labile than its kinetic counterpart.10 Thus, for apoMb, the equilibrium intermediate is a good model for the kinetic burst phase intermediate; the observed differences are in stability, rather than in structure. We attribute these differences to differences in pH (pH 4 for equilibrium and pH6 for the kinetic intermediate), an observation which is consistent with small angle X-ray scattering data that shows that the kinetic intermediate adopts a more compact structure than that of the equilibrium intermediate, according to the values of the radius of gyration.28–30
By contrast, a much more striking structural difference is observed between the kinetic and equilibrium intermediates of apoLb (Figures 3–5). In the kinetic intermediate, amides at the C-terminus of the B helix, in the middle of the E helix, in the G and H helices, and in the C–E loop are strongly protected from exchange by formation of hydrogen bonded structure. However, the pattern of exchange protection is very different for the equilibrium molten globule formed at pH 3.7: only the B, G, and H helices form stable folded structures that give rise to strong protection of amide protons, and the E helix appears to be largely unfolded. The C-terminal half of the A-helix is also significantly protected in the equilibrium molten globule but not in the burst phase intermediate. These differences appear to be primarily due to changes in the local charge status at the different pH values where the two types of measurements are made. Electrostatic repulsion or additional hydrophobic interaction at low pH may alter the relative stability of helical structure significantly. In the kinetic intermediate formed during refolding at pH 6, residues 64–70 are protected from exchange, which we attribute to formation of stable helical structure. This region is expected to be uncharged under the conditions of the refolding experiment; the positive charge of K64 and R70 will be neutralized by the deprotonated side chains of E63 and D71. However, at pH 3.7, the conditions under which the equilibrium molten globule is maximally populated, the acidic side chains will be protonated and this region will have net positive charge, which could destabilize packing and secondary structure formation in the E helix. The distal His61 provides an additional positive charge at the lower pH and might also contribute to destabilization of the E helix in the equilibrium intermediate. On the other hand, there are a number of negatively-charged residues in the A helix, particularly E5 and E16, which might reinforce the hydrophobic packing formed in the A-helix in the equilibrium intermediate when their side-chains are protonated at low pH.
Another difference between the equilibrium and kinetic intermediates is found in the C–E loop. Several amides in this region have high proton occupancies in the kinetic intermediate but are relatively poorly protected in the equilibrium intermediate (Figs. 3 and 4). Interestingly, complete protection only occurs in the final, very slow stages of folding, with rate constants of the order of 0.5 s−1 (Fig. 6). It seems likely that the C-E loop may make non-native contacts in the kinetic intermediate, which are resolved slowly as folding proceeds.
Structure of the kinetic intermediates of apoLb and apoMb
Significant differences in the structures of the kinetic intermediate between apoMb and apoLb have been reported previously.5 The burst phase intermediate of apoLb contains stable structure in the E, G and H helix regions, whereas in the kinetic intermediate of apoMb, structure is formed in the A, G and H helices and part of the B helix. The AABUF profiles of apoMb25 and apoLb (Figure 3A) are consistent with the observed differences in the structures of the two kinetic intermediates. The observed correlation between maxima in the AABUF profile and the location of secondary structure in the burst phase intermediate is supported by mutagenesis of apoMb to specifically change the AABUF profile; these experiments showed that the kinetic intermediate contains helices in the regions that have the highest AABUF scores.25
The equilibrium intermediates of apoLb and apoMb have similar structures
Interestingly, the structures of the equilibrium molten globule intermediates of apoLb and apoMb, formed at pH 3.7 and pH 4, respectively, are quite similar. Both proteins contain helical structure in the G and H regions that protects amides from exchange (fig. 4 and ref. 10); protection factors are higher in the H helix region in particular for the apoLb molten globule, indicating greater stability of the helical structure. In addition, structure is formed in the A and B helix regions for both proteins, although once again the relative stabilities vary.
Mechanism of the two phase transition to the native state
The existence of an additional slow phase in apoLb folding is another significant difference from the behavior of apoMb. Two different classes of rates for the single exponential fitting of the proton occupancy data for individual residues are clearly distinguishable (Figure 6), and two phases are distinguishable in the stopped-flow CD trace (Figure 7). The faster rate (2–3 s−1) is very similar to that of apoMb folding (2.8–3.5 s−1 for refolding under similar conditions).27 The slower refolding rate (~0.5 s−1) is associated with a subset of amide protons, which are mapped onto the structure of the final folded protein in Figure 8. Many of the slowly protected amides are located at the ends of helices and in interhelical loops. There is also a cluster of slowly protected amides in the CE loop (belonging to residues Lys41, Leu43, Phe44, Ser45, Phe46, and Leu47), which are associated with a pronounced maximum in the AABUF profile (Fig. 3). A plausible explanation for the very slow folding process is that this cluster of hydrophobic residues becomes trapped in non-native structure in the kinetic intermediate. The slowest step during the folding process would thus be recovery from the non-native structure and subsequent stabilization of the protein structure, a process that would be particularly evident in the exchange behavior of amide protons located in the frayed termini of each helix. Although bi-exponential folding was observed in the stopped-flow urea-jump experiments,5 the extra-slow phase was not previously discernible in the quench-flow experiments, probably due either to the greater lability of amide probes under these conditions, or to a slightly decreased stability of the non-native structure in the CE loop in the presence of 0.7 M urea.
Conclusion
The present work shows that, in contrast to the prevailing dogma, the structures of kinetic folding intermediates and equilibrium molten globule intermediates are not necessarily similar. Published studies of apomyoglobin,4α-lactalbumin,15 ribonuclease H,16 and β-lactoglobulin17 suggest that the kinetic and equilibrium intermediates adopt very similar structures. However this is not the case for apoleghemoglobin, for which distinctly different structural ensembles are observed for the equilibrium molten globule state formed at pH 3.7 and the intermediate formed during kinetic refolding at pH 6.0. These differences appear to be due to differences in local charge due to protonation of acidic side chains at the lower pH. While it is possible that the two intermediates represent distinct species, occupying different wells on the energy landscape, it seems more likely that the landscape itself is influenced by the solution conditions, i.e. by the differences in pH. Support for this concept comes from mutagenesis studies of apomyoglobin; substitution of His64 by phenylalanine replaces a charged residue by a hydrophobic side chain and leads to stabilization of the E helix in both the equilibrium and kinetic intermediates.31,32 These experiments suggest that the energy landscape is highly plastic and is sensitive to the charge state of individual residues; the detailed features of the energy landscape can therefore be modulated by changes in protein environment. As a consequence, any given protein can follow diverse folding pathways through the energy landscape, and individual pathways can be favored or disfavored depending on the solution conditions. The location of the charged residues in the protein molecule is a pivotal factor for the selection from the diverse folding pathways that are potentially available.
Methods
Protein preparation
Recombinant soybean apoLba was over-expressed in Escherichia coli BL21-DE3 cells with a pET24a vector containing the Lba gene.33 The 15N-labeled protein for the pH-pulse labeling and interrupted H/D exchange experiments and the 15N,13C-double-labeled protein for the signal assignments were expressed in M9 minimal medium using 15N-ammonium sulfate and 13C-glucose as sole nitrogen and carbon sources. Labeled protein was purified as described previously.34 An extinction coefficient of 18,700 M−1cm−1 at 280 nm, pH6.0 was used to determine concentrations of apoLb.35
Fluorescence and CD spectroscopy
Tryptophan fluorescence spectra were collected on a Fluorolog-3 fluorescence spectrometer (Jobin Yvon-Horiba) at 25°C. Excitation and emission bandwidths were both set at 2 nm. The spectra of apoLb solution (2 μM) in 10 mM sodium acetate buffer were scanned from 300 nm to 400 nm with an excitation wavelength of 288 nm. The maximum intensities of the Trp fluorescence emission were plotted as a function of pH.
CD spectra were recorded on an Aviv 62DS spectrometer at 25°C. The ellipticity of the apoLb solutions (10 μM) in 10 mM sodium acetate buffer was monitored at 222 nm at various pH. For both fluorescence and CD spectra, separate samples were prepared at each pH.
Stopped-flow CD study
Formation of helical structure after the initiation of refolding was recorded using a DX-17MV Applied Photophysics instrument. The CD signal was continuously monitored at 225 nm (slit width 2 mm) after pH-jump from pH 2.0 to pH 6.0 at 8°C. A solution containing acid-unfolded protein was mixed with a 5-fold excess of a 30 mM sodium acetate buffer to a final pH of 6.0, and the final concentration of protein was adjusted to 10 μM. The dead time of this instrument is about 20 ms.
pH pulse-labeling H/D exchange
Amide proton protection during the refolding of apoLb was observed at each residue using the combination of the pH-pulse labeling H/D exchange and NMR data acquisition in DMSO.10 The pH-pulse labeling of the protein solution (2.0 mg/ml at pH 2.0) in H2O was conducted at 8°C with a Biologic QFM5 Quench Flow instrument (Grenoble, France). Protein folding was initiated by pH jump from pH 2.0 to pH* 6.0, achieved by mixing with 7.5-fold volume of 20 mM sodium acetate buffer in D2O. After each refolding time (6.4 ms – 8 s), a 35 ms pH-pulse label (pH* 10.3) was employed by the addition of 100 mM 3-[cyclohexylamino]-1-propanesulfonic acid buffer in D2O, and the solution pH was immediately lowered to pH* 6.0 with 300 mM 3-(N-morpholino)propane-sulfonic acid buffer in D2O. For the calculation of the pulse-label independent burst phase amplitude A0, the pH-pulse label was employed at the shortest refolding time (6.4 ms) for different pulse durations (12, 20, 35, 65 and 95 ms).22 The pH-pulse labeled solution was flushed into a tube containing 0.1 % (v/v) trifluoroacetic acid solution in D2O, and this solution (final pH* 2.5) was immediately frozen in liquid N2 followed by lyophilization. The lyophilized protein powder was kept in the −80 C freezer until dissolved in DMSO for collection of NMR data.
Interrupted H/D exchange
Individual samples were prepared for each time-duration in the H/D exchange studies, as previously described.10,11 For the equilibrium intermediate, the apoLb solution (1.5 mg/ml) in 2 mM sodium acetate buffer in H2O at pH 3.7 was diluted into a 10-fold volume of the same buffer in D2O at 4°C. After H/D exchange times between 40 s and 24 h at 4°C, the pH* of the solution was dropped to 2.5 by the addition of 0.1 % (v/v) trifluoroacetic acid solution in D2O. The solution was frozen in liquid N2 and lyophilized. In case of the H/D exchange studies for the native state, 10 mM sodium acetate buffer at pH 6 was used.
NMR spectroscopy
1H - 15N heteronuclear single quantum correlation (HSQC) spectra were collected at 30°C for each H/D exchange sample on a Bruker DRX600 spectrometer equipped with a cryoprobe. Each HSQC data acquisition was started exactly 8 min after the addition of 99.6 % (v/v) d6-DMSO (99.96 % deuterated, Cambridge Isotope Laboratories, Andover, MA) and 0.4 % (v/v) D2O (CIL) into the lyophilized protein powder.10 The spectra of the protein solutions (about 0.2 mM) were collected with spectral widths of 9,615 Hz and 2,048 points in the 1H dimension and 1,538 Hz and 256 points in the 15N dimension. For each sample, about 15 HSQC spectra were collected sequentially, with acquisition of a spectrum every 20 min. As previously described,10, addition of a small amount of D2O to the DMSO solution is designed to account for the vanishingly small but variable amounts of residual water in the samples: the intensities of each peak in the consecutive spectra was curve-fitted to an exponential decay. The intensity calculated by the extrapolation of the curve to zero time was used for the calculations of proton occupancy and protection factor. Each HSQC spectrum in the time course was normalized using the methyl proton signals observed in additional 1D proton spectra. The proton occupancy of each amide proton at each refolding time for the pH-pulse labeling experiments was calculated using the intensity of the same signal at the longest refolding time (8 s) as a standard. The rate constant for the interrupted H/D exchange was calculated on the basis of the transition of the peak intensity during the H/D exchange time, and the protection factor was estimated using the intrinsic H/D exchange rate.10
Backbone resonances for unfolded apoLb in DMSO were assigned using a Bruker DRX800 spectrometer at 30°C using 3D NMR spectra, including HNCA, HNCO, HNCOCA,36 HNCACO,37 HNCACB,38,39 and CBCA(CO)NH40 as previously described for apoMb.10 Each 15N,13C-double-labeled sample was prepared in a similar manner to the pH-pulse labeled and interrupted H/D exchange samples, since the chemical shift values for each peak are sensitive to the salt concentration and buffer components included in the sample. The NMR data were collected in the indirect dimension with the TPPI-States method,41, processed using NMRPipe42 and analyzed by NMRView.43
Acknowledgments
This work was supported by grant DK34909 from the National Institutes of Health.
Footnotes
Publisher's Disclaimer: This is a PDF file of an unedited manuscript that has been accepted for publication. As a service to our customers we are providing this early version of the manuscript. The manuscript will undergo copyediting, typesetting, and review of the resulting proof before it is published in its final citable form. Please note that during the production process errors may be discovered which could affect the content, and all legal disclaimers that apply to the journal pertain.
Reference List
- 1.Bashford D, Chothia C, Lesk AM. Determinants of a protein fold. Unique features of the globin amino acid sequence. J Mol Biol. 1987;196:199–216. doi: 10.1016/0022-2836(87)90521-3. [DOI] [PubMed] [Google Scholar]
- 2.Appleby CA. Leghemoglobin and Rhizobium respiration. Ann Rev Plant Physiol. 1984;35:443–478. [Google Scholar]
- 3.Appleby CA. The origin and functions of hemoglobin in plants. Sci Progr. 1992;76:365–398. [Google Scholar]
- 4.Jennings PA, Wright PE. Formation of a molten globule intermediate early in the kinetic folding pathway of apomyoglobin. Science. 1993;262:892–896. doi: 10.1126/science.8235610. [DOI] [PubMed] [Google Scholar]
- 5.Nishimura C, Prytulla S, Dyson HJ, Wright PE. Conservation of folding pathways in evolutionarily distant globin sequences. Nat Struct Biol. 2000;7:679–686. doi: 10.1038/77985. [DOI] [PubMed] [Google Scholar]
- 6.Udgaonkar JB, Baldwin RL. NMR evidence for an early framework intermediate on the folding pathway of ribonuclease A. Nature. 1988;335:694–699. doi: 10.1038/335694a0. [DOI] [PubMed] [Google Scholar]
- 7.Roder H, Elöve GA, Englander SW. Structural characterization of folding intermediates in cytochrome c by H-exchange labelling and proton NMR. Nature. 1988;335:700–704. doi: 10.1038/335700a0. [DOI] [PMC free article] [PubMed] [Google Scholar]
- 8.Katta V, Chait BT. Conformational changes in proteins probed by hydrogen-exchange electrospray-ionization mass spectrometry. Rapid Commun Mass Spectrom. 1991;5:214–217. doi: 10.1002/rcm.1290050415. [DOI] [PubMed] [Google Scholar]
- 9.Miranker A, Robinson CV, Radford SE, Aplin RT, Dobson CM. Detection of transient protein folding populations by mass spectrometry. Science. 1993;262:896–900. doi: 10.1126/science.8235611. [DOI] [PubMed] [Google Scholar]
- 10.Nishimura C, Dyson HJ, Wright PE. Enhanced picture of protein-folding intermediates using organic solvents in H/D exchange and quench-flow experiments. Proc Natl Acad Sci USA. 2005;102:4765–4770. doi: 10.1073/pnas.0409538102. [DOI] [PMC free article] [PubMed] [Google Scholar]
- 11.Hughson FM, Wright PE, Baldwin RL. Structural characterization of a partly folded apomyoglobin intermediate. Science. 1990;249:1544–1548. doi: 10.1126/science.2218495. [DOI] [PubMed] [Google Scholar]
- 12.Matthews CR. Pathways of protein folding. Annu Rev Biochem. 1993;62:653–683. doi: 10.1146/annurev.bi.62.070193.003253. [DOI] [PubMed] [Google Scholar]
- 13.Ptitsyn OB. Kinetic and equilibrium intermediates in protein folding. Protein Eng. 1994;7(5):593–596. doi: 10.1093/protein/7.5.593. [DOI] [PubMed] [Google Scholar]
- 14.Arai M, Kuwajima K. Role of the molten globule state in protein folding. Advan Protein Chem. 2000;53:209–282. doi: 10.1016/s0065-3233(00)53005-8. [DOI] [PubMed] [Google Scholar]
- 15.Ikeguchi M, Kuwajima K, Mitani M, Sugai S. Evidence for identity between the equilibrium unfolding intermediate and a transient folding intermediate: A comparative study of the folding reactions of α-lactalbumin and lysozyme. Biochemistry. 1986;25:6965–6972. doi: 10.1021/bi00370a034. [DOI] [PubMed] [Google Scholar]
- 16.Raschke TM, Marqusee S. The kinetic folding intermediate of ribonuclease H resembles the acid molten globule and partially unfolded molecules detected under native conditions. Nature Struct Biol. 1997;4:298–304. doi: 10.1038/nsb0497-298. [DOI] [PubMed] [Google Scholar]
- 17.Fujiwara K, Arai M, Shimizu A, Ikeguchi M, Kuwajima K, Sugai S. Folding-unfolding equilibrium and kinetics of equine β-lactoglobulin: Equivalence between the equilibrium molten globule state and a burst-phase folding intermediate. Biochemistry. 1999;38:4455–4463. doi: 10.1021/bi982683p. [DOI] [PubMed] [Google Scholar]
- 18.Arutyunyan EG, Deisenhofer J, Teplyakov AV, Kuranova IP, Obmolova GV, Vainshtein BK. Structural parameters of ligand binding by lupine leghemoglobin at 2.0 Å resolution. Dokl Akad Nauk SSSR. 1983;270:732–736. [Google Scholar]
- 19.Ellis PJ, Appleby CA, Guss JM, Hunter WN, Ollis DL, Freeman HC. The crystal structure of ferric soybean leghemoglobin a nicotinate at 2.3 A resolution. Acta Crystallographica Section D. 1997;53:302–310. doi: 10.1107/S0907444997000292. [DOI] [PubMed] [Google Scholar]
- 20.Morikis D, Wright PE. Hydrogen exchange in the carbon monoxide complex of soybean leghemoglobin. Eur J Biochem. 1996;237:212–220. doi: 10.1111/j.1432-1033.1996.0212n.x. [DOI] [PubMed] [Google Scholar]
- 21.Nicola NA, Minasian E, Appleby CA, Leach SJ. Circular dichroism studies of myoglobin and leghemoglobin. Biochemistry. 1975;14:5141–5149. doi: 10.1021/bi00694a019. [DOI] [PubMed] [Google Scholar]
- 22.Nishimura C, Dyson HJ, Wright PE. The apomyoglobin folding pathway revisited: structural heterogeneity in the kinetic burst phase intermediate. J Mol Biol. 2002;322:483–489. doi: 10.1016/s0022-2836(02)00810-0. [DOI] [PubMed] [Google Scholar]
- 23.Rose GD, Geselowitz AR, Lesser GJ, Lee RH, Zehfus MH. Hydrophobicity of amino acid residues in globular proteins. Science. 1985;229:834–838. doi: 10.1126/science.4023714. [DOI] [PubMed] [Google Scholar]
- 24.Dyson HJ, Wright PE, Scheraga HA. The role of hydrophobic interactions in initiation and propagation of protein folding. Proc Natl Acad Sci USA. 2006;103:13057–13061. doi: 10.1073/pnas.0605504103. [DOI] [PMC free article] [PubMed] [Google Scholar]
- 25.Nishimura C, Lietzow MA, Dyson HJ, Wright PE. Sequence determinants of a protein folding pathway. J Mol Biol. 2005;351:383–392. doi: 10.1016/j.jmb.2005.06.017. [DOI] [PubMed] [Google Scholar]
- 26.Bai Y, Milne JS, Mayne L, Englander SW. Primary structure effects on peptide group hydrogen exchange. Proteins. 1993;17:75–86. doi: 10.1002/prot.340170110. [DOI] [PMC free article] [PubMed] [Google Scholar]
- 27.Nishimura C, Dyson HJ, Wright PE. Identification of Native and Non-native Structure in Kinetic Folding Intermediates of Apomyoglobin. J Mol Biol. 2006;355:139–156. doi: 10.1016/j.jmb.2005.10.047. [DOI] [PubMed] [Google Scholar]
- 28.Eliezer D, Jennings PA, Wright PE, Doniach S, Hodgson KO, Tsuruta H. The radius of gyration of an apomyoglobin folding intermediate. Science. 1995;270:487–488. doi: 10.1126/science.270.5235.487. [DOI] [PubMed] [Google Scholar]
- 29.Uzawa T, Akiyama S, Kimura T, Takahashi S, Ishimori K, Morishima I, Fujisawa T. Collapse and search dynamics of apomyoglobin folding revealed by submillisecond observations of α-helical content and compactness. Proc Natl Acad Sci USA. 2004;101:1171–1176. doi: 10.1073/pnas.0305376101. [DOI] [PMC free article] [PubMed] [Google Scholar]
- 30.Seki Y, Tomizawa T, Hiragi Y, Soda K. Global Structure Analysis of Acid-Unfolded Myoglobin with Consideration to Effects of Intermolecular Coulomb Repulsion on Solution X-ray Scattering. Biochemistry. 2007;46:234–244. doi: 10.1021/bi061578+. [DOI] [PubMed] [Google Scholar]
- 31.Garcia C, Nishimura C, Cavagnero S, Dyson HJ, Wright PE. Changes in the apomyoglobin folding pathway caused by mutation of the distal histidine residue. Biochemistry. 2000;39:11227–11237. doi: 10.1021/bi0010266. [DOI] [PubMed] [Google Scholar]
- 32.Schwarzinger S, Mohana-Borges R, Kroon GJA, Dyson HJ, Wright PE. Structural characterization of partially folded intermediates of apomyoglobin H64F. Protein Sci. 2008;17:313–321. doi: 10.1110/ps.073187208. [DOI] [PMC free article] [PubMed] [Google Scholar]
- 33.Jennings PA, Stone MJ, Wright PE. Overexpression of myoglobin and assignment of the amide, Cα and Cβ resonances. J Biomol NMR. 1995;6:271–276. doi: 10.1007/BF00197808. [DOI] [PubMed] [Google Scholar]
- 34.Prytulla S, Dyson HJ, Wright PE. Gene synthesis, high-level expression and assignment of backbone 15N and 13C resonances of soybean leghemoglobin. FEBS Lett. 1996;399:283–289. doi: 10.1016/s0014-5793(96)01278-1. [DOI] [PubMed] [Google Scholar]
- 35.Ellfolk N, Sievers G. Circular dichroism of soybean leghemoglobin. Biochim Biophys Acta. 1975;405:213–227. doi: 10.1016/0005-2795(75)90088-4. [DOI] [PubMed] [Google Scholar]
- 36.Grzesiek S, Bax A. Improved 3D triple-resonance NMR techniques applied to a 31 kDa protein. J Magn Reson. 1992;96:432–440. [Google Scholar]
- 37.Kay LE, Ikura M, Tschudin R, Bax A. Three-dimensional triple-resonance NMR spectroscopy of isotopically enriched proteins. J Magn Reson. 1990;89:496–514. doi: 10.1016/j.jmr.2011.09.004. [DOI] [PubMed] [Google Scholar]
- 38.Grzesiek S, Bax A. An efficient experiment for sequential backbone assignment of medium-sized isotopically enriched proteins. J Magn Reson. 1992;99:201–207. [Google Scholar]
- 39.Wittekind M, Mueller L. HNCACB, a high-sensitivity 3D NMR experiment to correlate amide-proton and nitrogen resonances with the alpha-and beta-carbon resonances in proteins. J Magn Reson. 1993;101:201–205. [Google Scholar]
- 40.Grzesiek S, Bax A. Correlating backbone amide and side chain resonances in larger proteins by multiple relayed triple resonance NMR. J Am Chem Soc. 1992;114:6291–6293. [Google Scholar]
- 41.Marion D, Ikura M, Tschudin R, Bax A. Rapid recording of 2D NMR spectra without phase cycling. Application to the study of hydrogen exchange in proteins. J Magn Reson. 1989;85:393–399. [Google Scholar]
- 42.Delaglio F, Grzesiek S, Vuister GW, Guang Z, Pfeifer J, Bax A. NMRPipe: a multidimensional spectral processing system based on UNIX pipes. J Biomol NMR. 1995;6:277–293. doi: 10.1007/BF00197809. [DOI] [PubMed] [Google Scholar]
- 43.Johnson BA, Blevins RA. NMRView: A computer program for the visualization and analysis of NMR data. J Biomol NMR. 1994;4:604–613. doi: 10.1007/BF00404272. [DOI] [PubMed] [Google Scholar]
- 44.Kuriyan J, Wilz S, Karplus M, Petsko GA. X-ray structure and refinement of carbon-monoxy (Fe II)-myoglobin at 1.5 Å resolution. J Mol Biol. 1986;192:133–154. doi: 10.1016/0022-2836(86)90470-5. [DOI] [PubMed] [Google Scholar]


