Abstract
The purpose of this study was to quantify the level of serum DNA in different groups of primary breast cancer patients and in healthy controls using real-time quantitative PCR in order to determine whether such measurements have diagnostic or prognostic value. A total of 96 serum samples of patients with primary breast cancer before surgery (with positive or negative lymph nodes and with high or low relapse-free survival) as well as 24 healthy controls were analysed. DNA concentrations in the serum of the patients differed significantly from the concentration of serum DNA in the controls (medians were 221 and 63 ng ml−1, respectively, P<0.001 M–W test). However, no statistically significant difference was observed between the patient groups (P=0.87, M–W test). The serum DNA levels were elevated independently of the size of primary tumour or lymph node metastases. The overall survival of patients with serum DNA concentrations >221 ng ml−1 was better than patients with serum DNA concentration ⩽221 ng ml−1 (Kaplan–Meier, P=0.028).
Keywords: serum, circulating DNA, breast cancer, real-time PCR
Breast cancer is the most common malignancy in the female western population, responsible for up to one in five cancer-related deaths among women (Chen et al, 1999). Early detection and a reliable follow-up of breast cancer are crucial for successful treatment. For a definitive diagnosis, a tumour biopsy is required; however, a noninvasive test for early detection of the disease and for monitoring disease progression has been a goal for many researchers.
The presence of circulating nucleic acids in plasma and serum was first described many years ago (Mandel and Métais, 1947; Tan et al, 1966; Koffler et al, 1973). By using methods such as radioimmunoassay, it was discovered that cancer patients have higher levels of circulating DNA than those with nonmalignant diseases and healthy controls (Leon et al, 1977). Further more, it was shown that the level of circulating DNA is higher for patients with advanced disease (Shapiro et al, 1983).
In the last decade, with the development of more sensitive molecular methods such as the polymerase chain reaction (PCR), a renewed interest in circulating DNA has emerged. Many studies have been concerned with the detection of genetic changes in tumour DNA. A major effort has been devoted to the detection of mutations, loss of heterozygosity (LOH), microsatellites and the methylation status of DNA extracted from tumor tissue and plasma or serum of patients suffering from various tumours (Vasioukhin et al, 1994; Chen et al, 1996; Nawroz et al, 1996; Wong et al, 1999).
More recently, further studies have been carried out trying to determine if the level of circulating DNA can be used as a diagnostic or prognostic marker for cancer, as well as for other conditions such as pregnancy complications and trauma (Lo et al, 2000; Leung et al, 2001). For example, a DNA DipStick TM Kit was used to measure circulating DNA in the plasma of lung cancer patients (Sozzi et al, 2001), others have used spectrophotometry for the same purpose (Silva et al, 1999; Silva et al, 2002). In this study, we have used a real-time PCR method (Lo et al, 1998) to quantify the level of circulating DNA in controls and four different groups of patients diagnosed with breast caner. This method provides an accurate quantitation of the low concentrations of DNA in serum, enabling the results presented here to be directly compared to future studies. The present study is the first large study of serum DNA quantitation in breast cancer by real-time PCR.
MATERIALS AND METHODS
Patients and samples
We performed a retrospective study analysing serum samples from 96 women diagnosed with primary breast cancer collected before surgery. Four groups of patients were chosen: 26 cases had negative lymph nodes (LN) and low relapse-free survival (rfs⩽5 years) (group A); 22 cases had negative LN and high rfs (>5 years) (group B), 25 cases had positive LN and low rfs (group C) and 23 cases had positive LN and high rfs (group D). These groupings were chosen to analyse whether analysis of serum DNA would help to define the different risk groups independently of node status. A total of 24 frozen serum samples from healthy women blood donors were used as controls. Samples were selected on the basis of sufficient serum and appropriate clinical data available. All patients signed an informed consent form approved by the Oxford Radcliffe Hospitals ethical committee.
Sample preparation
DNA was extracted from 400 μl of serum using QIAamp DNA Blood Mini Kit (Qiagen, UK), according to the ‘blood and body fluid protocol’, with an elution volume of 50 μl. DNA samples were frozen at −20°C until further processing.
Real-time PCR
All PCR reactions were performed on an Applied Biosystems 5700 Sequence Detection System using the 5′nuclease assay. In the 5′nuclease assay-based real-time PCR, a fluorescent probe containing a reporter dye at the 5′ end and a quencher dye at the 3′ end is included in the reaction in addition to two primers. During the reaction, cleavage of the probe by the AmpliTaq Gold enzyme separates the reporter dye and the quencher dye, which results in increased fluorescence of the reporter. Accumulation of PCR products is detected directly by monitoring the increase in fluorescence by a charge-coupled device camera.
For each reaction, a threshold cycle or CT value is determined. This value is the cycle at which a statistically significant increase in fluorescence is first detected. The higher the starting quantity of a target sequence, the earlier a significant increase in fluorescence is detected.
Standard curve
By using a standard curve, it is possible to calculate the absolute concentration of target DNA in a sample. In this study, we generated a standard curve using five-fold serial dilutions of known concentrations of DNA (1000, 200, 40, 8, 1.28, 0.64 genome equivalents μl−1).
Polymerase chain reaction amplification
Serum DNA was measured using a real-time quantitative assay for the β-globin gene, according to the method developed by Lo et al. The assay included two primers, β-globin-345F, 5′-GTG CAC CTG ACT CCT GAG GAG A-3′; β-globin-445R, 5′-CCT TGA TAC CAA CCT GCC CAG-3′, and a dual-labelled fluorescent TaqMan probe, β-globin-402T, 5′-(FAM) AAG GTG AAC GTG GAT GAA GTT GGT GG(TAMARA)-3′. Sequence data were taken from the GeneBank Sequence Database accession no. U01317. Polymerase chain reaction was performed in a final volume of 25 μl and contained 12.5 μl of TaqMan 2 × Universal PCR Master Mix (AmpliTaq Gold® DNA polymerase, AmpErase® UNG, dNTPs with dUNTP, Passive reference 1 and optimised buffer components), 100 nM of Taqman probe, 300 nM of each primer and 4 μl of extracted DNA.
Each sample was analysed in triplicate. Triplicates of the standard curve were included in each run.
Data analysis
The mean quantity of each triplicate calculated by the 5700 sequence detection system software was used for further analysis. As described by Lo et al the concentration, expressed in copies per millilitre, was calculated using the following equation:
 |
where C=target concentration in plasma (copies per millilitre); Q=target quantity (copies) calculated by the sequence detection system, VDNA=total volume of extraction (50 μl); VPCR=volume of DNA solution used per PCR reaction (4 μl); and Vext=volume of plasma extracted (400 μl).
The concentration in ng ml−1 was calculated by using 6.6 pg of DNA per cell as a conversion factor.
Statistical analysis
Data analysis was performed using StatView software and STATA analysis package.
RESULTS
The dynamic range of the real-time PCR
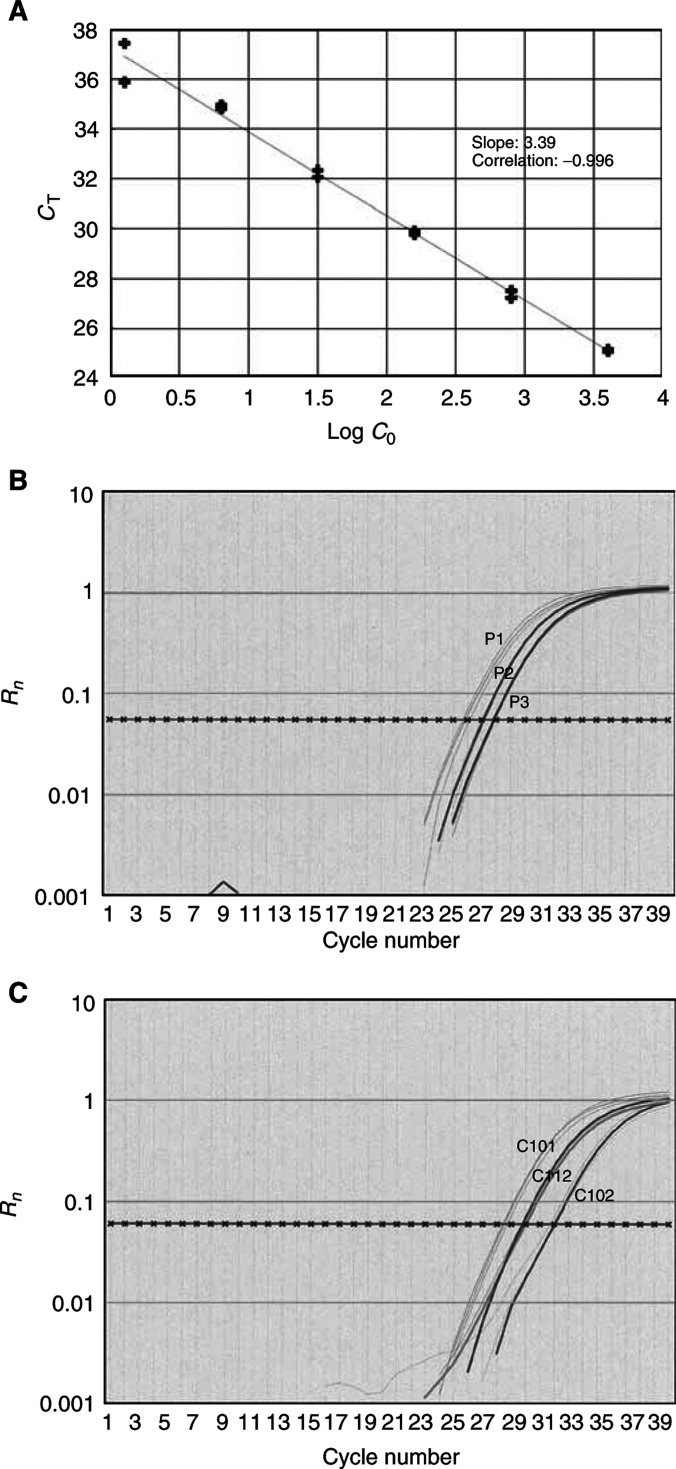
The real-time PCR assay for β-globin enabled the detection of four orders of magnitude, from DNA equivalent of 4000 cells to a single cell. A strong linear relationship between the CT values and the log of the copy numbers was observed (R2>0.99). All the serum sample concentrations fell within the values of the standard curve (Figure 1).
Figure 1.
Real-time PCR. (A) A standard curve for the β-globin assay, using five-fold serial dilutions of genomic DNA (from 4000 to 1 genome equivalents). The X-axis denotes the threshold cycle (CT) and the Y-axis denotes the concentration of the target (logarithmic scale). (B) Amplification curves (triplicates) of three patients with breast cancer. (C) Amplification curves (triplicates) of three controls. The X-axis for (B) and (C) denotes the threshold cycle (CT) and the Y-axis denotes the Rn, which is the fluorescence intensity.
DNA concentrations in serum
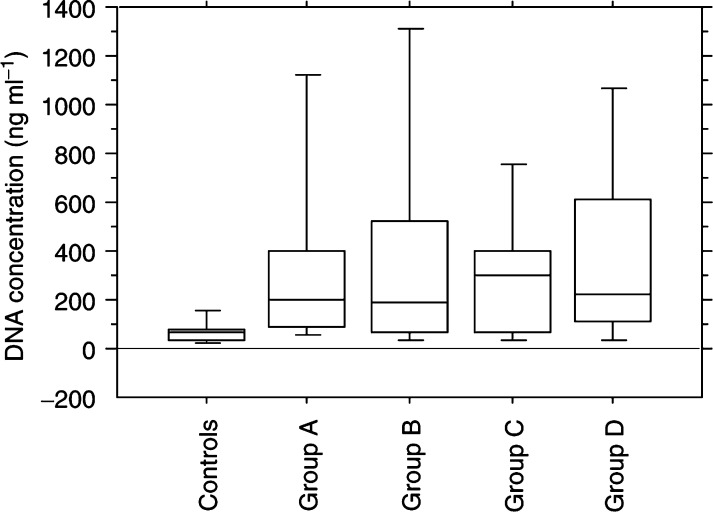
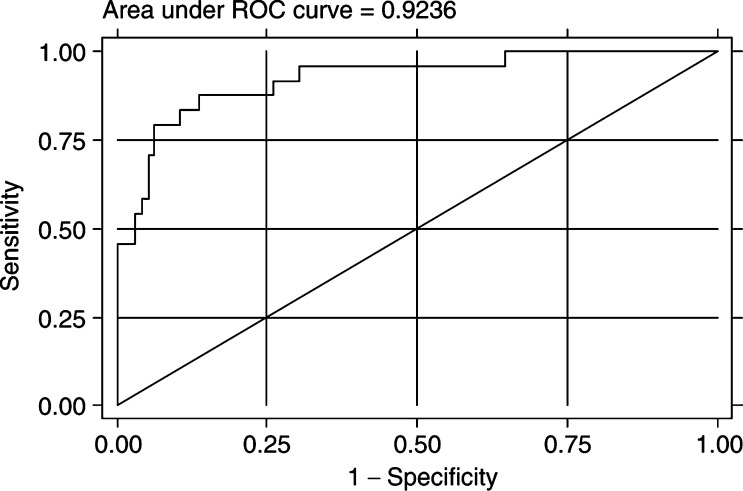
The median of the serum DNA concentration for the controls was 63 (ng ml−1) (range 5–456 ng ml−1). The median of the serum DNA concentration for the patients was 221 ng ml−1 (range 17–3325 ng ml−1). The median values and ranges for the different groups of patients were as follows: 195 (27–2275) ng ml−1 for group A, 191 (24–3325) ng ml−1 for group B, 297 (17–1466) ng ml−1 for group C and 225 (24–2783) ng ml−1 for group D. The difference between the patients and the controls was statistically significant (Mann–Whitney rank sum test, P<0.001). There was no significant difference between the patient groups (Kruskal–Wallis test, P=0.87). The data are summarised in Table 1 and Figure 2. Receptor operating characteristics (ROC) curve analysis was performed taking into account a difference in age between the patients and controls. The area under the ROC curve was 0.92. The sensitivity of the model was 70.8% and the specificity was 93.7% (Figure 3).
Table 1. Serum DNA concentrations of the patients and controls.
| Number of patients | Median concentration of DNA (ng ml−1) | Range (ng ml−1) | Percentage (%) of cases with DNA concentration>100ng ml−1 | P-value | |
|---|---|---|---|---|---|
| Group A | 26 | 195 | 27–2275 | 65% | P=0.87 |
| Group B | 22 | 191 | 24–3325 | 74% | (K–W test) |
| Group C | 25 | 297 | 17–1466 | 72% | |
| Group D | 23 | 225 | 24–2783 | 78% | |
| Groups A–D | 96 | 221 | 17–3325 | 71.5% | P<0.001 |
| Controls | 24 | 63 | 5-456 | 12.5% | (M–W test) |
K–W test=Kruskal–wallis test; M–W test=Mann–Whitney rank sum test.
Figure 2.
Box plot showing the concentrations of DNA in the serum of the different groups of patients and controls. The X-axis shows the subject categories and the Y-axis represents the concentration of serum DNA (ng ml−1). The upper and lower limits of the boxes indicate the 75th and 25th percentiles, respectively. The lines inside the boxes indicate the median. The upper and lower horizontal bars indicate the 90th and 10th percentiles, respectively.
Figure 3.
ROC curve analysis of serum DNA for the prediction of malignancy.
Using a nonparametric rank sum to analyse the results and prognostic factors, we observed an inverse association of DNA concentration with age. The median for age⩾50 years (174 (17–2783) ng ml−1) was significantly lower than the median for age<50 years (319 (24–3325) ng ml−1), P=0.03. Analysing age as a continuous variable using Spearman's test for correlation also demonstrated a statistically significant but weak inverse correlation (P=0.01, rho=−0.26). No association with size (P=0.25), nodal status (P=0.68), oestrogen receptor (ER) (P=0.15) and epidermal growth factor receptor (EGFR) (P=0.35) was found. Table 2 lists the characteristics overall of the population and the categories used for the analysis.
Table 2. Biochemical and clinical characteristics used for the analysis.
| Number of patients | Median | Range | |
|---|---|---|---|
| Nodal status | |||
| Negative | 47 | ||
| Positive | 49 | ||
| Size (cm) | 2.2 | 0.1–10 | |
| ⩽2 | 44 | ||
| >2 | 50 | ||
| Histology | |||
| Infiltrating ductal | 69 | ||
| Infiltrating lobular | 15 | ||
| Infiltrating ductal/lobular | 6 | ||
| Other infiltrating | 6 | ||
| ER status | 34 | 0.6–742 | |
| Negative, <10 fmols mg−1 | 25 | ||
| Positive, ⩾10 fmol mg−1 | 50 | ||
| EGFR status | 23 | 0–241 | |
| Negative, <20 | 33 | ||
| Positive, ⩾20 | 40 | ||
| Age | |||
| Patients | 56 | 25–83 | |
| <50 | 30 | ||
| ⩾50 | 66 | ||
| Controls | 24 | 39 | 23–58 |
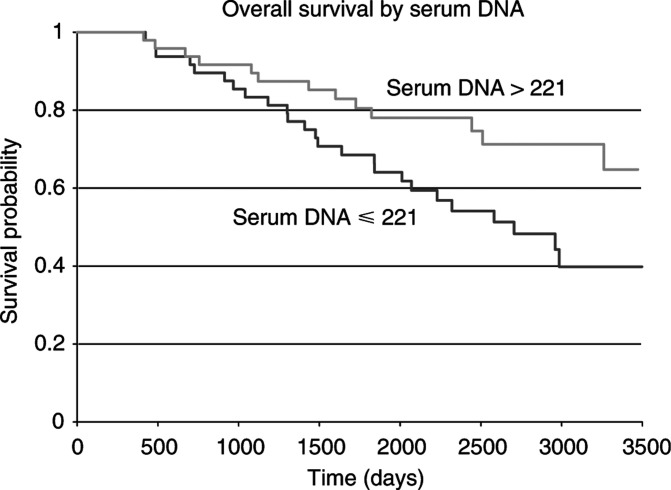
We performed a univariate analysis of overall survival (OS) for known prognostic factors using the log-rank statistic. Tumour size and ER status were significantly associated with OS. Patients with larger tumours (>2 cm) did worse than patients with small tumours (⩽2 cm) (P=0.026), and ER-positive patients did better than ER-negative patients (P=0.009). No association was observed between OS and age (P=0.54) or EGFR status (P=0.63). We did not expect any relation of node status to OS because we selected node positive and negative groups with good and poor survival and there was no relationship (P=0.3). We performed a univariate analysis of OS for circulating DNA in the serum using the median concentration (221 ng ml−1) as a cut point. The median was chosen since serum DNA is a new factor for analysis and it would give an equal number of samples in each of the two sets. We observed an inverse association where patients with serum DNA concentration >221 ng ml−1 had longer survival than patients with serum DNA concentration ⩽221 ng ml−1 (P=0.028) (presented in Figure 4). The positive association of serum DNA with better OS seen in the survival curve is endorsed when the set is divided into three equal groups, with cut points 118.5 and 348 (Kaplan–Meier, P=0.021; data not shown).
Figure 4.
Overall survival (log-rank statistic) of the breast cancer patients according to serum DNA concentrations using the median concentration (221 ng ml−1) as a cut point (P=0.028).
DISCUSSION
In this study, we measured the level of circulating DNA in the serum of healthy controls and four different groups of patients with breast cancer, using a real-time PCR quantitative method (Lo et al, 2000; Leung et al, 2001). This real-time detection methodology generates quantitative data during the exponential phase of PCR, has a linear dynamic range of at least five orders of magnitude and enables 96 reactions to be performed in less than 3 h. The need for postamplification processes such as electrophoresis is eliminated.
Our results show a four-fold difference in the median levels of circulating DNA in serum between breast cancer patients and healthy controls (medians of 221 and 63 ng ml−1, respectively). Of 96 patients, 69 had DNA concentrations of more than 100 ng ml−1 (72%), where only three out of 24 controls had DNA concentrations of more than 100 ng ml−1 (12.5%). The ROC curve result (0.92) demonstrates a powerful association between high DNA concentration and malignancy. However, the predictive value of the test depends on prevalence of abnormal cases, and cannot be applied universally. The levels of circulating DNA did not differ between the groups of patients. All the groups showed elevation compared to the controls. The groups of patients were carefully chosen in this pilot study to be able to detect whether there was a difference between patients with high and low bulk of disease, as reflected in node involvement vs no node involvement, as well as different tumour sizes reflecting the range from 0.1 to 10 cm. In addition, groups with good or poor prognosis were studied. Choosing distinctive groups did not highlight association between serum DNA concentrations and known prognostic factors.
Other investigators have reported measurements of circulating DNA in cancer, although they have not used quantitative PCR. For example, Sozzi et al (2001) quantified circulating DNA in the plasma of 84 patients diagnosed with lung cancer and 43 healthy controls, using the DNA DipStick-TM Kit (Invitrogen). In all, 96% of the patients and 74% of the controls had measurable circulating DNA and the mean value measured was 318 and 18 ng ml−1, respectively. High concentrations of circulating DNA were observed from stage Ia of the disease but no correlations were found with age, sex or survival. We believe that since circulating DNA is significantly elevated in cancer patients from the early stages of the disease and in relatively small tumours, such as primary breast tumours, its measurement may prove to have clinical utility in diagnosis and in disease monitoring.
The origin of circulating DNA is not fully understood. In a recent study, Lui et al studied the origin of circulating DNA in the setting of sex-mismatched bone marrow transplantation, concluding that the plasma DNA was predominantly of donor origin, that is released from haematopoietic cells (Lui et al, 2002). Whether the elevated concentrations of circulating DNA in cancer patients have the same origin or derive from another source of cells, for example the tumour itself, need further investigation. Qualitative studies have shown that genetic alternations such as mutations and LOH were detected in circulating DNA, as well as in the matching tumour cells, suggesting that part of the extra circulating DNA in cancer patients is attributed to DNA released from tumour cells (Gonzalez et al, 2000; Shaw et al, 2000; Beau-Faller et al, 2003). However, our results indicate that the mechanisms of DNA released from tumours are not related to any of the known commonly used major prognostic factors and therefore might highlight different pathways, such as apoptosis, necrosis, hypoxia, that would need to be investigated. It seems likely that at least a proportion of the excess serum DNA in patients with tumours originates from a host response to the tumour (i.e. normal rather than tumour DNA). We found that patients with higher serum DNA concentrations had better overall survival. It may be postulated that higher levels of DNA represents a better host response to the tumour and hence better survival rates. It will be important to develop methods for the separate quantitation of host and tumour DNA.
Prospective studies investigating circulating DNA levels from diagnosis, during and after treatment are necessary to gain insight into their biological behaviour and to asses their clinical utility as disease markers.
Acknowledgments
This study is supported by the National Translational Cancer Research Network (NTRAC). We thank Mr M Greenall, Miss J Clarke and the breast cancer nursing team for their help in sample collection.
References
- Beau-Faller M, Gaub MP, Schneider A, Ducrocq X, Massard G, Gasser B, Chenard MP, Kessler R, Anker P, Stroun M, Weitzenblum E, Pauli G, Wihlm JM, Quoix E, Oudet P (2003) Plasma DNA microsatellite panel as sensitive and tumor-specific marker in lung cancer patients. Int J Cancer 105: 361–370 [DOI] [PubMed] [Google Scholar]
- Chen X, Bonnefoi H, Diebold-Berger S, Lyautey J, Lederrey C, Faltin-Traub E, Stroun M, Anker P (1999) Detecting tumor-related alterations in plasma or serum DNA of patients diagnosed with breast cancer. Clin Cancer Res 5: 2297–2303 [PubMed] [Google Scholar]
- Chen XQ, Stroun M, Magnenat JL, Nicod LP, Kurt AM, Lyautey J, Lederrey C, Anker P (1996) Microsatellite alterations in plasma DNA of small cell lung cancer patients. Nat Med 2: 1033–1035 [DOI] [PubMed] [Google Scholar]
- Gonzalez R, Silva JM, Sanchez A, Dominguez G, Garcia JM, Chen XQ, Stroun M, Provencio M, Espana P, Anker P, Bonilla F (2000) Microsatellite alterations and TP53 mutations in plasma DNA of small-cell lung cancer patients: follow-up study and prognostic significance. Ann Oncol 11: 1097–1104 [DOI] [PubMed] [Google Scholar]
- Koffler D, Agnello V, Winchester R, Kunkel HG (1973) The occurrence of single-stranded DNA in the serum of patients with systemic lupus erythematosus and other diseases. J Clin Invest 52: 198–204 [DOI] [PMC free article] [PubMed] [Google Scholar]
- Leon SA, Shapiro B, Sklaroff DM, Yaros MJ (1977) Free DNA in the serum of cancer patients and the effect of therapy. Cancer Res 37: 646–650 [PubMed] [Google Scholar]
- Leung TN, Zhang J, Lau TK, Chan LY, Lo YM (2001) Increased maternal plasma fetal DNA concentrations in women who eventually develop preeclampsia. Clin Chem 47: 137–139 [PubMed] [Google Scholar]
- Lo YM, Rainer TH, Chan LY, Hjelm NM, Cocks RA (2000) Plasma DNA as a prognostic marker in trauma patients. Clin Chem 46: 319–323 [PubMed] [Google Scholar]
- Lo YM, Tein MS, Lau TK, Haines CJ, Leung TN, Poon PM, Wainscoat JS, Johnson PJ, Chang AM, Hjelm NM (1998) Quantitative analysis of fetal DNA in maternal plasma and serum: implications for noninvasive prenatal diagnosis. Am J Hum Genet 62: 768–775 [DOI] [PMC free article] [PubMed] [Google Scholar]
- Lui YY, Chik KW, Chiu RW, Ho CY, Lam CW, Lo YM (2002) Predominant hematopoietic origin of cell-free DNA in plasma and serum after sex-mismatched bone marrow transplantation. Clin Chem 48: 421–427 [PubMed] [Google Scholar]
- Mandel P, Métais P (1947) Les acides nucleiues du plasma sanguin chez l'Homme. Biologie 3-4: 241–243 [PubMed] [Google Scholar]
- Nawroz H, Koch W, Anker P, Stroun M, Sidransky D (1996) Microsatellite alterations in serum DNA of head and neck cancer patients. Nat Med 2: 1035–1037 [DOI] [PubMed] [Google Scholar]
- Shapiro B, Chakrabarty M, Cohn EM, Leon SA (1983) Determination of circulating DNA levels in patients with benign or malignant gastrointestinal disease. Cancer 51: 2116–2120 [DOI] [PubMed] [Google Scholar]
- Shaw JA, Smith BM, Walsh T, Johnson S, Primrose L, Slade MJ, Walker RA, Coombes RC (2000) Microsatellite alterations plasma DNA of primary breast cancer patients. Clin Cancer Res 6: 1119–1124 [PubMed] [Google Scholar]
- Silva JM, Dominguez G, Garcia JM, Gonzalez R, Villanueva MJ, Navarro F, Provencio M, San Martin S, Espana P, Bonilla F (1999) Presence of tumor DNA in plasma of breast cancer patients: clinicopathological correlations. Cancer Res 59: 3251–3256 [PubMed] [Google Scholar]
- Silva JM, Garcia JM, Dominguez G, Silva J, Miralles C, Cantos B, Coca S, Provencio M, Espana P, Bonilla F (2002) Persistence of tumor DNA in plasma of breast cancer patients after mastectomy. Ann Surg Oncol 9: 71–76 [DOI] [PubMed] [Google Scholar]
- Sozzi G, Conte D, Mariani L, Lo Vullo S, Roz L, Lombardo C, Pierotti MA, Tavecchio L (2001) Analysis of circulating tumor DNA in plasma at diagnosis and during follow-up of lung cancer patients. Cancer Res 61: 4675–4678 [PubMed] [Google Scholar]
- Tan EM, Schur PH, Carr RI, Kunkel HG (1966) Deoxybonucleic acid (DNA) and antibodies to DNA in the serum of patients with systemic lupus erythematosus. J Clin Invest 45: 1732–1740 [DOI] [PMC free article] [PubMed] [Google Scholar]
- Vasioukhin V, Anker P, Maurice P, Lyautey J, Lederrey C, Stroun M (1994) Point mutations of the N-ras gene in the blood plasma DNA of patients with myelodysplastic syndrome or acute myelogenous leukaemia. Br J Haematol 86: 774–779 [DOI] [PubMed] [Google Scholar]
- Wong IH, Lo YM, Zhang J, Liew CT, Ng MH, Wong N, Lai PB, Lau WY, Hjelm NM, Johnson PJ (1999) Detection of aberrant p16 methylation in the plasma and serum of liver cancer patients. Cancer Res 59: 71–73 [PubMed] [Google Scholar]


