Abstract
Water is transported across epithelial membranes in the absence of any hydrostatic or osmotic gradients. A prime example is the small intestine, where 10 liters of water are absorbed each day. Although water absorption is secondary to active solute transport, the coupling mechanism between solute and water flow is not understood. We have tested the hypothesis that water transport is directly linked to solute transport by cotransport proteins such as the brush border Na+/glucose cotransporter. The Na+/glucose cotransporter was expressed in Xenopus oocytes, and the changes in cell volume were measured under sugar-transporting and nontransporting conditions. We demonstrate that 260 water molecules are directly coupled to each sugar molecule transported and estimate that in the human intestine this accounts for 5 liters of water absorption per day. Other animal and plant cotransporters such as the Na+/Cl−/γ-aminobutyric acid, Na+/iodide and H+/amino acid transporters are also able to transport water and this suggests that cotransporters play an important role in water homeostasis.
Keywords: active water transport, oral rehydration therapy, Na+/Cl−/γ-aminobutyric acid cotransporter, Na+/iodide cotransporter, H+/amino acid cotransporter, plant biology
The human small intestine absorbs 10 liters of water a day, and perturbations may result in severe health problems. Worldwide, 10,000 children under 5 years of age die every day from dehydration caused by cholera. Another 3000 children suffering from dehydration are saved each day by oral rehydration therapy (1). Oral rehydration therapy is based on the fact that glucose stimulates salt and water transport across the small intestine. Fluid transport occurs in the absence or even against significant external osmotic or hydrostatic gradients, but it is secondary to active solute transport. Water movement has been postulated to be driven by local osmotic gradients within the tissue (2, 3). It is difficult to explain how local osmotic coupling takes place because (i) osmotic gradients have not been found within epithelial tissues (4, 5), (ii) no water channel proteins have been found in the small intestine (6–8), and (iii) the water permeability of brush border and basolateral membranes is extremely low (4, 9).
One alternative explanation is that water transport is directly coupled to the movement of solutes by cotransporters (4, 5), and we have tested the hypothesis that water is transported across the apical membrane of the intestine by the Na+/glucose cotransporter (SGLT1). Our results suggest that water is cotransported with sodium and sugar. The system chosen was the cloned SGLT1 expressed in Xenopus oocytes (10), and the advantages are (i) the cloned SGLT1 protein is expressed at high levels in the plasma membrane of oocytes, greater than 1011 copies per cell (11, 12); (ii) the coupled transport of Na+ and glucose and the number of transporters expressed in the plasma membrane can be monitored by electrophysiological methods (11, 12); (iii) Na+/glucose cotransport may be rapidly blocked by phlorizin (13); (iv) the rate of Na+/glucose cotransport can be controlled by membrane voltage, with maximal transport occurring at −150 mV and approaching zero at +50 mV (13–15); (v) Xenopus oocytes have a low endogenous water permeability, 1 × 10⁻⁴ cm/sec (12); and (vi) water transport into oocytes can be recorded simply, accurately, and continuously by optical methods (16). Our strategy was to measure the change in the rate of swelling of oocytes, control or cRNA-injected, under sugar-transporting and nontransporting conditions.
MATERIALS AND METHODS
Oocytes were isolated, injected with 50 nl of water or 50 nl of rabbit SGLT1 cRNA at 1 μg/μl, and maintained in Barth medium at 18°C for 5–14 days. The oocyte membrane capacitance (Cm), SGLT1 transient charge movements (Q), and steady-state Na+/glucose currents were recorded using a two-electrode voltage clamp system (11).
Volume (V) was measured using an optical technique (12) where the cross-sectional area A was obtained from bright-field images of the oocyte collected every second using a frame grabber interfaced to a charge-coupled device camera. Volume changes V/Vo were estimated from changes in the cross-sectional area A using the relationship V/Vo = (A/Ao)3/2, where Ao and Vo are the initial area and volume and A and V are their corresponding values at time t. The rate of water transport Jw (in liter/sec) is given by Jw = Vo (d/dt) (V/Vo), where d/dt (V/Vo) is the rate of relative volume change with time. We restricted our investigations to swelling experiments since oocytes behave as ideal osmometers under these conditions (16).
The membrane capacitance was 430 ± 34 nF (n = 5). If a specific capacitance of 1 μF/cm2 is assumed (11), this corresponds to a surface area of 0.43 ± 0.03 cm2. We routinely used the value 0.4 cm2 for the oocyte surface area. This corresponds to an oocyte with diameter of 1.2 mm with a membrane infolding factor of 9 (12). The osmotic permeability coefficient Lp (in cm/sec) was calculated from the volume flow Jw by: Lp = Jw/(SovwΔπ) = Vo[d(V/Vo)/dt]/(SovwΔπ), where So is the oocyte surface area, vw is the partial molar volume of water (18 cm3/mol), and Δπ is the osmotic gradient in milliosmoles/liter.
An osmotic gradient of 15–95 milliosmoles/liter was imposed on the oocyte (by removal of mannitol from the superfusing buffer) under voltage clamp (−100 mV) as sugar and/or the inhibitor phlorizin was added to the bath solution (10, 11). Within this range Lp was independent of the osmotic gradient. The osmotic permeability of oocytes, both control and cRNA-injected, was similar before and after impalement of the cell with the microelectrodes. In five cRNA-injected oocytes, Lp was 3.0 ± 0.5 × 10⁻⁴ cm/sec and 3.4 ± 0.4 × 10⁻⁴ cm/sec before and after impalement of the oocytes by the two microelectrodes.
RESULTS
First we describe the effect of SGLT1 protein on water permeability in the absence of glucose and then the interrelationships of Na+, glucose, and water transport mediated by SGLT1. Fig. 1 illustrates the protocol and the results obtained in one oocyte expressing SGLT1. Reducing the external osmolarity by 20 milliosmoles/liter in the absence of sugar (Fig. 1B) resulted in immediate swelling at a rate of 0.3% of the oocyte volume per min. In five SGLT1-expressing oocytes, the change in relative volume was 0.31 ± 0.03% per min, corresponding to a transport rate for water (Jw) of 46 ± 5 pl/sec, and equivalent to an osmotic permeability (Lp) of 3.4 ± 0.4 × 10⁻⁴ cm/sec. This is 3 times greater than the Lp of control oocytes, 1.1 ± 0.2 × 10⁻⁴ cm/sec (n = 4) (12). Phlorizin, a specific high-affinity inhibitor (Ki < 10 μM) of both Na+/glucose cotransport and the uncoupled transport of Na+ through SGLT1 in the absence of sugar (10, 13), eliminated the difference between the rates of swelling of SGLT1 and control oocytes: the Lp of SGLT1 oocytes in the presence of 100 μM phlorizin was 1.5 ± 0.2 × 10⁻⁴ cm/sec (n = 12). The activation energies (Ea) for water transport (Lps) were 12 ± 2 kcal/mol (n = 4) for control oocytes (see also ref. 6), 9 ± 1 kcal/mol (n = 4) for SGLT1 oocytes in the absence of sugar, and 12 ± 1 kcal/mol (n = 4) for SGLT1 oocytes in the presence of 100 μM phlorizin (data not shown) (1 cal = 4.184 J). In oocytes expressing the CHIP28 water channel Ea was 3–4 kcal/mol (6–8). These results suggest that SGLT1 behaves as a water channel in the absence of sugar, as has been reported for the facilitated glucose transporter GLUT1 expressed in oocytes (17), but the water conductance is only 1% of that for water channels (6, 8, 12).
Figure 1.
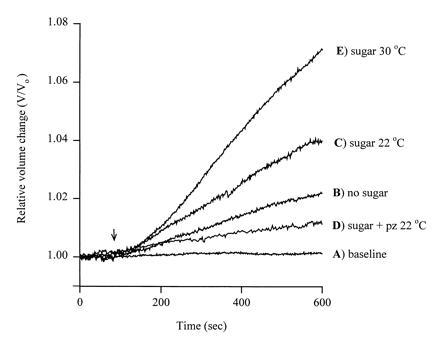
Volume changes in oocytes expressing SGLT1. The relative change in volume V/Vo (Vo initial volume), was plotted as a function of time. The oocyte was injected with rabbit SGLT1 cRNA, and the plasma membrane capacitance (Cm), SGLT1 transient charge movements (Q), and steady-state sugar-induced currents were recorded simultaneously (11). The oocyte was equilibrated in a buffer containing 90 mM NaCl, 2 mM KCl, 1 mM CaCl2, 1 mM MgCl2, 10 mM Hepes·Tris (pH 7.4), and 20 mM mannitol at 22°C. After volume equilibration, the oocyte was continuously superfused (arrow) with a test solution at 22°C: In A the test solution was identical to the equilibration buffer and the volume change was less than 0.03% per minute. In B the 20 mM mannitol was absent producing an inward osmotic gradient of 20 milliosmoles/liter. In C the 20 mM mannitol was replaced with 5 mM α-methyl d-glucopyranoside (αMDG), a saturating concentration of transported sugar. In D the test solution was identical to that in C except that 100 μM phlorizin, a specific competitive inhibitor of SGLT1, was included. In E the test solution was identical to that in C, but the experiment was at 30°C. The membrane potential was clamped at −100 mV for C–E. The plasma membrane area was 0.33 cm2, as estimated from the capacitance (325 nF) (11). Qmax, the maximal charge transfer, was 90 nC, and given a valence of 3.5 (12) this is equivalent to 1.6 × 10¹¹ SGLT1 transporters in the plasma membrane. The sugar-induced currents were 1900 nA in C and 5000 nA in E. The increase in current (transport) was proportional to the increase in sugar-dependent water flow.
When Na+/glucose cotransport was activated by adding glucose, a higher rate of swelling was recorded (0.5% per min, Fig. 1C). On the same five oocytes where we had measured water flow in the absence of sugar, under sugar-transporting conditions, the rate of swelling was 0.40 ± 0.04% per min, corresponding to a transport rate Jw of 60 ± 6 pl/sec and an apparent Lp of 5.5 ± 0.6 × 10⁻⁴ cm/sec. This sugar-coupled increase in water transport was blocked by 100 μM phlorizin (to 0.2% per min, Fig. 1D). After blockade by phlorizin, the Lp was 1.7 ± 0.3 × 10⁻⁴ cm/sec, not significantly different from control oocytes.
Increasing the temperature from 22 to 30°C under sugar-transporting conditions (Fig. 1E) increased the rate of swelling to 0.90 ± 0.11% (n = 3), and the rate of water transport to 136 ± 16 pl/sec (n = 3). Over the temperature range of 10–30°C, the activation energies for water transport (Jw) and Na+/glucose cotransport (I) were 23 ± 2 kcal/mol and 26 ± 4 kcal/mol (Fig. 2), considerably higher than expected for a water channel. The identity of the activation energies indicates that water transport is tightly coupled to Na+/glucose cotransport.
Figure 2.
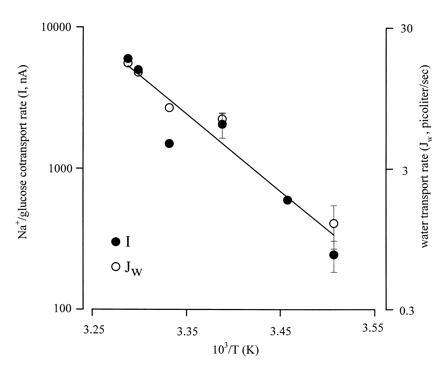
Arrhenius plots of Na+/glucose cotransport and glucose-dependent water flow. Sugar transport (•) is given as the current produced by a saturating concentration of αMDG (5 mM) in oocytes expressing rabbit SGLT1 and clamped at −100 mV. Water transport (○) is estimated from the rate of volume change of the oocyte in the presence of αMDG in the same oocytes clamped at −100 mV. The line was drawn by linear regression with slope −13 ± 2 and corresponds to an activation energy Ea (Ea = −R·slope, R is the gas constant) of 26 ± 4 kcal/mol. The experiment was performed on five oocytes with Qmax = 65 ± 9 nC and Cm = 430 ± 34 nF. At 22°C, the sugar-dependent current was 2063 ± 420 nA. Data without error bars indicate individual experiments, and n was 5 oocytes at 22°C and 4 at 12°C.
Fig. 3 shows that there is a linear relationship between water transport and Na+/glucose cotransport. The slope, 24 ± 2 × 10⁻³ pl per sec per nA, corresponds to a coupling ratio of 130 ± 9 water molecules per inward positive charge, given the partial molar volume of water (18 cm3/mol) and the Faraday (96,500 C/mol). Since 2 Na+ ions are transported with a sugar molecule per transport cycle (13–15), this yields a value of 260 ± 18 water molecules transported during each cycle of the transporter.
Figure 3.
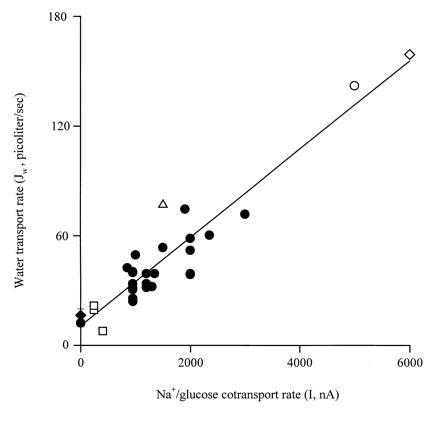
Relationship between water transport and Na+/glucose cotransport. The data were obtained at different clamp voltages and temperatures: 31°C(⋄), 30°C (○), 27°C (▵), 22°C (•), and 12°C (□). At 0 nA, the data represented by • were obtained on control noninjected oocytes (n = 4) and ♦ were obtained in the presence of 5 mM αMDG and 100 μM phlorizin (n = 5). The slope 24 ± 2 × 10⁻³ pl per sec per nA corresponds to a turnover of 130 ± 9 mol of water per mol of inward positive charge. There was also a linear relationship between Jw and Qmax (slope, 4.9 ± 0.7 × 10⁻¹ pl per sec per nC) and between Imax and Qmax (slope, 23 ± 2/sec).
The number of SGLT1 proteins in the oocyte plasma membrane can be estimated from pre-steady-state charge measurements (Q) associated with SGLT1 and from freeze–fracture electronmicroscopy (11, 12). A plot of the rate of water transport Jw versus maximal charge Qmax yielded a linear relationship with slope 5 ± 1 × 10⁻¹ pl per sec per nC (data not shown). Given that there are 3.5 charges per SGLT1 protein (12), we estimate that 9000 water molecules are transported by each SGLT1 protein per second at 22°C. This is consistent with the number of water molecules transported each cycle (260 water molecules) and the turnover rate (23 ± 2/sec) of the cotransporter. A plot of Imax versus Qmax yielded a linear relationship with slope 23 ± 2/sec and is the same as the turnover number (25/sec) obtained previously (18).
Direct coupling between water and Na+/glucose cotransport can be demonstrated in experiments where sugar transport is rapidly altered by voltage. Fig. 4 shows an experiment where Na+/glucose cotransport is increased 4-fold (from 280 to 950 nA) by stepping the membrane voltage from 0 to −100 mV. Water transport also increased 4-fold, from 9 to 40 pl/sec. More importantly, upon the voltage jump, the increase in water flow was instantaneous (<10 sec) and indicates that water flow is not caused by the accumulation of Na+ and sugar in the cell (see Discussion).
Figure 4.
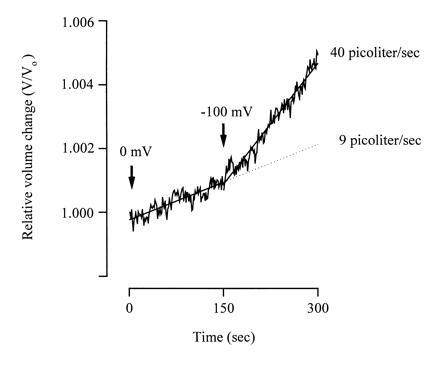
Dependence of water transport on membrane voltage. During the experiment, the oocyte expressing SGLT1 was superfused with a test solution containing 5 mM αMDG with an inward osmotic gradient of 15 milliosmoles/liter (Fig. 1). Membrane voltage was initially ≈0 mV, and after 150 sec, it was stepped to −100 mV. The sugar-coupled current and water transport both increased ≈4-fold, from 280 to 950 nA and 9 to 40 pl/sec. The increase in water transport was immediate (<10 sec) with the voltage jump and the increase in current.
To differentiate between cotransport of water by SGLT1 and a sugar-dependent increase in SGLT1 osmotic permeability (Lp), the phlorizin-sensitive sugar-dependent water flow was measured as a function of the osmotic gradient. The rationale of this experiment was that water transport should be proportional to Na+/glucose cotransport and relatively independent of the osmotic gradient, whereas osmotic flow through the transporter should be proportional to the osmotic gradient. Fig. 5 shows that the phlorizin-sensitive water flow, ≈3.5 pl/sec, was independent of the osmotic gradient.
Figure 5.
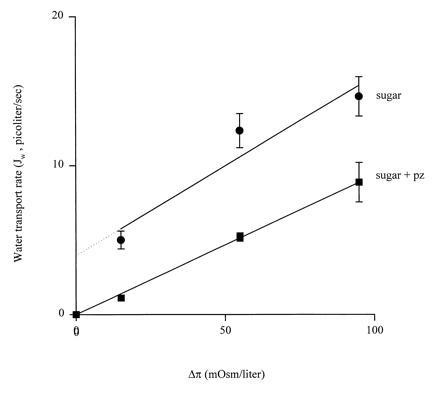
Relationship between volume flow and osmotic gradient in oocytes in the presence of sugar (αMDG) and the presence of sugar and phlorizin. The experiment was performed on five oocytes by dilution of mannitol in the bathing medium (50 mM NaCl/100 mM mannitol/2 mM KCl/1 mM CaCl2/1 mM MgCl2/10 mM Hepes·Tris at pH 7.4) (at 22°C) to 80, 60, and 0 mM in the presence of 5 mM αMDG. The lines were obtained by linear regression with slopes 1.2 ± 0.2 pl per sec per milliosmole per liter in the presence (▪) and 1.0 ± 0.1 pl per sec per milliosmole per liter in the absence (•) of phlorizin. These slopes correspond to an Lp of 1.3 ± 0.1 × 10⁻⁴ cm/sec, indistinguishable from that for control noninjected oocytes. Symbols without error bars indicate that the error is smaller than the size of the symbol. We did not observed any sustained cell swelling when sugar was added to a clamped oocyte in the absence of an external osmotic gradient (stippled line), and this is probably due to mechanical properties of the oocyte (16).
DISCUSSION
It has long been known that water movement across the intestine is linked to solute transport, in particular, to salt and sugar. In this study, we showed that the Na+/glucose cotransporter is a low-conductance water channel, and more importantly, water is cotransported with Na+ and sugar. Water cotransport is supported by the following observations: (i) water flux is directly correlated with Na+ and glucose flux (Fig. 1) and the number of SGLT1 proteins in the oocyte plasma membrane; (ii) there is a strict stoichiometric relationship between water and Na+/glucose cotransport (260 H2O/2 Na+/glucose; Fig. 3); (iii) water transport and Na+/glucose cotransport share the same high activation energy (26 kcal/mol, Fig. 2); (iv) there is no delay between water movement and Na+ and glucose transport (Fig. 4); and (v) coupled water transport is independent of the osmotic gradient (Fig. 5).
Can the observed water flux occur via osmotic gradients generated by the transport of Na+ and glucose? As an upper limit, assume that two Na+ ions, one glucose, and two anions enter the cell for each turnover, then a current of 1000 nA (10.4 picoosmoles/sec, Fig. 4) would increase the osmolarity of a 1.2-mm-diameter oocyte by 0.05 milliosmoles per liter per sec. In 10 sec (Fig. 4), the intracellular osmolarity will have increased by less than 0.5 milliosmoles/liter if the cell interior is well-mixed, while our experiments show that a gradient of 60 milliosmoles/liter is required to generate the observed water flows (Fig. 5). Thus the osmotic influx of water resulting from the influx of Na+ and glucose is too small to affect the measurements.
Can the link between Na+/glucose cotransport and water flow be explained by local osmotic phenomena, such as unstirred layers? The relationship between solute and volume flows due to unstirred layers is given by (19): Jw = JsLpRT(δo + δi)/(Ds + cs(δo + δi)LpRT), where Jw is the volume flow, Js is the net solute flux, Lp is the hydraulic conductivity, Ds is the solute diffusion coefficient in the unstirred layers, δo and δi are the effective thicknesses of the outer and inner unstirred layers, and R and T are the gas constant and temperature. With unstirred layers as large as the oocyte (1.2 mm), this equation and the experimental values—Lp = 4.1 × 10⁻⁷ cm per sec per atm, cs = 2 × 10⁻⁴ mol/cm3, Js = 2.53 × 10⁻¹¹ mol per cm2 per sec (Fig. 1C), and Ds = 4 × 10⁻⁶ cm2/sec—predict a water flow Jw of 4.5 × 10⁻⁹ cm/sec, which is only 3% of the observed values. Thus we conclude that water transport is directly coupled to Na+ and glucose cotransport.
Our finding of cotransport of water, sodium, and sugar by SGLT1 gives a molecular rationale for both the driving force and the pathway for water transport across the brush border membrane of the intestine. This secondary active mode of water transport is distinguished from simple osmosis by (i) the high activation energy, (ii) the strict stoichiometric relation to the transport of Na+ and glucose, and (iii) the independence from the osmotic gradient. Our results indicate that water is cotransported with Na+ and sugar via conformational changes of the protein and are consistent with the mechanism of Na+/sugar cotransport and the structure of sugar-binding proteins. Since SGLT1 can transport large glucosides (molecular dimensions up to 10 × 5 × 5 Å), the presence of 260 water molecules around the sugar binding site are reasonable (20). X-ray crystallographic studies of sugar-binding proteins indicate water can occupy 5–10% of the protein volume (300–500 water molecules) (21). It has also been found that sugar can modify the number of water molecules bound to proteins (22).
What is the physiological relevance of secondary active transport of water? In the case of the human small intestine, about 1 mol of glucose is absorbed by the intestine from an average diet containing 350 g of carbohydrate. Given a coupling coefficient of 260 water molecules per turnover of the Na+/glucose cotransporter, this implies that approximately 5 liters of water are transported each day across the brush borders of the enterocytes via the intestinal glucose cotransporters (1 mol of sugar is transported with 260 mol of water, given vw = 18 cm3/mol, so 4.8 liters of water would be transported with 1 mol of glucose). Other nutrient transporters such as those for amino acids and peptides are also expected to contribute to the total water flow across the apical membrane of the intestine. Flows of such magnitude would account for the role of glucose in oral rehydration solutions (1). Secondary active transport of water in basolateral cotransporters, e.g. K+/Cl− could account for water exit from the cell into the blood (4, 5). The coupling of water flows to cotransporters will, therefore, account for water flows across epithelial tissues such as the intestine and renal proximal tubule and explain the link between active sugar transport and water fluxes.
How general is this phenomenon for other cotransport proteins. In preliminary experiments, the cloned rat thyroid Na+/iodide (23), human brain Na+/Cl−/γ-aminobutyric acid (GABA) (24), and plant H+/amino acid (25) cotransporters also exhibited coupled water transport. The coupling coefficients ranged from 50 water molecules per inward positive charge for the H+/amino acid transporter (AAP5) to 200 water molecules per inward positive charge for the Na+/I− transporter. This, together with the findings of water cotransport in the amphibian K+/Cl−, H+/lactate, and Na+/alanine cotransporters (26, 27), suggests that secondary active water transport occurs via a wide variety of cotransporters in animal and plant cells.
Acknowledgments
We thank M. Contreras for assistance with the oocytes; Drs. N. Carrasco, H. Sarkar, and K. Boorer for providing the clones for Na+/I−, Na+/Cl−/γ-aminobutyric acid, and H+/amino acid cotransporters; and Drs. B. Hirayama, M. Martín, and J. Hall for their helpful comments on the manuscript. This work was supported by National Institutes of Health Grants DK19567, NS25554, EY-05661, and DK41301 and the Danish Research Council and the Novo Nordisk Foundation.
Footnotes
Abbreviations: SGLT1, Na+/glucose cotransporter; αMDG, α-methyl d-glucopyranoside.
References
- 1.Hirschhorn N, Greenough W B. Sci Am. 1991;264:50–56. doi: 10.1038/scientificamerican0591-50. [DOI] [PubMed] [Google Scholar]
- 2.Diamond J M, Bossert W H. J Gen Physiol. 1967;50:2061–2083. doi: 10.1085/jgp.50.8.2061. [DOI] [PMC free article] [PubMed] [Google Scholar]
- 3.House C R. Water Transport in Cells and Tissues. London: Edward Arnold; 1974. [Google Scholar]
- 4.Zeuthen T. Int Rev Cytol. 1995;160:99–161. doi: 10.1016/s0074-7696(08)61554-5. [DOI] [PubMed] [Google Scholar]
- 5.Zeuthen T. Molecular Mechanisms of Water Transport. Berlin: Springer; 1996. [Google Scholar]
- 6.Preston G M, Carroll T P, Guggino W B, Agre P. Science. 1992;256:385–387. doi: 10.1126/science.256.5055.385. [DOI] [PubMed] [Google Scholar]
- 7.Nielsen S, Smith B L, Christensen E I, Agre P. Proc Natl Acad Sci USA. 1993;90:7275–7279. doi: 10.1073/pnas.90.15.7275. [DOI] [PMC free article] [PubMed] [Google Scholar]
- 8.King L S, Agre P. Annu Rev Physiol. 1996;58:619–648. doi: 10.1146/annurev.ph.58.030196.003155. [DOI] [PubMed] [Google Scholar]
- 9.Heeswikj M P E, van Os CH. J Membr Biol. 1986;92:183–193. doi: 10.1007/BF01870707. [DOI] [PubMed] [Google Scholar]
- 10.Hediger M A, Coady M J, Ikeda T S, Wright E M. Nature (London) 1987;330:379–381. doi: 10.1038/330379a0. [DOI] [PubMed] [Google Scholar]
- 11.Loo D D F, Hazama A, Supplisson S, Turk E, Wright E M. Proc Natl Acad Sci USA. 1993;90:5767–5771. doi: 10.1073/pnas.90.12.5767. [DOI] [PMC free article] [PubMed] [Google Scholar]
- 12.Zampighi G, Kreman M, Boorer K J, Loo D D F, Bezanilla F, Chandy G, Hall J E, Wright E M. J Membr Biol. 1995;148:65–78. doi: 10.1007/BF00234157. [DOI] [PubMed] [Google Scholar]
- 13.Umbach J, Coady M J, Wright E M. Biophys J. 1990;57:1218–1224. doi: 10.1016/S0006-3495(90)82640-0. [DOI] [PMC free article] [PubMed] [Google Scholar]
- 14.Birnir B, Loo D D F, Wright E M. Pflügers Arch. 1991;418:79–85. doi: 10.1007/BF00370455. [DOI] [PubMed] [Google Scholar]
- 15.Parent L, Supplisson S, Loo D D F, Wright E M. J Membr Biol. 1992;125:49–62. doi: 10.1007/BF00235797. [DOI] [PubMed] [Google Scholar]
- 16.Zhang R, Verkman A S. Am J Physiol. 1991;260:C26–34. doi: 10.1152/ajpcell.1991.260.1.C26. [DOI] [PubMed] [Google Scholar]
- 17.Fischbarg J, Kuang K, Vera J C, Arant S, Silverstein S C, Loike J, Rosen O M. Proc Natl Acad Sci USA. 1990;87:3244–3247. doi: 10.1073/pnas.87.8.3244. [DOI] [PMC free article] [PubMed] [Google Scholar]
- 18.Panayotova-Heiermann M, Loo D D F, Wright E M. J Biol Chem. 1994;269:21016–21020. [PubMed] [Google Scholar]
- 19.Dainty J, House C R. J Physiol (London) 1966;182:66–78. doi: 10.1113/jphysiol.1966.sp007809. [DOI] [PMC free article] [PubMed] [Google Scholar]
- 20.Lostao M P, Hirayama B A, Loo D D F, Wright E M. J Membr Biol. 1994;142:161–170. doi: 10.1007/BF00234938. [DOI] [PubMed] [Google Scholar]
- 21.Qian M, Haser R, Payan F. Protein Sci. 1995;4:747–755. doi: 10.1002/pro.5560040414. [DOI] [PMC free article] [PubMed] [Google Scholar]
- 22.Rand R P, Fuller N L, Butko P, Francis G, Nicholls P. Biochemistry. 1993;32:5925–5929. doi: 10.1021/bi00074a001. [DOI] [PubMed] [Google Scholar]
- 23.Dai G, Levy O, Carrasco N. Nature (London) 1996;379:458–460. doi: 10.1038/379458a0. [DOI] [PubMed] [Google Scholar]
- 24.Nelson H, Mandiyan S, Nelson N. FEBS Lett. 1990;269:181–184. doi: 10.1016/0014-5793(90)81149-i. [DOI] [PubMed] [Google Scholar]
- 25.Fischer W N, Kwart M, Hummel S, Frommer W B. J Biol Chem. 1995;270:16315–16320. doi: 10.1074/jbc.270.27.16315. [DOI] [PubMed] [Google Scholar]
- 26.Zeuthen T. J Physiol (London) 1994;478:203–219. doi: 10.1113/jphysiol.1994.sp020243. [DOI] [PMC free article] [PubMed] [Google Scholar]
- 27.Zeuthen, T., Hamann, S. & la Cour, M. (1996) J. Physiol. (London), in press. [DOI] [PMC free article] [PubMed]


